
On the Use of Visual Transformer for Image Complexity Assessment
Luigi Celona
a
, Gianluigi Ciocca
b
and Raimondo Schettini
c
Department of Informatics, Systems and Communication, University of Milano-Bicocca,
viale Sarca 336, 20126 Milano, Italy
fi
Keywords:
Image Complexity, Feature Extraction, Self-Supervised, Supervised, Transfer Learning, Vision Transformers.
Abstract:
Perceiving image complexity is a crucial aspect of human visual understanding, yet explicitly assessing image
complexity poses challenges. Historically, this aspect has been understudied due to its inherent subjectivity,
stemming from its reliance on human perception, and the semantic dependency of image complexity in the
face of diverse real-world images. Different computational models for image complexity estimation have
been proposed in the literature. These models leverage a variety of techniques ranging from low-level, hand-
crafted features, to advanced machine learning algorithms. This paper explores the use of recent deep-learning
approaches based on Visual Transformer to extract robust information for image complexity estimation in a
transfer learning paradigm. Specifically, we propose to leverage three visual backbones, CLIP, DINO-v2,
and ImageNetViT, as feature extractors, coupled with a Support Vector Regressor with Radial Basis Function
kernel as an image complexity estimator. We test our approach on two widely used benchmark datasets
(i.e. IC9600 and SAVOIAS) in an intra-dataset and inter-dataset workflow. Our experiments demonstrate the
effectiveness of the CLIP-based features for accurate image complexity estimation with results comparable to
end-to-end solutions.
1 INTRODUCTION
Image complexity (IC) estimation is a fundamental
task in computer vision with implications spanning a
wide range of applications, including image retrieval,
compression, and quality assessment. Accurate es-
timation of IC is critical for optimizing algorithms
and models, enhancing user experience, and ensuring
that visual content is appropriately processed. Quan-
tify and characterize the complexity of visual contents
has driven researchers to explore diverse methodolo-
gies, predominantly classified into supervised, unsu-
pervised, and, more recently, self-supervised learning
paradigms.
Unsupervised methods heavily depends on the
definition of ad-hoc features (mostly hand-crafted) to
describe IC. Since IC is a multi-faceted concept, sev-
eral features are usually considered to capture image
content from different perspectives. This requires the
development of fusion methods to distill a complexity
score from a set of features. Designing computational
models for a general IC definition is cumbersome so
a
https://orcid.org/0000-0002-5925-2646
b
https://orcid.org/0000-0003-2878-2131
c
https://orcid.org/0000-0001-7461-1451
existing algorithms focus on specific definitions of vi-
sual complexity and features.
Supervised learning approaches, on the other
hand, rely on annotated datasets for model training,
requiring an extensive and often impractical invest-
ment of human labor to label images accurately. Ad-
ditionally, supervised methods may falter when con-
fronted with diverse and dynamic datasets, as the pre-
defined labels may not capture the multifaceted na-
ture of IC. On the other hand, unsupervised methods,
while not burdened by the need for labeled data, often
lack the ability to discern intricate hierarchical struc-
tures and semantic relationships within images.
Self-supervised learning is a paradigm that has
gained momentum in recent years for its capacity to
harness the intrinsic information present in unlabeled
data. By formulating tasks that exploit the inherent
relationships between different parts of an image or
leveraging temporal coherence, self-supervised meth-
ods autonomously generate supervisory signals. This
eliminates the need for explicit human annotations
and enables models to learn rich and nuanced repre-
sentations of visual content.
In this paper, we investigate the use of the most
recent neural network architectures exploiting Vision
640
Celona, L., Ciocca, G. and Schettini, R.
On the Use of Visual Transformer for Image Complexity Assessment.
DOI: 10.5220/0012426500003660
Paper published under CC license (CC BY-NC-ND 4.0)
In Proceedings of the 19th International Joint Conference on Computer Vision, Imaging and Computer Graphics Theory and Applications (VISIGRAPP 2024) - Volume 3: VISAPP, pages
640-647
ISBN: 978-989-758-679-8; ISSN: 2184-4321
Proceedings Copyright © 2024 by SCITEPRESS – Science and Technology Publications, Lda.

Transformer (ViT). These architectures have been
demonstrated to outperforms traditional architectures
such as Convolutional Neural Networks (CNNs) in
solving many computer vision problems. Our hypoth-
esis is that ViT can be also exploited for IC estima-
tion. We propose to leverage features extracted from
pre-trained ViT models coupled with Support Vector
Regressor (SVR) with a Radial Basis Function (RBF)
kernel. The extracted features may hold the poten-
tial to provide a more nuanced and accurate under-
standing of visual complexity with respect to existing
methods in the literature. We employ three distinct vi-
sual backbones, namely CLIP (Radford et al., 2021),
DINO-v2 (Oquab et al., 2023), and ImageNetViT
(Dosovitskiy et al., 2021), each serving as a feature
extractor to characterize IC. We test our hypothesis
on IC9600 (Feng et al., 2023), and SAVOIAS (Saraee
et al., 2020), two widely used benchmark datasets for
IC estimation.
2 RELATED WORK
Human perception of IC have been thoroughly stud-
ied in many works where researchers have investi-
gated visual complexity and the factors that influ-
ence its perception by humans (Snodgrass and Van-
derwart, 1980; Rao and Lohse, 1993; Heaps and Han-
del, 1999; Olivia et al., 2004; Donderi, 2006; Gauvrit
et al., 2014). From these studies emerged that visual
complexity is a multifaceted concept that is difficult
to fit in a specific definition. For this reason many
different cues must be considered. For example vi-
sual attributes such as the number of objects, open-
ness, clutter, symmetry, organization, and variety of
colors (Olivia et al., 2004), and high level concepts
such as familiarity (Forsythe, 2009) and visual atten-
tion (Da Silva et al., 2011). Complexity has been even
defined in terms of a degradation of performance at
some task (Rosenholtz et al., 2005).
The computational algorithm for IC estimation in
the literature are based on the computation of some
features on the image, and extracting a complexity
score from them. Early works exploit hand-crafted
features and unsupervised approaches to distill a com-
plexity score. More recent works are based on neural
networks and deep learning that are able to learn fea-
tures from the data. End-to-end approaches are ca-
pable of learning new representations and computing
complexity scores simultaneously.
2.1 Image Complexity by Hand-Crafted
Features
Early works in IC estimation exploit hand-crafted fea-
tures tailored for the definition of visual complexity
considered. The algorithms output a measure of vi-
sual complexity or features that are further processed
with statistical or machine learning methods to obtain
the final complexity score.
VisualClutter (Rosenholtz et al., 2007) is a widely
recognized method that leverages a variety of low-
level visual features to estimate IC by taking into ac-
count the size of visual objects. Cardaci et al. (Car-
daci et al., 2009) applied a fuzzy approach to the IC
estimation. The complexity is based on the entropy
theory and a set of low-level visual features are com-
puted to describe it. Complexity is often evaluated
in terms of ease of compression of the information
(Yu and Winkler, 2013). Visual saliency has been
also considered as a possible measure of complexity
(Da Silva et al., 2011; Liu et al., 2016). IC is often
studied in the context of patterns and textures (Mir-
jalili and Hardeberg, 2022) where visual features are
extracted from grayscale images.
Machine learning algorithms can be used to de-
rive better complexity measures from multiple fea-
tures and measures. A simple regressor model can
be applied to combine them into a single score (Pur-
chase et al., 2012). Also classification is another way
to combine complexity measures. One of the most
common approach is based on Support Vector Ma-
chine (Guo et al., 2018) that can be used to classify
images into a set of complexity categories. Artifi-
cial intelligence has been exploited for assessing IC.
For example neural networks have been successfully
used to combine heterogeneous features (Machado
et al., 2015; Chen et al., 2015), while evolutionary
algorithms are used to solve optimization problems
in an efficient way (Corchs et al., 2016). Feature
Selection with Multiple Kernel Learning algorithm
is another approach that can be used to analyze and
combine many different features in an efficient way
(Fernandez-Lozano et al., 2019).
2.2 Image Complexity by Learned
Features
In recent years, features automatically learned from
images using deep neural networks have been consid-
ered. These have been demonstrated to be expressive
and robust in a plethora of computer vision and image
understanding tasks.
It is well known that transfer learning of features
learned by CNNs in a given task can be leveraged
On the Use of Visual Transformer for Image Complexity Assessment
641

for another task (Sharif Razavian et al., 2014). Tra-
ditional machine learning approaches (e.g. Support
Vector Machines) coupled with learned features can
be exploited for estimating IC (Abdelwahab et al.,
2019). Support Vector Ordinal Regressor can achieve
superior results with respect to traditional approaches
(Xiao et al., 2018) for IC estimation. Features ex-
tracted from the activations of the max-pooling layers
can be used to assess IC (Saraee et al., 2020). Also, a
complexity score can be obtained by adding a regres-
sion or classification layer on a network whose fea-
tures have been learned on a large dataset for another
task (Akc¸a and Tanrı
¨
over, 2022).
Using deep learning methods, end-to-end learn-
ing can be leveraged. This technique is capable of
simultaneously learning the features and the optimal
parameters for either a classification or a regression
task. For example, in (Nagle and Lavie, 2020) is
presented a CNN trained to learn perceived ratings
of visual complexity. The predicted complexity of
the network achieves a better correlation with subjec-
tive scores than a linear regressor optimized on sev-
eral low level features. ICNet (Feng et al., 2023) is
a very recent approach that combines IC estimation
with contextual information from a neural network.
While ICNet holds potential for IC evaluation, it de-
mands significant computational resources and anno-
tated data for training.
The introduction of Vision Transformer (ViT) net-
works (Dosovitskiy et al., 2021) marked a break-
through innovation in deep learning approaches. ViT
divides an image into fixed-size patches, linearly em-
beds them, and processes them using a transformer
encoder. These networks are able to process differ-
ent data and exhibit superior performance on recog-
nition tasks, generative modeling, low-level vision,
video and 3D analysis (Khan et al., 2022; Han et al.,
2022). Due the necessity of large datasets, pre-
training strategies have been developed leveraging
transformers trained on different modalities (e.g. Nat-
ural Language Processing). For example, Swin Trans-
former (Liu et al., 2021), CLIP (Radford et al., 2021),
and DINO (Caron et al., 2021) have demonstrated the
efficacy of learning generic representations improv-
ing performance on downstream tasks through trans-
fer learning.
3 EVALUATION FRAMEWORK
3.1 Datasets
For our experiments we exploit two benchmark
dataset for IC assessment, namely IC9600 (Feng
et al., 2023) and SAVOIAS (Saraee et al., 2020).
3.1.1 IC9600
The IC9600 dataset (Feng et al., 2023) is a collection
of 9600 images depicting eight categories of content,
including abstract, advertisement, architecture, ob-
ject, painting, person, scene, and transportation. Im-
ages for each category are sampled from several pop-
ular datasets. Specifically, abstract and architecture
images are sampled from AVA (Murray et al., 2012),
advertisement images from Image and Video Adver-
tisements (Hussain et al., 2017), object images from
MS-COCO (Lin et al., 2014), painting images from
JenAesthetics (Amirshahi et al., 2015), person images
from WiderPerson (Zhang et al., 2019), scene images
from Places365 (Zhou et al., 2017), and transporta-
tion images from BDD100K (Yu et al., 2020). Each of
the eight categories contains approximately 1,500 im-
ages. Within the dataset, every image has been anno-
tated by multiple experts who assessed its complexity
by evaluating one stimulus at a time across five dif-
ferent levels of complexity. Figure 1 showcases a se-
lection of samples from the IC9600 dataset, each ac-
companied by its corresponding annotated complex-
ity score.
3.1.2 SAVOIAS
The SAVOIAS (Saraee et al., 2020) dataset comprises
over 1,400 images spanning seven image categories
collected images from commonly-used datasets. Im-
ages for the category Advertisements have been gath-
ered from the Advertisement dataset (Hussain et al.,
2017), Art and Suprematism images have been sam-
pled from the PeopleArt dataset (Westlake et al.,
2016), Infographics and Visualization images belong
to the MASSViS dataset (Borkin et al., 2013), In-
terior Design images have been gathered from the
IKEA website
1
, images containing Objects from MS-
COCO dataset (Lin et al., 2014), Scenes have been
sampled from the Places2 dataset (Zhou et al., 2017).
Within each category, there are about 200 images.
The ground truth for SAVOIAS is meticulously cu-
rated through crowdsourcing, involving over 37,000
pairwise comparisons of images using the forced-
choice methodology. This extensive process engages
the input of more than 1,600 contributors. Figure 2
shows sample images for two categories with IC in-
creasing from left to right for each row.
1
https://www.ikea.com
VISAPP 2024 - 19th International Conference on Computer Vision Theory and Applications
642
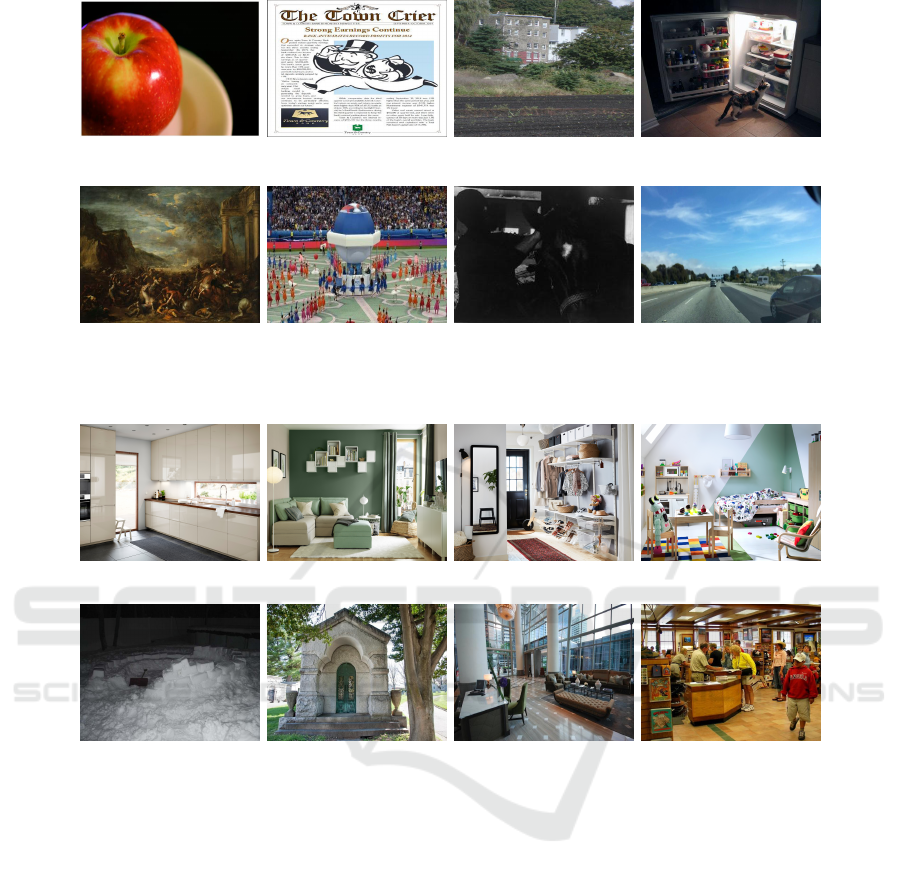
abstract – 0.12 advertisement – 0.47 architecture – 0.53 object – 0.54
painting – 0.69 person – 0.91 scene – 0.34 transportation – 0.37
Figure 1: Sample images with the corresponding annotated complexity score belonging to the eight content categories of the
IC9600 dataset (Feng et al., 2023).
0 GGGA 34 GGGA 67 GGGA 100
Figure 2: Sample images from the SAVOIAS dataset (Saraee et al., 2020) with increased visual complexity (numbers middle
row). Top row: images belonging to the Interior Design category. Bottom row: images from the Scenes category.
3.2 Visual Backbones
In our experimental analysis, we employ three dis-
tinct visual backbones, namely CLIP (Radford et al.,
2021), DINO-v2 (Oquab et al., 2023), and Ima-
geNetViT (Dosovitskiy et al., 2021), each serving as
a feature extractor to characterize IC. It is notewor-
thy that all three backbones share the same founda-
tional Vision Transformer architecture (Dosovitskiy
et al., 2021), establishing a fair and consistent ba-
sis for comparison among the applied methodologies.
The primary difference among these visual backbones
resides in their respective training approaches, which
contribute to the diversity of features they can capture.
CLIP leverages natural language supervision to fa-
cilitate the learning of visual representations. Specif-
ically, it undergoes pre-training with a contrastive ob-
jective aimed at maximizing the cosine similarity of
correct image-text pairs. The training data for CLIP
is sourced from the WebImageText (WIT) dataset, en-
suring exposure to a wide range of visual and textual
information.
DINO (Caron et al., 2021) implements a student
network that learns to predict global features in an
image from local patches supervised by the cross en-
tropy loss from a momentum Teacher network em-
beddings. DINO-v2 (Oquab et al., 2023), an exten-
sion of the original DINO model, is self-supervised. It
introduces additional pre-training objectives, includ-
ing randomly masking patches of local views. This
augmentation compels the model to learn the intricate
task of reconstructing the masked areas, enhancing its
ability to discern complex visual patterns. The train-
ing dataset for DINO-v2 is LVD-142M (Oquab et al.,
2023) which provides a diverse and extensive set of
images for comprehensive feature learning.
In contrast, ImageNetViT undergoes supervised
On the Use of Visual Transformer for Image Complexity Assessment
643

training explicitly for the image categorization task
using the ImageNet dataset. This targeted training ap-
proach equips the model with the capability to recog-
nize and characterize diverse visual elements within
images, contributing to its effectiveness in handling
complex visual content.
By adopting these different training strategies, our
chosen visual backbones provide a rich set of features
that contribute to a different characterization of IC.
The shared architecture ensures a level playing field
for comparison, while the different training method-
ologies allow each backbone to capture nuanced as-
pects of visual information.
4 METHOD
In this section we describe our proposed method for
quantifying the effectiveness of the information cap-
tured by the previously described visual backbones
for IC assessment. Specifically, the visual backbones
serve as feature extractors, then we employ a Support
Vector Regressor (SVR) as a tool for mapping the ex-
tracted feature vectors into a complexity score.
4.1 Feature Extractor
Each image x ∈ R
C×H×W
is encoded by serving from
each of the visual backbones to obtain a feature vec-
tor e ∈ R
D
. Specifically, every image x is initially
divided into a sequence of squared patches denoted
as {x
i
p
}
N
i=1
. Here, C, H, and W represent the chan-
nel, height, and width of the image respectively, while
x
i
p
∈ R
P
2
C
corresponds to the i-th image patch with
a size of P × P. Subsequently, the sequence of im-
age patches is linearly projected into the embedding
dimensionality D of the model. At this stage, a
learnable classification token [CLS] from the input se-
quence is concatenated. After L self-attention blocks,
the [CLS] token is saved as the feature vector e of the
image. The obtained feature vector is l
2
-normalized
before further processing.
For the three models we employ the Large version
of ViT, known as ViT-L. This particular version com-
prises 85 million learnable parameters, an embedding
dimensionality of 1024 (D = 1024), and L = 24 self-
attention blocks. The input image size considered is
C = 3, H = 224, W = 224, and the image patch size
(P) is 14.
4.2 Support Vector Regressor
We leverage the features extracted from visual back-
bones to train a SVR with a Radial Basis Function
(RBF) kernel. The primary objective is to discern the
key features that exhibit the most pronounced differ-
entiation between images characterized by high and
low complexity.
5 ViT-L FOR IMAGE
COMPLEXITY
In this section we describe an end-to-end trained
ViT-L architecture for IC assessment on the IC9600
dataset. This model aims to estimate the upper bound,
i.e., the result that can be obtained with the same ar-
chitecture as the competitors by directly performing
supervised learning for image complexity. The model
is implemented in the PyTorch (Paszke et al., 2019)
framework using a NVIDIA TITAN Xp GPU. We ini-
tialize the parameters of the model with a pre-trained
model on ImageNet. Optimization is performed using
mini-batch Stochastic Gradient Descent (SGD) with a
batch size of 32, a momentum of 0.9, and a weight de-
cay of 0.001. The initial learning rate is set to 0.001
and is divided by 5 every 10 epochs. We optimize the
model by minimizing the Mean Squared Error (MSE)
loss for 30 epochs:
L =
1
N
N
∑
j=1
(S − S
gt
), (1)
where N is the number of samples in the mini-batch,
S and S
gt
are the predicted and ground-truth scores,
respectively. During training, images are augmented
by random horizontal flipping.
6 EXPERIMENTS AND RESULTS
6.1 Experimental Setup
We conduct our experiments mainly on the IC9600
dataset. Specifically, we exploit the splits provided
by the authors consisting of 6720 training images and
2880 test images. In contrast, cross-dataset exper-
iments are conducted on the entire SAVOIAS. Per-
formance is measured in terms of Pearson’s Lin-
ear Correlation Coefficient (PLCC), Spearman’s Rank
Order Correlation Coefficient (SROCC), Root Mean
Squared Error (RMSE), and Root Mean Absolute Er-
ror (RMAE).
6.2 Results
In this section we report results for the intra-dataset
experiment where training and testing are done on
VISAPP 2024 - 19th International Conference on Computer Vision Theory and Applications
644

Table 1: Results on the IC9600 test set in terms of RMSE, RMAE, PLCC, and SROCC. Best and second best results are
highlighted in bold and underline, respectively.
Method RMSE (↓) RMAE (↓) PLCC (↑) SROCC (↑)
Durmus (Durmus, 2020) – – 0.1261 0.2237
VisualClutter (Rosenholtz et al., 2007) – – 0.5075 0.4477
Corchs et al. (Corchs et al., 2016) – – 0.5509 0.6368
UAE (Saraee et al., 2020) – – 0.6075 0.5951
ICNet (Feng et al., 2023) 0.0528 0.2032 0.9492 0.9449
ViT-L 0.2136 0.4105 0.9015 0.8983
ImageNetViT 0.0852 0.2564 0.8570 0.8551
CLIP 0.0713 0.2340 0.8913 0.8845
DINO-v2 0.0856 0.2554 0.8517 0.8471
Table 2: Results on the whole SAVOIAS dataset obtained
by methods trained on the IC9600 training set.
Method PLCC (↑) SROCC (↑)
UAE (Saraee et al., 2020) 0.7198 0.7204
ICNet (Feng et al., 2023) 0.8492 0.8519
ViT-L 0.7692 0.7619
ImageNetViT 0.6742 0.6667
CLIP 0.7577 0.7547
DINO-v2 0.6886 0.6749
IC9600, and inter-dataset experiment in which mod-
els trained on IC9600 are evaluated on the entire
SAVOIAS. The considered visual backbones are com-
pared with the following five state-of-the-art methods:
Durmus (Durmus, 2020), VisualClutter (Rosenholtz
et al., 2007), Corchs et al. (Corchs et al., 2016),
UAE (Saraee et al., 2020), ICNet (Feng et al., 2023).
Intra-Dataset Results. Table 1 reports the results
achieved on the IC9600 test set. Note that RMSE and
RMAE are not estimated due to the different calibra-
tion between IC intensity and the estimated score for
Durmus, VisualClutter, Corchs et al., and UAE. Given
the achieved performance, several consideration can
be drawn. First, our method attains superior perfor-
mance when leveraging features extracted from CLIP
compared to alternative versions relying on DINO-v2
(SROCC: -0.04) and ImageNetViT (SROCC: -0.03).
Particularly, the DINO-v2 variant exhibits the least fa-
vorable results among the three versions. This high-
lights the efficacy of incorporating CLIP-based fea-
tures, showcasing its superiority in capturing and rep-
resenting essential information for the image com-
plexity. Second, the version of our method based
on CLIP features demonstrates results that closely
align with those achieved by the ICNet model, namely
0.9449 vs. 0.8845 in terms of SROCC. Remarkably,
ICNet is explicitly designed and trained to handle IC.
This convergence in performance underscores the ca-
pability of our CLIP-based approach to effectively
handle intricate image characteristics, approaching
the proficiency of a model explicitly tailored for the
complexity aspect. Third, ViT-L marginally outper-
forms CLIP in terms of correlation metrics; however,
it exhibits lower values for both RMSE and RMAE.
This suggests that while ViT-L may capture stronger
correlations in certain aspects, it falls short in mini-
mizing the overall error metrics compared to CLIP-
based method.
Inter-Dataset Results. To verify the robustness and
generalization capabilities of our proposed methods,
we also provide the results on the SAVOIAS dataset.
The ground-truth scores in the SAVOIAS dataset are
separately annotated in terms of rank for each of
the seven categories. Thus, we exploit the methods
trained on the IC9600 training set, test them on the
SAVOIAS, and report the mean results of seven cat-
egories. Table 2 presents the results by our methods
and the two state-of-the-art methods with the best re-
sults on the IC9600, namely UAE and ICNet. We ob-
serve that the proposed methods, while demonstrat-
ing competitive performance on IC9600, exhibit a
larger performance gap when compared to ICNet on
the SAVOIAS dataset. ViT-L also performs signifi-
cantly lower than ICNet, although slightly better than
the CLIP-based solution (+0.01 in terms of correla-
tion). This discrepancy underscores the specific chal-
lenges posed by the SAVOIAS dataset and highlights
the need for further investigation of these methods to
effectively address the complexities of this specific
dataset.
On the Use of Visual Transformer for Image Complexity Assessment
645

7 CONCLUSIONS
This paper explores the potential of ViT features
for IC estimation. ViT has exhibited superior per-
formance in various computer vision tasks. The
study proposes utilizing features from pre-trained ViT
models combined with SVR using a RBF kernel.
These features aim to offer a nuanced understand-
ing of visual complexity, surpassing existing methods.
Three visual backbones, CLIP, DINO-v2, and Ima-
geNetViT, operate as feature extractors for IC. Test-
ing the hypothesis on benchmark datasets IC9600 and
SAVOIAS demonstrates the effectiveness of CLIP-
based features with SVR for accurate IC estimation.
As future work, we will consider intermediate rep-
resentations of ViT to assess whether they are more
suitable for complexity estimation since they are more
transferable and less domain- or task-specific.
ACKNOWLEDGEMENTS
This work was partially supported by the MUR under
the grant “Dipartimenti di Eccellenza 2023-2027” of
the Department of Informatics, Systems and Commu-
nication of the University of Milano-Bicocca, Italy.
REFERENCES
Abdelwahab, M. A., Iliyasu, A. M., and Salama, A. S.
(2019). Leveraging the potency of cnn for efficient as-
sessment of visual complexity of images. In Interna-
tional Conference on Image Processing Theory, Tools
and Applications, pages 1–8. IEEE.
Akc¸a, E. and Tanrı
¨
over,
¨
O.
¨
O. (2022). A deep trans-
fer learning based visual complexity evaluation ap-
proach to mobile user interfaces. Traitement du Sig-
nal, 39(5):1545–1556.
Amirshahi, S. A., Hayn-Leichsenring, G. U., Denzler,
J., and Redies, C. (2015). Jenaesthetics subjective
dataset: analyzing paintings by subjective scores. In
European Conference on Computer Vision, pages 3–
19. Springer.
Borkin, M. A., Vo, A. A., Bylinskii, Z., Isola, P., Sunkavalli,
S., Oliva, A., and Pfister, H. (2013). What makes a vi-
sualization memorable? IEEE Transactions on Visu-
alization and Computer Graphics, 19(12):2306–2315.
Cardaci, M., Di Ges
`
u, V., Petrou, M., and Tabacchi, M. E.
(2009). A fuzzy approach to the evaluation of image
complexity. Fuzzy Sets and Systems, 160(10):1474–
1484.
Caron, M., Touvron, H., Misra, I., J
´
egou, H., Mairal, J., Bo-
janowski, P., and Joulin, A. (2021). Emerging proper-
ties in self-supervised vision transformers. In Interna-
tional Conference on Computer Vision, pages 9650–
9660. IEEE/CVF.
Chen, Y.-Q., Duan, J., Zhu, Y., Qian, X.-F., and Xiao, B.
(2015). Research on the image complexity based on
neural network. In International Conference on Ma-
chine Learning and Cybernetics (ICMLC), volume 1,
pages 295–300. IEEE.
Corchs, S. E., Ciocca, G., Bricolo, E., and Gasparini,
F. (2016). Predicting complexity perception of real
world images. PloS one, 11(6):e0157986.
Da Silva, M. P., Courboulay, V., and Estraillier, P. (2011).
Image complexity measure based on visual attention.
In International Conference on Image Processing,
pages 3281–3284. IEEE.
Donderi, D. C. (2006). Visual complexity: a review. Psy-
chological bulletin, 132(1):73.
Dosovitskiy, A., Beyer, L., Kolesnikov, A., Weissenborn,
D., Zhai, X., Unterthiner, T., Dehghani, M., Minderer,
M., Heigold, G., Gelly, S., Uszkoreit, J., and Houlsby,
N. (2021). An image is worth 16x16 words: Trans-
formers for image recognition at scale. In 9th Interna-
tional Conference on Learning Representations, ICLR
2021, Virtual Event, Austria, May 3-7, 2021. OpenRe-
view.net.
Durmus, D. (2020). Spatial frequency and the performance
of image-based visual complexity metrics. IEEE Ac-
cess, 8:100111–100119.
Feng, T., Zhai, Y., Yang, J., Liang, J., Fan, D.-P., Zhang, J.,
Shao, L., and Tao, D. (2023). IC9600: A benchmark
dataset for automatic image complexity assessment.
IEEE Transactions on Pattern Analysis and Machine
Intelligence, 45(7):8577–8593.
Fernandez-Lozano, C., Carballal, A., Machado, P., Santos,
A., and Romero, J. (2019). Visual complexity mod-
elling based on image features fusion of multiple ker-
nels. PeerJ, 7:e7075.
Forsythe, A. (2009). Visual complexity: is that all there
is? In International Conference on Engineering Psy-
chology and Cognitive Ergonomics, pages 158–166.
Springer.
Gauvrit, N., Soler-Toscano, F., and Zenil, H. (2014). Nat-
ural scene statistics mediate the perception of image
complexity. Visual Cognition, 22(8):1084–1091.
Guo, X., Qian, Y., Li, L., and Asano, A. (2018). Assessment
model for perceived visual complexity of painting im-
ages. Knowledge-Based Systems, 159:110–119.
Han, K., Wang, Y., Chen, H., Chen, X., Guo, J., Liu, Z.,
Tang, Y., Xiao, A., Xu, C., Xu, Y., et al. (2022). A
survey on vision transformer. IEEE Transactions on
Pattern Analysis and Machine Intelligence, 45(1):87–
110.
Heaps, C. and Handel, S. (1999). Similarity and features of
natural textures. Journal of Experimental Psychology:
Human Perception and Performance, 25(2):299.
Hussain, Z., Zhang, M., Zhang, X., Ye, K., Thomas, C.,
Agha, Z., Ong, N., and Kovashka, A. (2017). Au-
tomatic understanding of image and video advertise-
ments. In Conference on Computer Vision and Pattern
Recognition, pages 1705–1715. IEEE.
Khan, S., Naseer, M., Hayat, M., Zamir, S. W., Khan, F. S.,
and Shah, M. (2022). Transformers in vision: A sur-
vey. ACM computing surveys (CSUR), 54(10s):1–41.
VISAPP 2024 - 19th International Conference on Computer Vision Theory and Applications
646

Lin, T.-Y., Maire, M., Belongie, S., Hays, J., Perona, P.,
Ramanan, D., Doll
´
ar, P., and Zitnick, C. L. (2014).
Microsoft coco: Common objects in context. In Euro-
pean Conference on Computer Vision, pages 740–755.
Springer.
Liu, M., Gu, K., Zhai, G., and Le Callet, P. (2016). Visual
saliency detection via image complexity feature. In
International Conference on Image Processing, pages
2777–2781. IEEE.
Liu, Z., Lin, Y., Cao, Y., Hu, H., Wei, Y., Zhang, Z., Lin,
S., and Guo, B. (2021). Swin transformer: Hierar-
chical vision transformer using shifted windows. In
International Conference on Computer Vision, pages
10012–10022. IEEE/CVF.
Machado, P., Romero, J., Nadal, M., Santos, A., Correia, J.,
and Carballal, A. (2015). Computerized measures of
visual complexity. Acta psychologica, 160:43–57.
Mirjalili, F. and Hardeberg, J. Y. (2022). On the quantifica-
tion of visual texture complexity. Journal of Imaging,
8(9):248.
Murray, N., Marchesotti, L., and Perronnin, F. (2012). Ava:
A large-scale database for aesthetic visual analysis. In
Conference on Computer Vision and Pattern Recogni-
tion, pages 2408–2415. IEEE.
Nagle, F. and Lavie, N. (2020). Predicting human com-
plexity perception of real-world scenes. Royal Society
open science, 7(5):191487.
Olivia, A., Mack, M. L., Shrestha, M., and Peeper, A.
(2004). Identifying the perceptual dimensions of vi-
sual complexity of scenes. In Annual Meeting of the
Cognitive Science Society, volume 26.
Oquab, M., Darcet, T., Moutakanni, T., Vo, H., Szafraniec,
M., Khalidov, V., Fernandez, P., Haziza, D., Massa, F.,
El-Nouby, A., et al. (2023). Dinov2: Learning robust
visual features without supervision. arXiv preprint
arXiv:2304.07193.
Paszke, A., Gross, S., Massa, F., Lerer, A., Bradbury, J.,
Chanan, G., Killeen, T., Lin, Z., Gimelshein, N.,
Antiga, L., Desmaison, A., Kopf, A., Yang, E., De-
Vito, Z., Raison, M., Tejani, A., Chilamkurthy, S.,
Steiner, B., Fang, L., Bai, J., and Chintala, S. (2019).
Pytorch: An imperative style, high-performance deep
learning library. In Advances in Neural Information
Processing Systems 32, pages 8024–8035. Curran As-
sociates, Inc.
Purchase, H. C., Freeman, E., and Hamer, J. (2012). Pre-
dicting visual complexity. In International Confer-
ence on Appearance, pages 62–65.
Radford, A., Kim, J. W., Hallacy, C., Ramesh, A., Goh, G.,
Agarwal, S., Sastry, G., Askell, A., Mishkin, P., Clark,
J., et al. (2021). Learning transferable visual models
from natural language supervision. In International
Conference on Machine Learning, pages 8748–8763.
PMLR.
Rao, A. R. and Lohse, G. L. (1993). Identifying high level
features of texture perception. CVGIP: Graphical
Models and Image Processing, 55(3):218–233.
Rosenholtz, R., Li, Y., Mansfield, J., and Jin, Z. (2005).
Feature congestion: a measure of display clutter. In
Conference on Human Factors in Computing Systems,
pages 761–770.
Rosenholtz, R., Li, Y., and Nakano, L. (2007). Measuring
visual clutter. Journal of vision, 7(2):17–17.
Saraee, E., Jalal, M., and Betke, M. (2020). Visual complex-
ity analysis using deep intermediate-layer features.
Elsevier Computer Vision and Image Understanding,
195:102949.
Sharif Razavian, A., Azizpour, H., Sullivan, J., and Carls-
son, S. (2014). Cnn features off-the-shelf: an as-
tounding baseline for recognition. In Conference on
Computer Vision and Pattern Recognition Workshops,
pages 806–813. IEEE.
Snodgrass, J. G. and Vanderwart, M. (1980). A standard-
ized set of 260 pictures: norms for name agreement,
image agreement, familiarity, and visual complexity.
Journal of experimental psychology: Human learning
and memory, 6(2):174.
Westlake, N., Cai, H., and Hall, P. (2016). Detecting people
in artwork with cnns. In Computer Vision, pages 825–
841. Springer.
Xiao, B., Duan, J., Liu, X., Zhu, Y., and Wang, H. (2018).
Evaluation of image complexity based on svor. Inter-
national Journal of Pattern Recognition and Artificial
Intelligence, 32(07):1854020.
Yu, F., Xian, W., Chen, Y., Liu, F., Liao, M., Madhavan, V.,
Darrell, T., et al. (2020). Bdd100k: A diverse driving
video database with scalable annotation tooling. In
Conference on Computer Vision and Pattern Recogni-
tion, pages 2636–2645. IEEE.
Yu, H. and Winkler, S. (2013). Image complexity and spa-
tial information. In International Workshop on Qual-
ity of Multimedia Experience (QoMEX), pages 12–17.
IEEE.
Zhang, S., Xie, Y., Wan, J., Xia, H., Li, S. Z., and Guo,
G. (2019). Widerperson: A diverse dataset for dense
pedestrian detection in the wild. IEEE Transactions
on Multimedia, 22(2):380–393.
Zhou, B., Lapedriza, A., Khosla, A., Oliva, A., and Tor-
ralba, A. (2017). Places: A 10 million image database
for scene recognition. IEEE Transactions on Pattern
Analysis and Machine Intelligence, 40(6):1452–1464.
On the Use of Visual Transformer for Image Complexity Assessment
647
