
Depth-Enhanced 3D Deep Learning for Strawberry Detection and
Widest Region Identification in Polytunnels
Gabriel Lins Tenorio
1,2 a
, Weria Khaksar
2 b
and Wouter Caarls
1 c
1
Electrical Engineering Department, Pontifical Catholic University of Rio de Janeiro - PUC-Rio, Rio de Janeiro, Brazil
2
Faculty of Science and Technology, Norwegian University of Life Sciences (NMBU),
˚
As, Norway
Keywords:
3D Instance Segmentation, Strawberry Detection, Precision Agriculture.
Abstract:
This paper presents an investigation into the use of 3D Deep Learning models for enhanced strawberry detec-
tion in polytunnels. We focus on two main tasks: firstly, fruit detection, comparing the standard MaskRCNN
and an adapted version that integrates depth information (MaskRCNN-D), both capable of classifying straw-
berries based on their maturity (ripe, unripe) and health status (affected by disease or fungus); secondly, for the
identification of the widest region of strawberries, we compare a contour-based algorithm with an enhanced
version of the VGG-16 model. Our findings demonstrate that integrating depth data into the MaskRCNN-D
results in up to a 13.7% improvement in mean Average Precision (mAP) from 0.81 to 0.92 across various
strawberry test sets, including simulated ones, emphasizing the model’s effectiveness in both real-world and
simulated agricultural scenarios. Furthermore, our end-to-end pipeline approach, which combines the fruit
detection (MaskRCNN-D) and widest region identification models (enhanced VGG-16), shows a remarkably
low localization error, achieving down to 11.3 pixels of Root Mean Square Error (RMSE) in a 224 ×224
strawberry cropped image. This pipeline integration, combining the strengths of both models, provides the
most effective result, enabling their application in autonomous fruit monitoring systems.
1 INTRODUCTION
The importance of inspecting strawberries for signs
of adequate ripening, nutrient absorption, and the ab-
sence of diseases is vital for ensuring their overall
quality. As research continues to evolve, the direct as-
sessment of strawberry quality in outdoor as well as
indoor fields has become a significant area of research
(Ilyas et al., 2021; Lee et al., 2022). The adoption of
autonomous inspection systems (Ren et al., 2023) can
offer valuable agricultural information to farmers and
drastically reduce the manual labor involved in moni-
toring strawberries.
In the literature, there are numerous studies em-
ploying simple cameras integrated with advanced
Deep Learning algorithms for agricultural tasks.
These include estimating tomato clusters maturation
(Lins Tenorio and Caarls, 2021), detecting diseases
and pests in strawberries (Lee et al., 2022), and as-
sessing the quality of various fruits (Harini et al.,
a
https://orcid.org/0000-0002-8256-4461
b
https://orcid.org/0000-0002-6400-3150
c
https://orcid.org/0000-0001-9069-2378
2021), all of which have shown promising results.
On the other hand, there are advancements and inno-
vations directly in sensor technology, as exemplified
by a novel NIR Interaction Spectroscopy prototype,
which is capable of estimating the dry matter con-
tent in potatoes without physical contact (Wold et al.,
2021). Such sensors can potentially be redesigned
and recalibrated for use with other fruits, for instance,
in measuring sugar content in strawberries.
Beyond quality sensing, there is a growing inter-
est in automatically locating fruits in the field. One
example is the work by (Lins Tenorio and Caarls,
2021), which developed a system for automatic de-
tection, tracking, and counting of tomato clusters us-
ing object detection techniques in continuous scenes
of plant rows. Another example relates to straw-
berry detection for automated harvesting, as demon-
strated by (Ge et al., 2019), who employed an instance
segmentation algorithm to locate as well as classify
ripe and unripe strawberries. Furthering this field,
(Le Lou
¨
edec and Cielniak, 2021) proposed a 3D se-
mantic segmentation model to locate strawberries in
polytunnels.
Regarding the use of spectrometers, there is a re-
Lins Tenorio, G., Khaksar, W. and Caarls, W.
Depth-Enhanced 3D Deep Learning for Strawberry Detection and Widest Region Identification in Polytunnels.
DOI: 10.5220/0012425200003636
Paper published under CC license (CC BY-NC-ND 4.0)
In Proceedings of the 16th International Conference on Agents and Artificial Intelligence (ICAART 2024) - Volume 2, pages 471-481
ISBN: 978-989-758-680-4; ISSN: 2184-433X
Proceedings Copyright © 2024 by SCITEPRESS – Science and Technology Publications, Lda.
471

quirement for an ideal sensor position for accurate
readings, preferably on the area of the strawberry with
the largest horizontal surface. Therefore, a system ca-
pable of precisely locating this region is essential
The present work introduces a vision system,
based on Deep Learning algorithms, tailored for ac-
curately positioning a NIR Spectrometer in a future
system for the non-invasive sugar content estimation
of strawberries in polytunnels. Our vision system is
based on two primary components: fruit and widest
region detectors. The fruit detector is responsible
for locating strawberries in instances and classifying
them into ripe, unripe, and affected by disease or fun-
gus categories. Once the strawberries are identified by
the fruit detector, the vision system smoothly transi-
tions to the widest region detector, aiming to pinpoint
the widest part of the strawberry, which is a crucial
requirement for precise quality assessment. Straw-
berry scenes in polytunnel environments are naturally
complex, influenced by variations in lighting, occlu-
sion, and the diversity of the strawberries. This com-
plexity necessitates the application of an advanced
technique such as Deep Learning, which offers so-
phisticated pattern recognition capabilities essential
for adapting to the complexity of agricultural scenes.
This approach significantly outperforms simpler com-
puter vision methods. Our vision system undergoes
training and validation using real-world data, ensur-
ing it is well-prepared for practical applications. Sub-
sequently, its performance is also validated in simula-
tions to encompass a diverse range of scenarios.
The following section provides background infor-
mation and preliminary discussions. Section 3 delves
into the methods used in our research. Section 4
provides details on our experiments, while Section 5
evaluates the results. Lastly, Section 6 wraps up the
study with conclusions and provides a foundation for
future work.
2 BACKGROUND
The field of image analysis has advanced significantly
in the past decade. Traditional methods largely relied
on computer vision techniques, often requiring hand-
crafted features and time-consuming manual adjust-
ments tailored to specific datasets (Belhumeur et al.,
1997; Viola and Jones, 2001; Lowe, 2004; Dalal and
Triggs, 2005). With the advances in Graphics Pro-
cessing Units (GPUs) (Nickolls and Kirk, 2009) and
the emergence of Deep Learning, particularly Convo-
lutional Neural Networks (CNNs) (Gu et al., 2018;
Krizhevsky et al., 2012), the scenario has been essen-
tially transformed.
CNNs are able to automate the feature extraction
process, learning spatial structures directly from im-
age pixels. The process involves the use of convolu-
tion, an algebraic operation that is applied in parallel
across the image using multiple kernels. These ker-
nels are essentially trainable filters that adapt during
the learning process to become specialized in extract-
ing different types of image features. The architec-
ture of these networks typically comprises a series of
convolutional layers, designed to recognize patterns
at varying levels of complexity, and pooling layers,
which reduce data dimensions while retaining domi-
nant features. The convolutional layers with their ker-
nels, through the training process, enable the network
to progress from recognizing generic patterns like
edges to identifying more complex, dataset-specific
attributes, also known as features.
Additionally, CNNs are frequently used in su-
pervised learning tasks, where images as inputs are
matched with various types of labels, such as binary
values, continuous values (which could be scalar or
vector), bounding box coordinates, masks or a com-
bination of these. During the training phase, these
input/label pairs are used by Deep Learning models
to effectively accomplish the specified tasks as Im-
age Classification, Image Regression, Semantic and
Instance Segmentations which will be explored in the
following subsections.
2.1 Image Classification and Regression
In Image Classification, the objective is to deter-
mine the probabilities that an image belongs to cer-
tain established categories, such as the classification
of strawberries. Models such as VGGNet (Simonyan
and Zisserman, 2014), AlexNet (Krizhevsky et al.,
2012), ResNet (He et al., 2016), and EfficientNet (Tan
and Le, 2019) have demonstrated remarkable success
in such classification tasks. On the other hand, regres-
sion tasks require modifications to the output layer of
the network aiming for the model to predict and inter-
polate one or more continuous values associated with
an image. An example of this is determining the co-
ordinates of the widest regions of the strawberries.
2.2 Semantic and Instance
Segmentations
Semantic segmentation is a technique that divides an
image into regions that are semantically comparable,
classifying each pixel of the image according to its
respective class. For instance, in agricultural appli-
cations, this method can be used to categorize pix-
els related to different strawberry classes. Architec-
ICAART 2024 - 16th International Conference on Agents and Artificial Intelligence
472
tures such as FCN (Long et al., 2015), U-Net (Ron-
neberger et al., 2015) and SegNet (Badrinarayanan
et al., 2017) exemplify the implementation of this
technique. Expanding upon this idea, a paper by
(Le Lou
¨
edec and Cielniak, 2021) introduced a novel
Semantic Segmentation architeture to achieve effec-
tive 3D segmentation of strawberries in both agricul-
tural and simulated polytunnels using RGB-D data
(combining color and depth information). However,
while effective, semantic segmentation alone may en-
counter limitations, particularly in the precise 3D lo-
calization of individual objects, as needed in tasks like
automated harvesting.
To address these limitations, Instance Segmenta-
tion advances the concepts of Semantic Segmentation
by not only classifying each pixel of an image but
also distinguishing between different instances of the
same class. For instance, in the classification of straw-
berries, it differentiates individual strawberries from
one another, assigning a unique identifier to each one.
While MaskRCNN (He et al., 2017) remains notable
in this area for its segmentation quality, other models
like YOLACT (Bolya et al., 2019) offer efficient real-
time instance segmentation and recent advancements
in the YOLO family (Reis et al., 2023) finds the bal-
ance between segmentation quality and speed. Illus-
trating the practical application of these concepts, (Ge
et al., 2019) successfully employed MaskR-CNN for
precisely identifying and locating each strawberry as
well as classifying their ripeness in polytunnels. This
was essential for enabling their robotic system to ef-
ficiently and safely pick the ripe strawberries while
avoiding unripe ones.
3 METHOD
This section describes the methodology adopted in
this research, beginning with the acquisition and la-
beling of the strawberries datasets. Following this,
we describe the fruit instance segmentation models,
discussing the nuances of both a baseline model and
an enhanced model. We then detail our approach to
identifying the widest region of the fruit, comparing a
contour detection technique with a trained model.
3.1 Datasets Acquisition
The datasets used in this research are summarized in
the table 1. Further details for each dataset are dis-
cussed in the next subsections.
3.1.1 Fruit Instance Segmentation Datasets
The datasets for fruit instance segmentation are com-
posed of multiple scenes within polytunnels, captured
using stereo cameras, where each scene contains mul-
tiple strawberries. Because the fruit detection mod-
els that we are using focus on instance segmentation,
each strawberry instance was labeled with a unique
identifier to distinguish individual objects within the
same category. This process, known as instance la-
beling, requires marking the pixel-level region inside
each fruit with a distinct mask. Thus, each strawberry
within an image is treated as a separate instance, al-
lowing the models to identify each instance indepen-
dently. In addition to the instance labeling, the fruit
detection models also necessitate assigning a class to
each instance. In this work, that means that every
strawberry, while being identified as a separate entity
with its unique identifier, also needs to be categorized
under one of three classes: Ripe, Unripe or Affected.
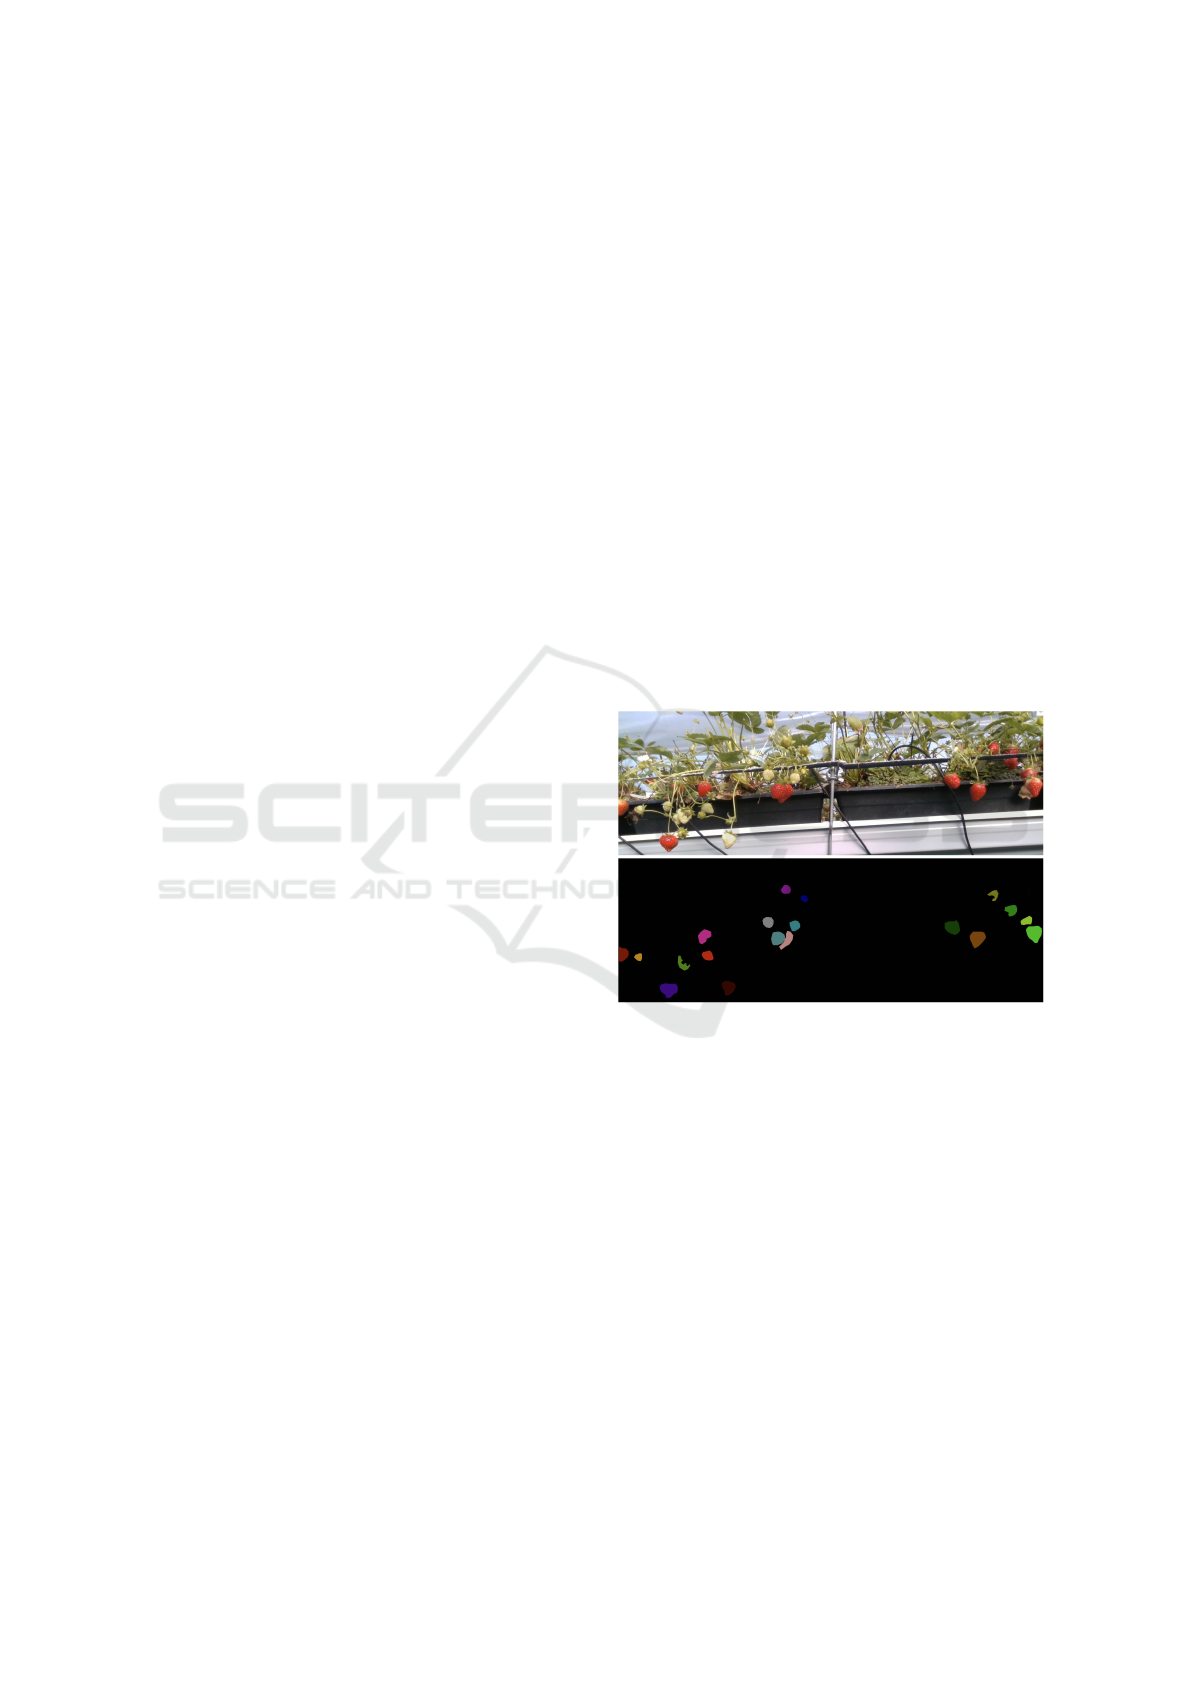
Figure 1 shows an example of a scene and its corre-
sponding instance label from the Dataset.
Figure 1: Example of Instance Segmentation for Straw-
berry Detection. Top image: Captured scene in the poly-
tunnel featuring multiple strawberry instances. Bottom
image: Corresponding instance segmentation label, where
each color represents a unique instance of a detected straw-
berry. The class information for each instance is stored sep-
arately in an associated metadata file, not visually repre-
sented in this image.
For training, validation, and testing purposes, the
dataset employed was obtained from polytunnels in
Norway in 2019 (NO2019 Dataset). We labeled the
dataset to include only the categories of ripe, unripe,
and those affected by fungous or other diseases. To
more effectively evaluate the results that will be pre-
sented in the results section, we have also used a
dataset from the United Kingdom (UK Dataset) as re-
ported in (Le Lou
¨
edec and Cielniak, 2021). Addi-
tionally, we self-collected a dataset from Norway in
2023 (NO2023 Dataset) and created another dataset
Depth-Enhanced 3D Deep Learning for Strawberry Detection and Widest Region Identification in Polytunnels
473
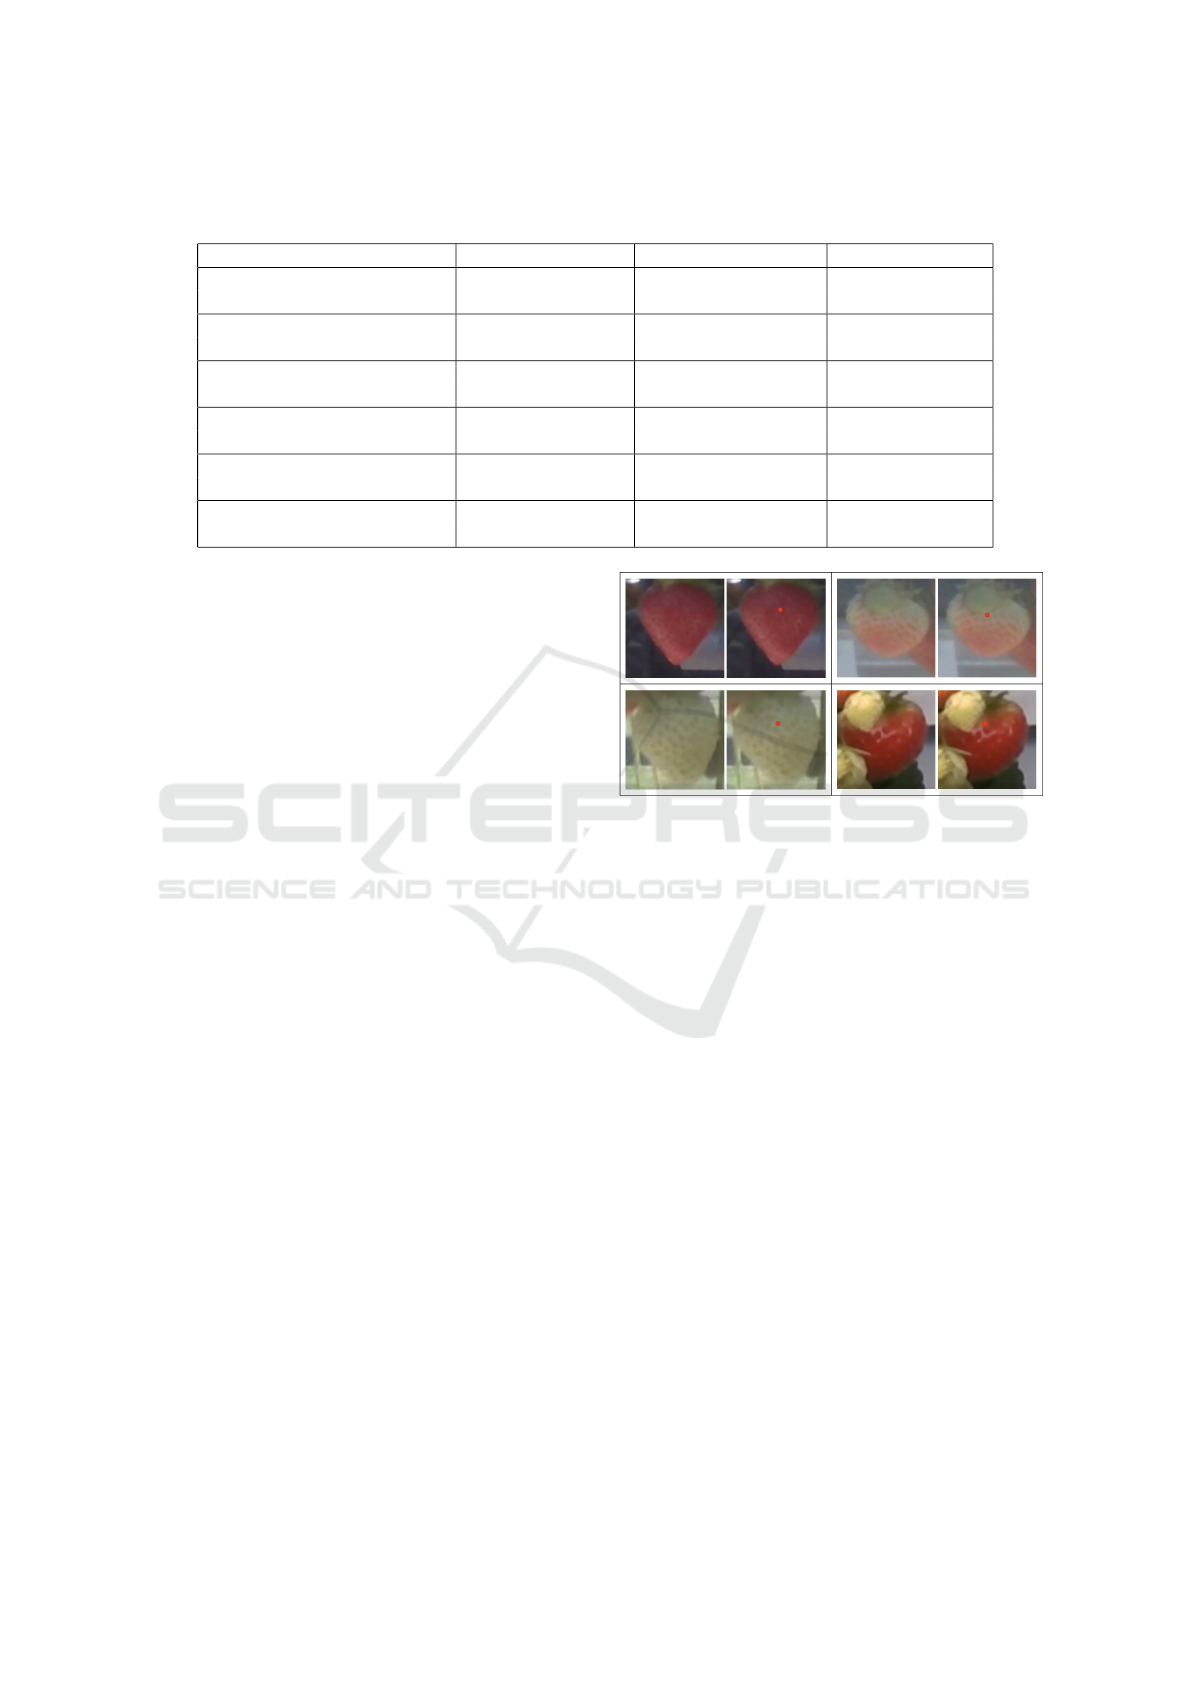
Table 1: Overview of datasets used. Datasets marked with (*) were split into training, validation, and testing sets with
proportions of 80%, 10%, and 10% respectively. For the remaining datasets, all data was used for testing purposes.
Dataset # Training Images # Validation Images # Testing Images
Fruit Instance Segmentation* 1445 181 180
(NO2019)
Widest Region Detection* 5484 685 685
(NO2019)
Fruit Instance Segmentation - - 45
(UK/NO2023)
Widest Region Detection - - 315
(UK/NO2023)
Fruit Instance Segmentation - - 30
(Simulated)
Widest Region Detection - - 274
(Simulated)
from a simulated strawberry polytunnel environment
(this last one is explained in detail in Section 3.1.3).
The labeling process for these datasets was conducted
manually, using an annotation tool (Russell et al.,
2008).
3.1.2 Widest Region Detection Datasets
Utilizing the instance segmentation datasets, we pro-
cessed the data to obtain individual strawberry im-
ages. This derived dataset specifically targets the de-
tection of the widest horizontal region of each fruit.
The ’widest region’ is defined as the area on a straw-
berry that has the largest horizontal span when viewed
from the camera’s perspective, essentially the part of
the fruit that extends the most from one side to the
other. In this context, the X-coordinate is determined
by the central point along the horizontal axis of this
widest region, and the Y-coordinate corresponds to
the vertical position of this midpoint on the straw-
berry. For each strawberry image, the dataset de-
fines the output as a two-dimensional vector, indicat-
ing these pixel coordinates of the widest region.
In order to conduct the labeling process, we de-
veloped a custom tool that labels the location of the
widest region for each fruit. The user interface of the
tool displays a single strawberry image and allows the
labeler to choose the widest horizontal span with a
simple click. This action then generates a label con-
sisting of a pair of values, corresponding to the X and
Y coordinates of that instance, ready for use in train-
ing. We selected only a subset of each dataset for la-
beling, due to the high volume of strawberries present
in the scenes. Examples of these labelings are illus-
trated in Figure 2.
Figure 2: Four illustrative examples from the widest region
detection dataset. The images are labeled with the X and Y
pixel coordinates of the widest region, indicated by the red
dots in the images.
3.1.3 Simulated Test Set
In order to create a simulated test set, we applied
a randomized strawberry plant generator (Sather,
2019). This tool allowed us to specify various pa-
rameters such as the number of leaves, stages of mat-
uration and shapes for the strawberries, and the sizes
and quantities of strawberries per plant. Additionally,
we adapted the generator to produce virtual strawber-
ries at varying heights, thereby introducing additional
complexity into the test set to better mimic real-world
conditions. The generation process resulted in a total
of 30 scenes encompassing a diverse array of straw-
berry plants, with a cumulative count of 274 straw-
berries. For annotating this simulated dataset, we
employed the same instance segmentation annotation
tool referenced in (Russell et al., 2008), as well as
our labeling tool for determining the widest region of
each strawberry, as previously described. It is impor-
tant to highlight that the simulated dataset is limited to
only two classes: ’Ripe’ and ’Unripe’. Below, Fig. 3
provides an example of a comparison between a real
scene and a simulated scene.
ICAART 2024 - 16th International Conference on Agents and Artificial Intelligence
474
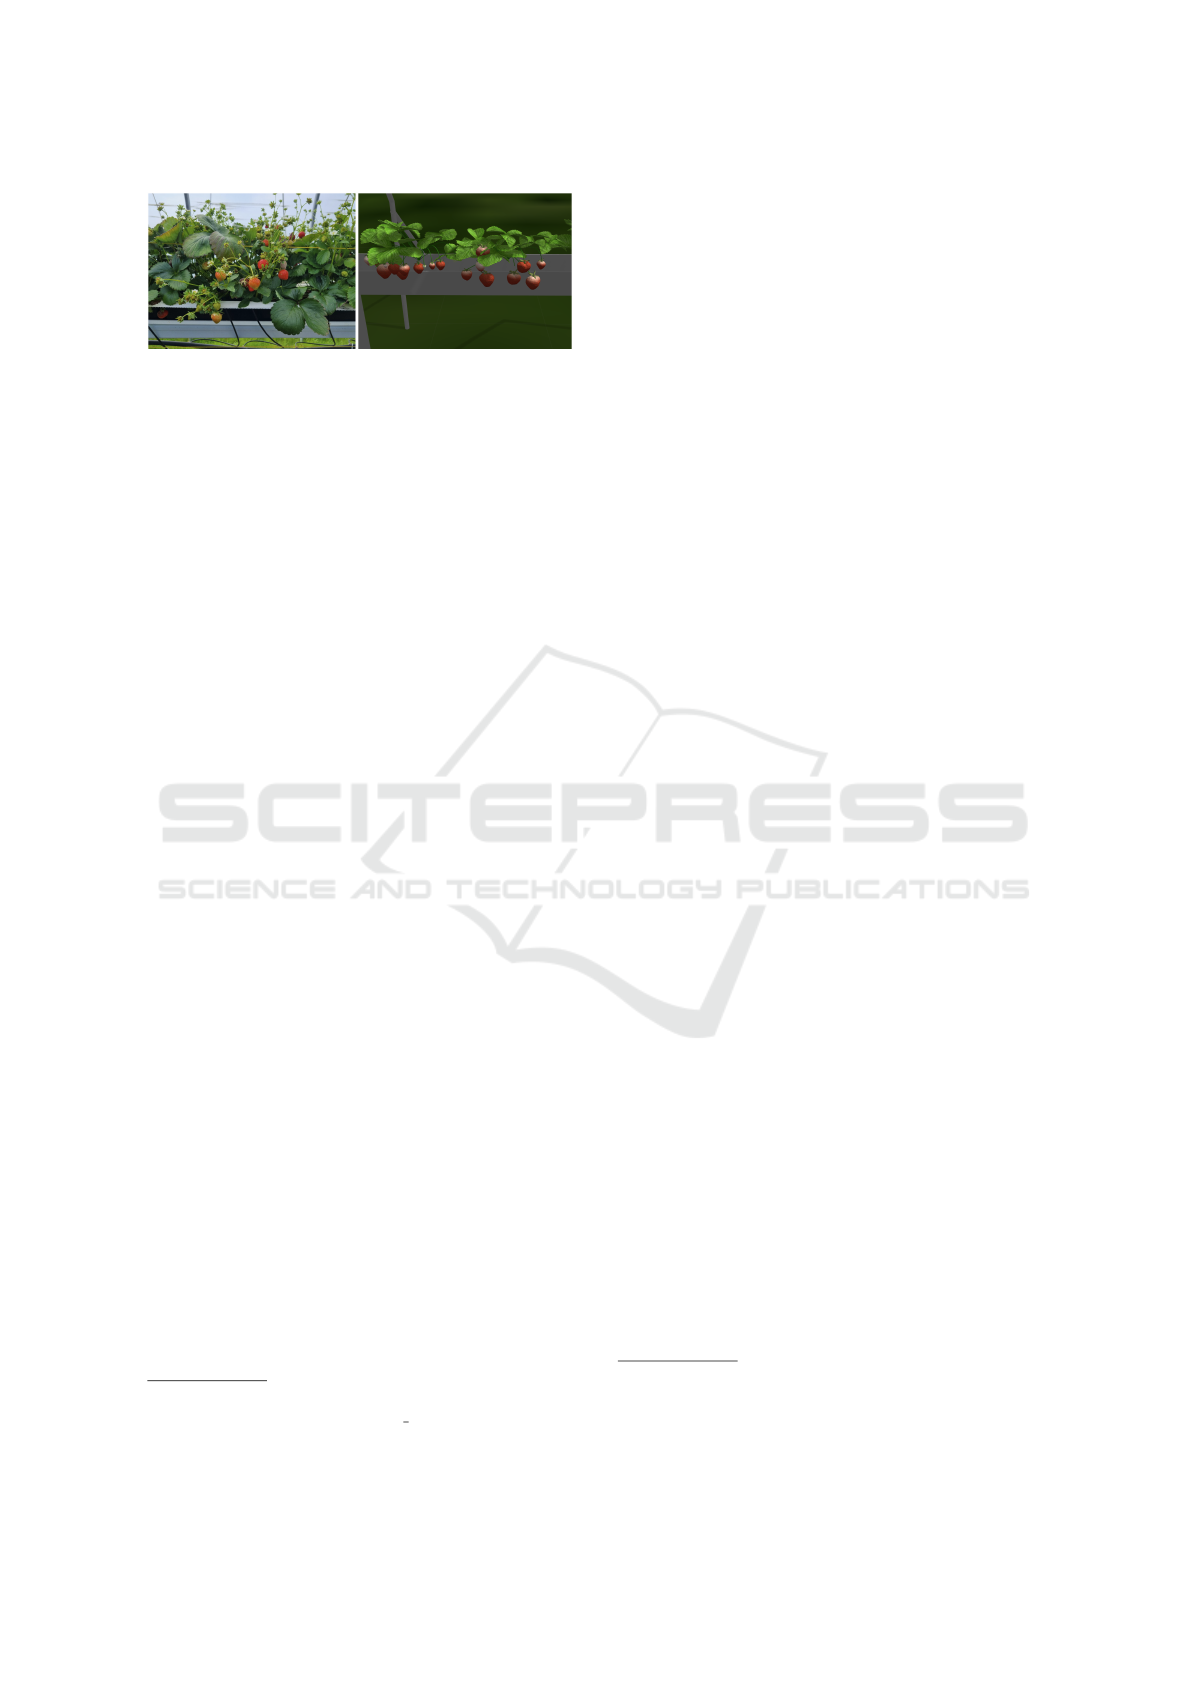
Figure 3: Comparison between a real scene (left) and a sim-
ulated scene (right).
3.2 Fruit Instance Segmentation Models
This subsection examines the Deep Learning segmen-
tation techniques for fruit instance detection adopted
in this paper. The discussion begins with the base-
line method, MaskRCNN, a widely used model for
the identification and classification of fruits in com-
plex agricultural environments. This model, as well
as the subsequent enhanced approach, relies on the
labels described in an earlier section (3.1.1) for their
training process. The enhanced approach builds upon
the capabilities of the baseline MaskRCNN model,
aiming to achieve more accurate segmentation perfor-
mance specifically tailored to the unique challenges
encountered in fruit instance detection.
3.2.1 Baseline: MaskRCNN
The baseline model for the instance segmentation task
is MaskRCNN, responsible for taking an RGB image
as input and identifying the location and classification
of each strawberry in the image. This model serves as
the basis upon which we compare the performance of
an enhanced segmentation approach.
3.2.2 Improved: MaskRCNN-D
The enhanced version of MaskRCNN, denoted as
MaskRCNN-D, integrates depth information into the
original architecture. Modifications were necessary
to accommodate the additional depth channel, which
were implemented following recommendations from
the original GitHub wiki for MaskRCNN
1
. Figure 4
illustrates this integration of depth information into
the MaskRCNN model.
The inclusion of depth information addresses a
significant challenge in fruit instance segmentation:
the high incidence of occlusion among the fruits.
When fruits are clustered together, traditional RGB
data may not provide enough differentiation for the
algorithm to accurately segment each instance. Depth
data introduces a new dimension of information that
1
MaskRCNN Wiki, 2018. Available:
https://github.com/matterport/Mask RCNN/wik [Accessed
November 5, 2023]
significantly aids in distinguishing fruits that are in
close proximity, particularly in terms of depth. This
adjustment was inspired by the unpublished research
of (Orestis, 2018)
2
, who demonstrated up to 31% AP
(Average Precision) increase in performance on var-
ious Datasets when incorporating depth data into the
model.
3.3 Fruit Widest Region Detector
This section introduces two approaches for detecting
the widest region of a strawberry, the primary objec-
tive of which is to accurately pinpoint the X and Y
coordinates of this region. The first approach is the
ContourMax method, a direct and learning-free ap-
proach that operates without the need for pre-labeled
data. The second is a Deep Learning alternative, re-
quiring labels as mentioned earlier in (sec. 3.1.2) for
its training.
3.3.1 Baseline: ContourMax
Our algorithm, referred to as ContourMax, processes
an input known as contour, which is derived from in-
stance segmentation or instance labeling that delin-
eates the outline of an object. It is designed to pin-
point the widest horizontal segment of a strawberry
by looping through each unique y-coordinate of the
contour data. For each y-level, it determines the hor-
izontal span by locating the extreme x-coordinates
that lie on this horizontal line. The process involves
comparing each width to find the maximum, updating
this value along with the corresponding y-coordinate
when a wider segment is identified. The algorithm
concludes by returning the y-coordinate of the maxi-
mal width and the x-coordinates of the boundaries of
this segment. An illustration of this algorithm in dis-
cerning the widest region of a strawberry by its con-
tour is shown in Figure 5.
3.3.2 Improved: VGG-WSCNN
To improve the accuracy in identifying the widest re-
gion of the strawberries, we employed an enhanced
version of the VGG-16 architecture by incorpo-
rating Weight Standardization Convolutions (WSC-
NNs). These modifications have been applied to
the non-residual model structure of VGG-16, and
according to the authors, such advancements offer
greater stability during training, a reduced tendency
2
Orestis, 2018, ”Does Depth Matter? RGB-D Instance
Segmentation with MaskRCNN”, unpublished manuscript,
available at: https://github.com/orestis-z/mask-rcnn-rgbd.
Accessed on: November 5, 2023
Depth-Enhanced 3D Deep Learning for Strawberry Detection and Widest Region Identification in Polytunnels
475
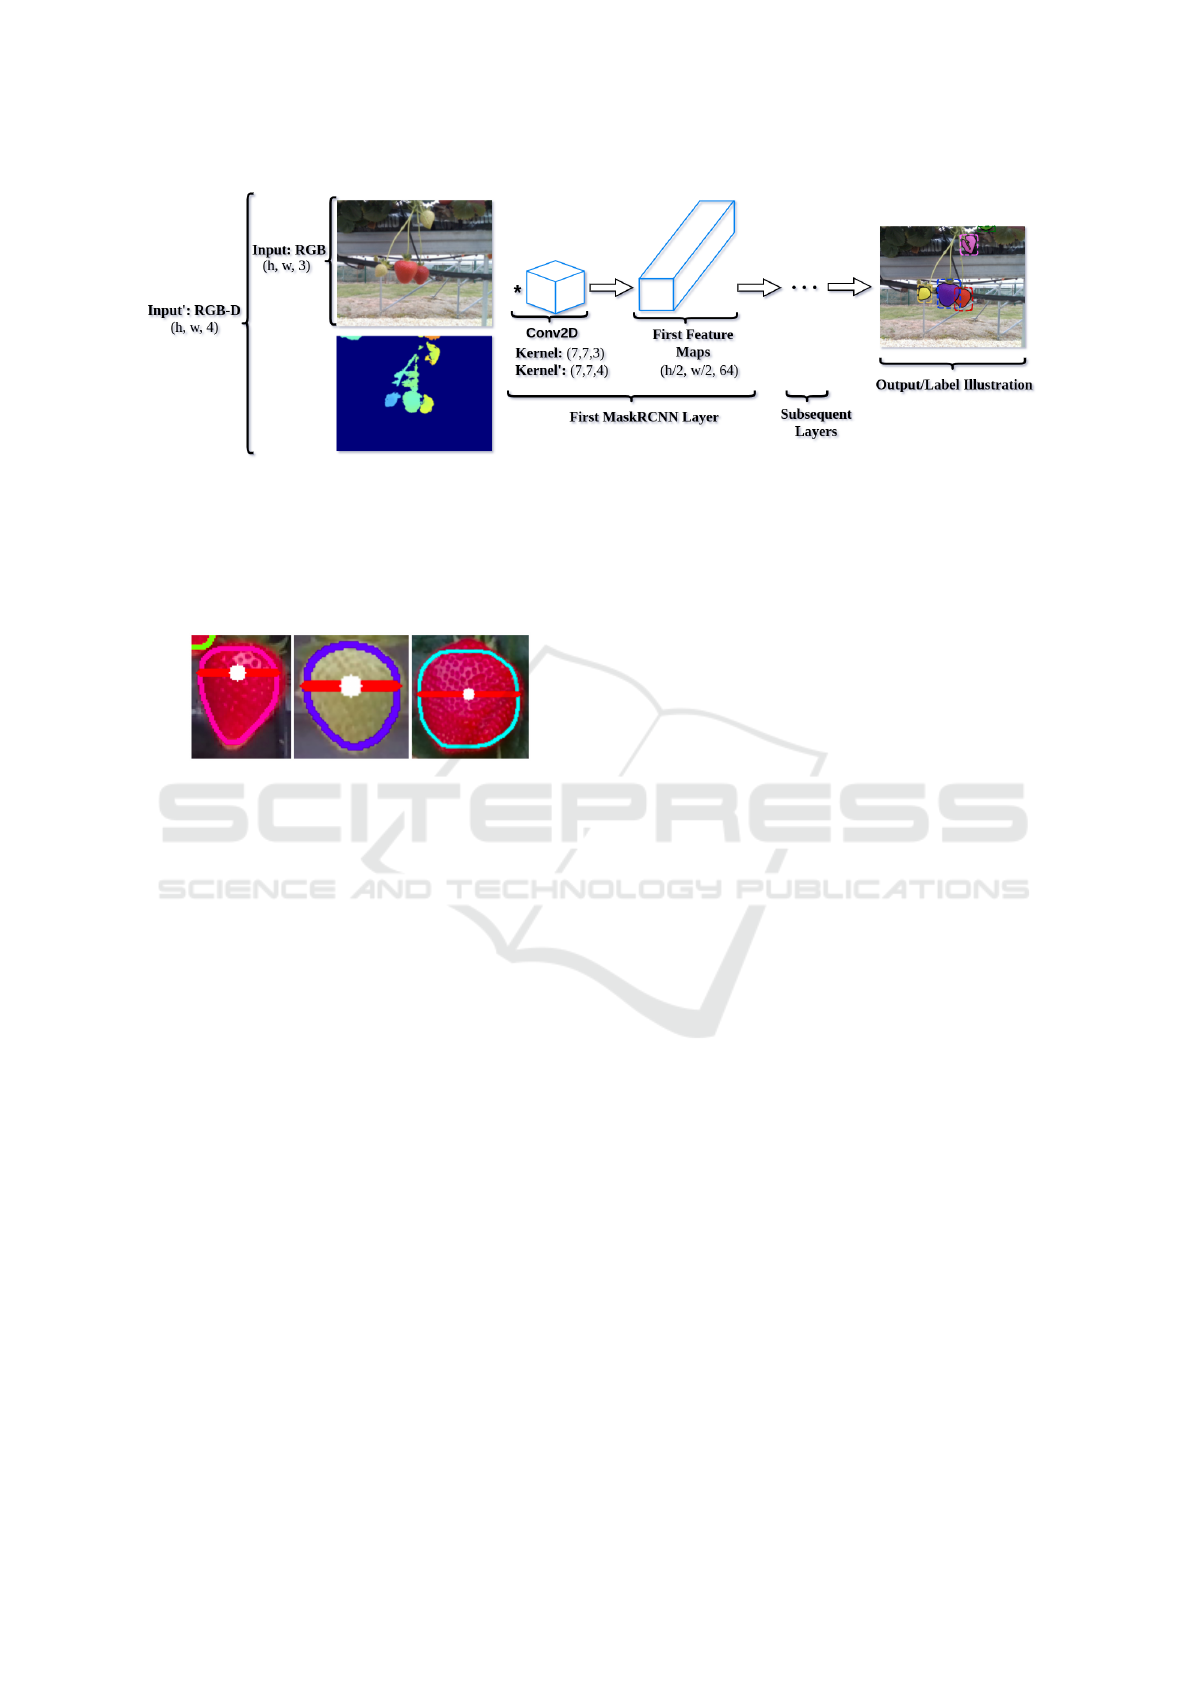
Figure 4: Illustration of the integration of depth information into the MaskRCNN model. The inputs are shown as Input
(RGB) for the original MaskRCNN and Input
′
(RGB-D) for MaskRCNN-D, indicating the addition of depth data. The
kernels Kernel and Kernel
′
are shown to represent the convolutional operations in each model. The output illustrates the
instance segmentation with overlaid bounding boxes and segmentation masks, highlighting the detected instances. Each
detected instance is also classified into one of the predefined categories, but these classifications are not represented in this
figure.
Figure 5: Illustration of the baseline ContourMax algorithm
identifying the widest region of a strawberry. Each panel
shows an instance of a strawberry with its contour high-
lighted, and the widest region marked with a horizontal red
line which is the output of the ContourMax algorithm. The
white dot represents the X and Y pixels for the widest re-
gion.
for overfitting, and improved generalization capabil-
ities (Brock et al., 2021; Balloli, 2021). In this en-
hanced model, we modified the output layer to pro-
duce a regression output: two values representing the
X and Y coordinates of the widest region’s pixels.
Coupled with this Deep Learning approach, we
implemented a pre-processing step that augments the
reliability of input data. To mitigate the inaccuracies
from instance detectors, which can arise due to oc-
clusions from overlapping strawberries or leaves, the
system generates a bounding box around the initial
contour from the instance detector (or label). This
box is then expanded, forming a crop region that en-
sures inclusion of the full strawberry within the re-
gressor’s analysis frame. Such enhancement of the
input area adds robustness against incomplete detec-
tions, helping the regression model to accurately lo-
cate the fruit’s widest section.
4 EXPERIMENTS
The real and simulated datasets, previously shown in
Table 1, were obtained with the Intel®RealSense™
D435 and a simulated version of the stereo camera
to have similar Field of View and Depth capabilities.
Both the simulated stereo camera and the strawberry
plant generator were used in a Gazebo ROS environ-
ment.
An NVIDIA®RTX™ A2000 Laptop GPU was
used to handle the computational demands of infer-
ence and to manage the training phases of the train-
able models.
The experiments were carried out by training the
fruit detection algorithm and the widest region de-
tector as standalone models to optimize their indi-
vidual performances. However, in practical applica-
tion, these models are combined into an integrated ap-
proach, forming an end-to-end solution. This pipeline
operates autonomously to process scenes with multi-
ple plants and strawberries, ultimately identifying the
widest region of each strawberry.
The subsequent subsections delve into the core
experimental analysis, concentrating on two primary
objectives: Fruit Instance Segmentation and Fruit
Widest Region Detection.
4.1 Fruit Instance Segmentation
Experiments
For the task of fruit instance segmentation, we em-
ployed TensorFlow 2 (TF2). The model used was
an adapted version of the MaskRCNN, originally de-
veloped by (Abdulla, 2017) and subsequently up-
ICAART 2024 - 16th International Conference on Agents and Artificial Intelligence
476
dated for compatibility with TF2
3
. Key configura-
tions applied to both segmentation approaches (i.e.,
MaskRCNN and MaskRCNN-D) include early stop-
ping (ES) to prevent overfitting, an image resolution
set to 1024 ×1024 pixels, and the use of ResNet101
as the backbone architecture for feature extraction.
An important feature of R-CNN is Transfer Learn-
ing, which utilizes pre-trained weights from estab-
lished datasets. Motivated by the enhanced efficiency
and generalization capabilities it provides, we used
weights from the SceneNet dataset (Handa et al.,
2015). In order to improve the convergence process,
we used a strategy called exponential decay sched-
ule for the learning rate. This technique methodically
reduces the learning rate with each epoch, enabling
swift initial learning and progressively finer adjust-
ments to the model’s weights as training advances.
The table 2 outlines some of the key training configu-
rations used for both models.
Table 2: Training configurations for fruit instance segmen-
tation experiments.
Config. MaskRCNN MaskRCNN-D
Transfer
Learning
SceneNet
(RGB)
SceneNet
(RGB-D)
Epochs
(ES)
84 97
Learning
Rate
[10
−3
, 10
−4
] [10
−3
, 5 ×10
−4
]
Another important tunable feature implemented in
the model for strawberry detection was to discard all
depth information beyond 30 cm from the camera.
This adjustment is effective in the polytunnels where
strawberries are known to be closer than this thresh-
old, thus focusing the model’s accuracy on the typical
zone for strawberries.
4.2 Fruit Widest Region Detector
The ContourMax model employed for this task is a
direct algorithm that operates without the need for hy-
perparameter tuning, making it straightforward to use.
For the learning model, we adapted the VGG architec-
ture within the PyTorch framework, replacing its con-
ventional CNNs with WSCNNs (Balloli, 2021). The
resulting model, VGG-WSCNN, consists of 16 train-
able convolutional layers. The input images are re-
sized to a resolution of 224×224 pixels with a square
aspect ratio, corresponding to the largest dimension of
the fruit’s expanded bounding box. An early stopping
3
Mask-RCNN-TF2, 2022. Available:
https://github.com/ahmedfgad/Mask-RCNN-TF2 [Ac-
cessed November 5, 2023]
(ES) criterion was also employed to prevent overfit-
ting during training. The table 3 summarizes the train-
ing configurations for the VGG-WSCNN model.
Table 3: Training configurations for the VGG-WSCNN
model used in the widest region detection.
Configuration VGG-WSCNN
Transfer Learning None
Epochs (ES) 17
Learning Rate 10
−4
5 RESULTS AND DISCUSSIONS
This section presents the outcomes of our experi-
ments, examining the performance of the algorithms
through quantitative metrics and visual comparisons.
We first discuss the results of fruit instance segmen-
tation, followed by the assessment of the fruit widest
region detection.
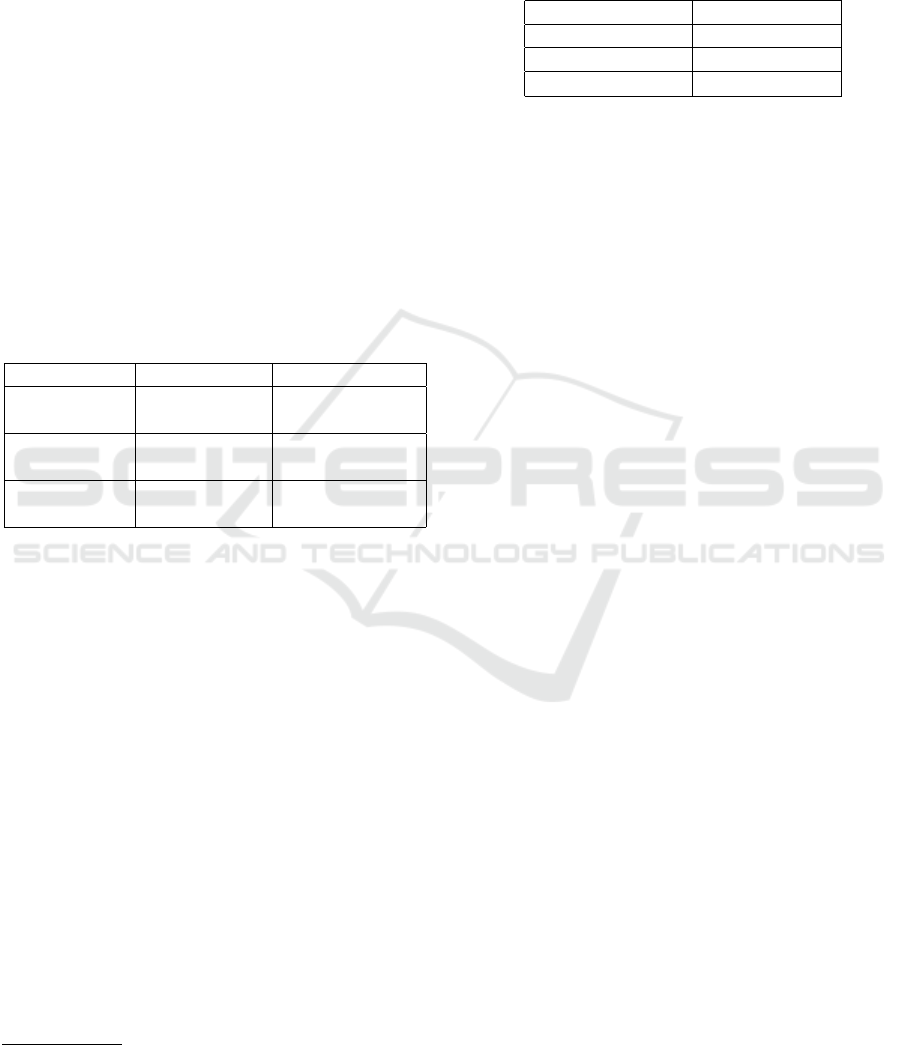
5.1 Fruit Instance Segmentation Results
Initially, we present the normalized confusion ma-
trices for the two instance segmentation models,
MaskRCNN and MaskRCNN-D. These matrices are
derived from a confidence score threshold above 0.8
for detection classification, as referenced in (Huang
et al., 2019). The evaluation covers three test sets:
NO2019, UK/NO2023, and Simulated, as shown
in Figure 6. The confusion matrices indicate that
MaskRCNN-D outperforms MaskRCNN for all the
three test sets, exhibiting higher accuracy in classi-
fying the categories of Ripe, Unripe, and Affected
strawberries. This is evidenced by higher true positive
rates along the diagonals and reduced misclassifica-
tion rates in the off-diagonal elements of the matrices.
It is important to note that unlike the other datasets,
the ’Simulated’ dataset does not have a separate ’Af-
fected’ category. Instead, predictions for ’Unripe’ and
’Affected’ strawberries were combined into a single
’Unripe’ category.
To complement these findings and provide a more
comprehensive assessment of model performance, we
adopt a methodology similar to (Ge et al., 2019), us-
ing the Average Precision (AP) for the two instance
segmentation models. AP calculations are influenced
by the Intersection over Union (IoU) threshold, which
determines true positive detections. In line with the
COCO benchmark standards (Lin et al., 2014) and
mask scoring on MaskRCNN (Huang et al., 2019),
we consider detections with a confidence score above
0.8 and employ an IoU range from 0.5 to 0.75 to cal-
Depth-Enhanced 3D Deep Learning for Strawberry Detection and Widest Region Identification in Polytunnels
477
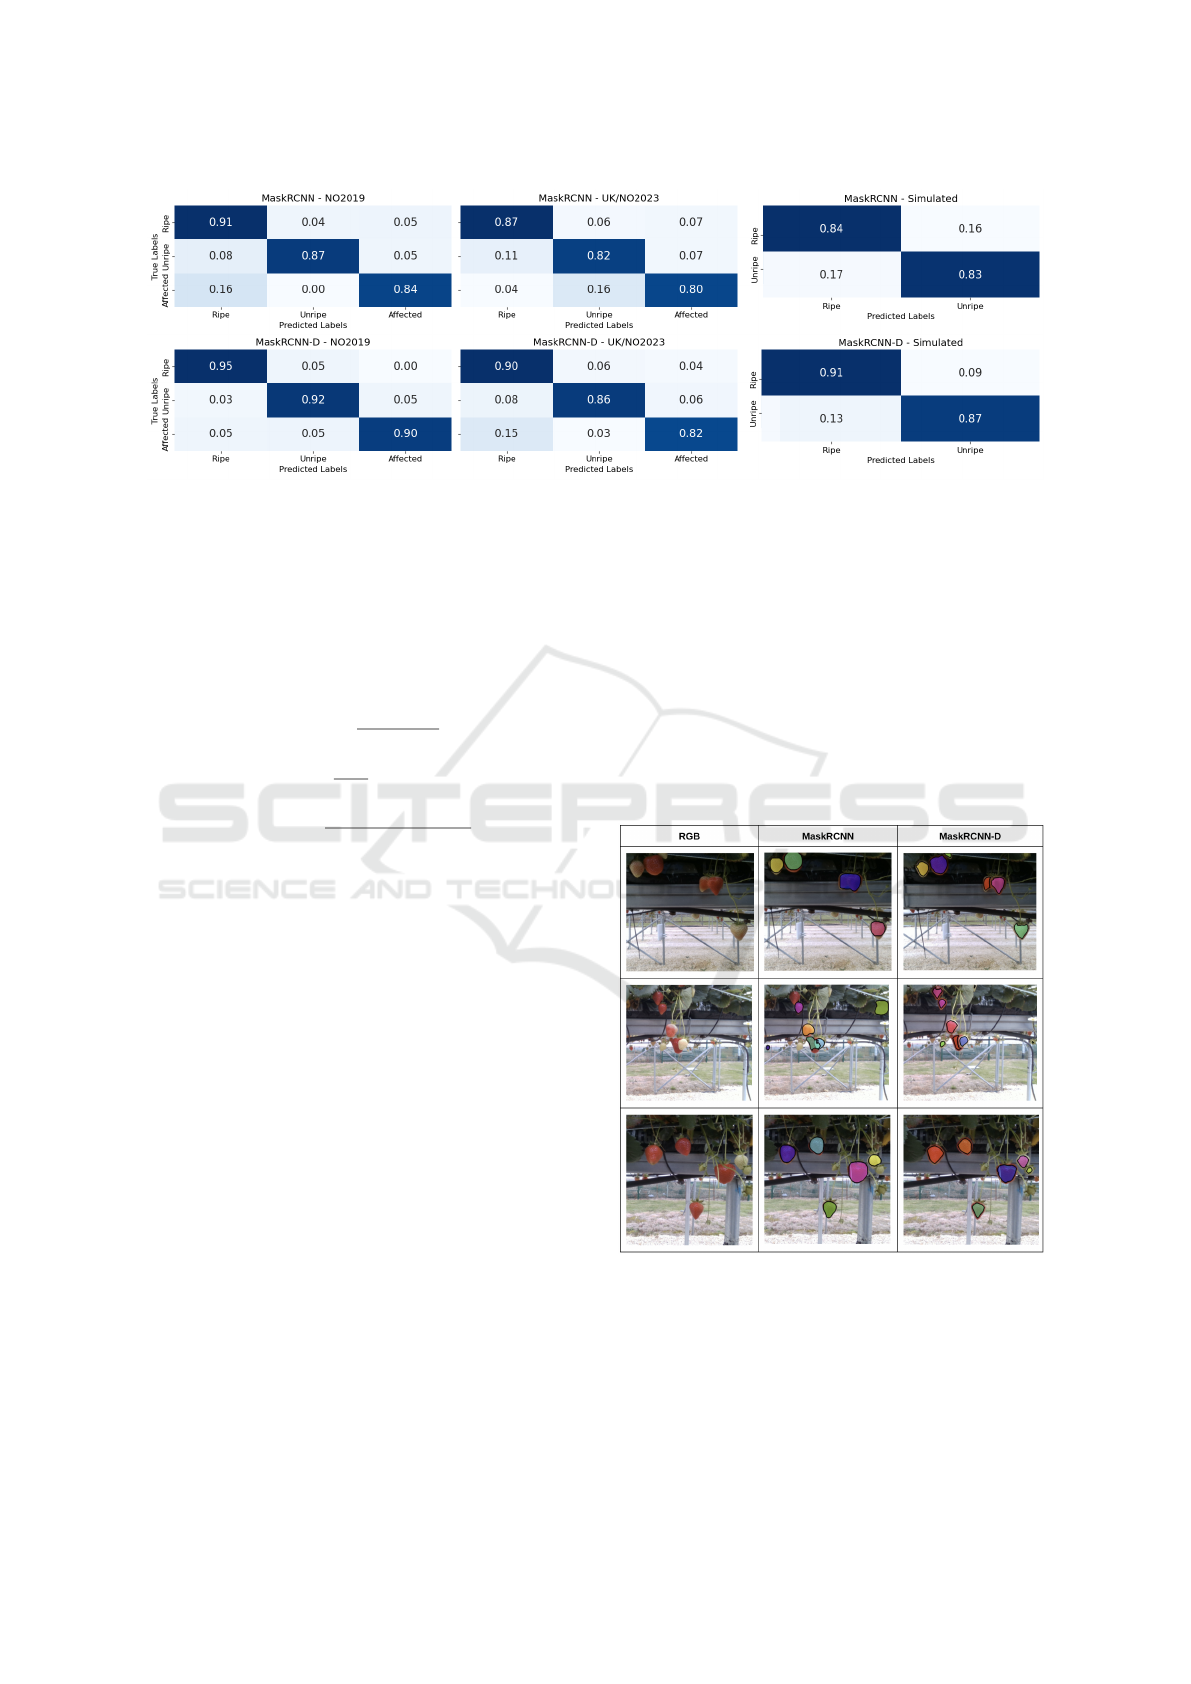
Figure 6: Normalized confusion matrices for MaskRCNN and MaskRCNN-D across the NO2019, UK/NO2023, and Simu-
lated test sets.
culate AP for each class. The mean Average Precision
(mAP) is then computed as the mean of these AP val-
ues across all classes, providing a single performance
summary that accounts for various levels of detection
difficulty. The equations used for these calculations
are shown in Eq. 1.
Precision =
TPs
TPs +FPs
,
Recall =
TPs
GTs
,
F1 = 2 ·
Precision ·Recall
Precision +Recall
,
AP =
Z
1
0
p(r) dr.
(1)
where TPs denote True Positives, FPs denote False
Positives, GTs refer to Ground Truths, and AP is the
Average Precision which is equivalent to the area un-
der the precision-recall curve, ranging from 0 to 1,
with 1 being perfect detection performance. Here,
p(r) represents the precision as a function of recall
r. Comparative tables that involve these metrics can
be viewed in Table 4 for AP scores, and Table 5 for
mAP scores.
As detailed in Table 4, MaskRCNN-D, integrating
depth information, consistently outperforms the base-
line MaskRCNN across all test sets and strawberry
classifications (ripe, unripe, and affected). The per-
formance improvement is especially pronounced in
the simulated environment, likely due to the smoother
depth information from the simulated stereo camera,
offering a more idealized representation compared to
real-world scenarios. Further analysis of the mAP
scores in Table 5 supports these findings, showing sig-
nificant enhancements with MaskRCNN-D: increases
of 8.70% for NO2019, 10.83% for UK/NO2023, and
13.66% in the simulated environment. This highlights
the depth integration’s effectiveness in MaskRCNN-
D, demonstrating its substantial impact across various
testing conditions.
For a detailed visual examination of the MaskR-
CNN and MaskRCNN-D models, Figure 7 presents
comparative examples of the models’ performance on
instance segmentation tasks. The integration of depth
information in MaskRCNN-D not only improves the
overall visual results but also significantly enhances
the model’s ability to distinguish between closely
clustered strawberries, as evidenced by the examples
in the figure.
Figure 7: Visual examples of inputs (RGB) and outputs
from MaskRCNN and MaskRCNN-D. Each row represents
a different example. This figure illustrates the segmentation
capability of the models, showing how detected instances
are outlined.
ICAART 2024 - 16th International Conference on Agents and Artificial Intelligence
478
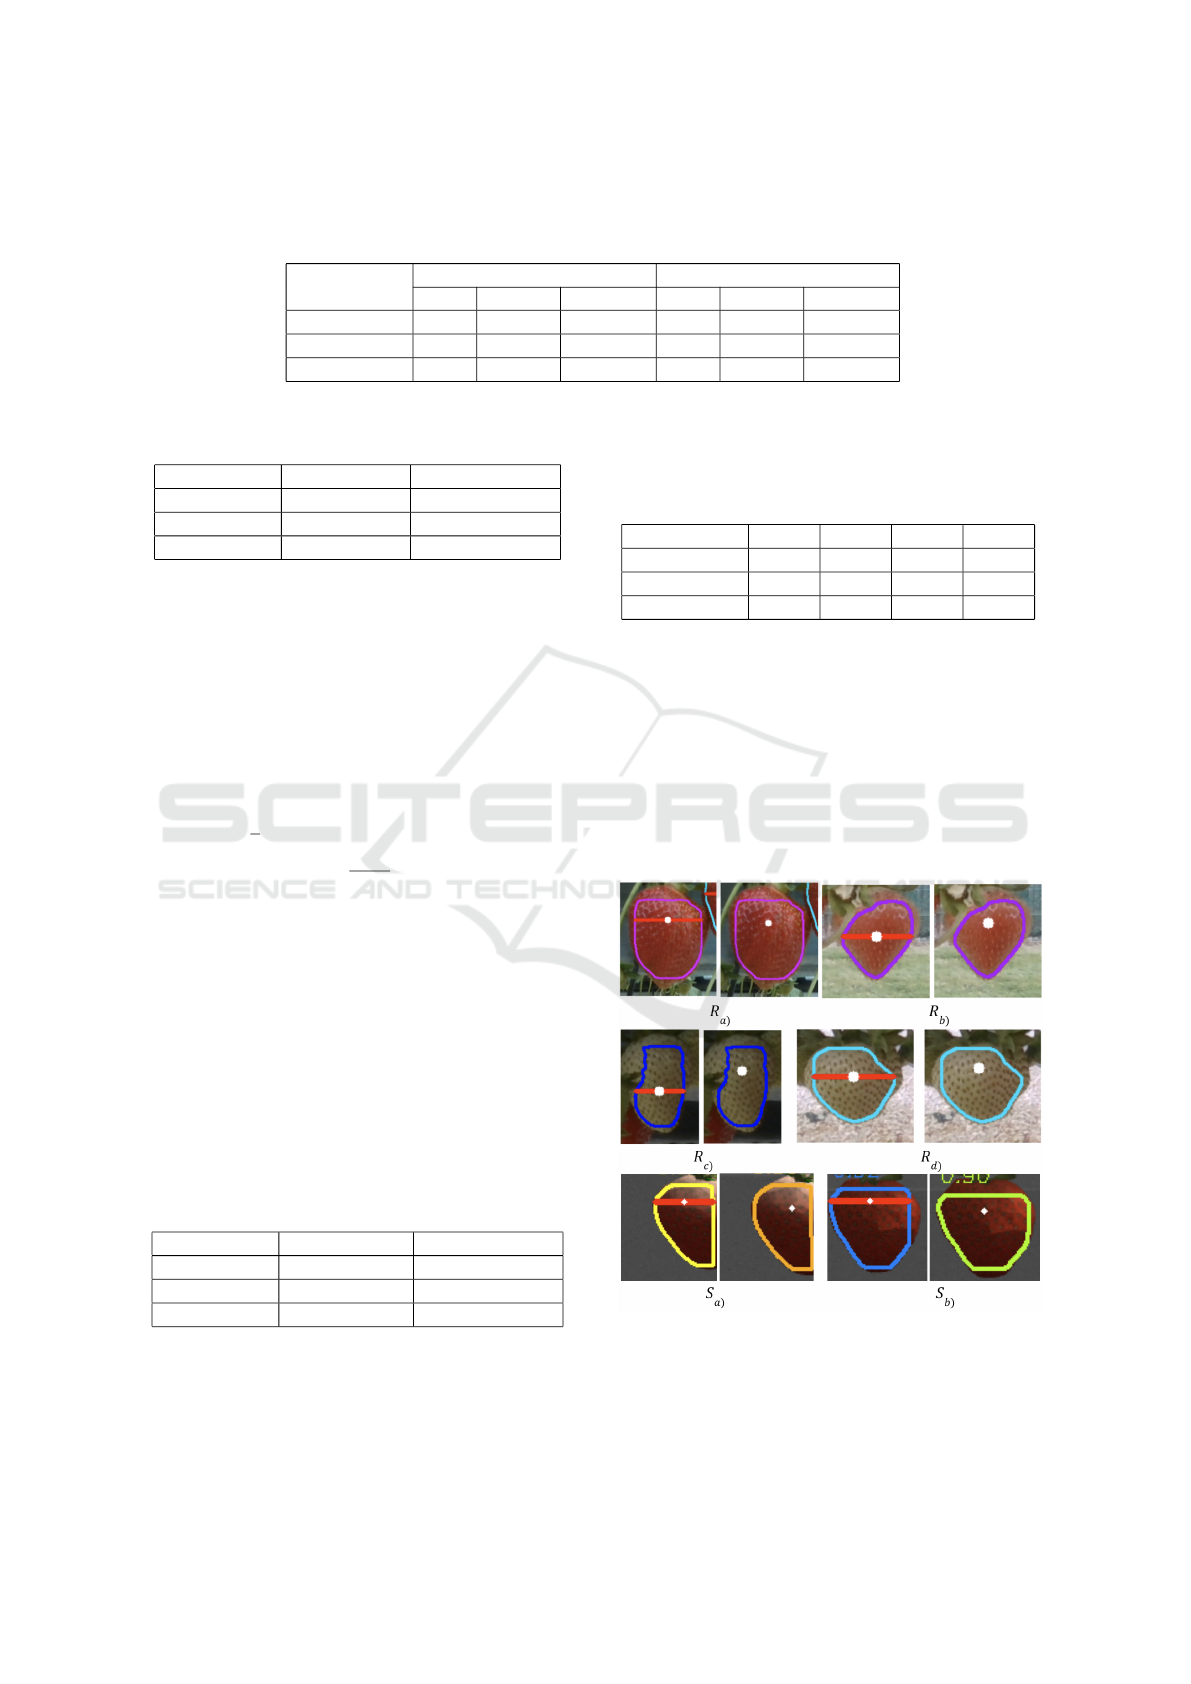
Table 4: Comparison of AP scores for MaskRCNN and MaskRCNN-D on various test sets. The columns under ’Ripe’,
’Unripe’, and ’Affected’ represent the detection classes for strawberries: ’Ripe’ for strawberries in a ripe state, ’Unripe’ for
strawberries that are not yet ripe, and ’Affected’ for strawberries affected by fungal or other diseases.
Test Set
MaskRCNN MaskRCNN-D
Ripe Unripe Affected Ripe Unripe Affected
NO2019 0.86 0.85 0.82 0.94 0.91 0.90
UK/NO2023 0.80 0.81 0.79 0.89 0.90 0.87
Simulated 0.82 0.79 - 0.94 0.89 -
Table 5: Comparison of mAP scores for MaskRCNN and
MaskRCNN-D on various test sets.
Test Set MaskRCNN MaskRCNN-D
NO2019 0.84 0.92
UK/NO2023 0.80 0.89
Simulated 0.81 0.92
5.2 Fruit Widest Region Results
In order to evaluate the performance of the fruit
widest region detectors, we use the Root Mean
Squared Error (RMSE) metric. The RMSE is derived
from the Mean Squared Error (MSE), which calcu-
lates the average squared difference between the esti-
mated and actual values as defined in Equation 2.
MSE =
1
n
n
∑
i=1
(X
r,i
−X
p,i
)
2
+ (Y
r,i
−Y
p,i
)
2
,
RMSE
pixels
= N ×
√
MSE.
(2)
where X
r,i
and Y
r,i
are the labeled pixel coordinates,
X
p,i
and Y
p,i
are the predicted pixel coordinates for the
i-th data point. The variable n indicates the number
of data points in a test set, and N represents the di-
mension of the square image, as both labels and out-
puts were normalized. The performance results for
the standalone Widest Region Detector are presented
in Table 6. Additionally, the combined results of the
Fruit Instance Detector and the Widest Region De-
tector, showcasing the pipeline’s effectiveness, can be
found in Table 7.
Table 6: Comparison of RMSE scores for the standalone
ContourMax and VGG-WSCNN on various test sets.
Test Set ContourMax VGG-WSCNN
NO2019 13.06 10.51
UK/NO2023 12.67 10.26
Simulated 12.47 10.21
Table 6 shows that VGG-WSCNN outperforms
ContourMax in pinpointing the widest fruit region
across various test sets. Table 7 further reveals
that combining MaskRCNN-D with VGG-WSCNN
Table 7: Comparison of RMSE scores for various pipelines
on different test sets. Pipe 1: MaskRCNN + Contour-
Max, Pipe 2: MaskRCNN + VGG-WSCNN, Pipe 3:
MaskRCNN-D + ContourMax, Pipe 4: MaskRCNN-D +
VGG-WSCNN.
Test Set Pipe1 Pipe2 Pipe3 Pipe4
NO2019 24.06 19.74 14.76 12.62
UK/NO2023 26.43 21.82 15.56 13.35
Simulated 26.08 21.74 12.84 11.30
(Pipeline 4) leads to the lowest RMSE scores, indicat-
ing that the end-to-end solution is the most effective
configuration for accurate region detection in both
real and simulated environments. To highlight the
differences reflected in the metric outcomes, Figure
8 showcases visual results from a pipeline approach,
using the best-performing detector (MaskRCNN-D)
for fruit instance detection. It assesses the capabili-
ties of the two different Widest Region Detectors on
both real and simulated datasets.
Figure 8: Comparative visualization of pipeline results us-
ing MaskRCNN-D and alternating the widest region detec-
tor, where each R
i
corresponds to a pair of images from
real-world data and each S
i
to a pair from simulated data.
These pairs contrast the detection outputs of ContourMax
(left) versus VGG-WSCNN (right).
Depth-Enhanced 3D Deep Learning for Strawberry Detection and Widest Region Identification in Polytunnels
479

In the real-world dataset examples (R
i
), it is evi-
dent that the learned approach for locating the widest
region generally shows better results. This is par-
ticularly noticeable in examples R
b
and R
c
, where
the instance segmentation outcome was affected by
leaf occlusion. Due to the ContourMax’s reliance
on segmentation accuracy, the widest region was not
accurately identified in these cases. However, the
learned model, which does not depend as heavily on
the segmentation results, provided satisfactory out-
comes even in these challenging scenarios. When ex-
amining the simulated dataset examples, as in S
a
it is
noted that part of the strawberry was outside the cam-
era’s field of view. However, the learned approach
still managed to identify a point for the widest region
that was closer to the desired location. In the case
of S
b
, although the segmentation by the detector was
not perfect, the learned method still outperformed the
contour-based approach.
6 CONCLUSIONS AND FUTURE
WORK
In this work, we demonstrated the value of depth-
enhanced deep learning models in fruit detection. Our
study shows that depth information significantly en-
hances fruit detection, suggesting that it should be
more explored in the literature.
The learned approach for identifying the widest
fruit region outperformed our direct algorithm, which
indicates the potential of Deep Learning models in
complex agricultural tasks.
A key outcome of this research is the development
of an effective end-to-end pipeline approach. This
pipeline, which combines fruit detection with widest
region localization, is particularly suited for real-time
field applications.
Future work will involve testing the system’s
capabilities with a spectrometer to accurately esti-
mate sugar content. This feature is crucial for auto-
mated harvesting, particularly for determining the op-
timal time for harvesting strawberries based on their
ripeness level.
Additionally, planned developments will involve
adapting MaskRCNN-D to include a specialized head
for the widest region detection. This adaptation aims
to reduce GPU usage and improve efficiency. The po-
tential integration of advanced neural networks, such
as the YOLO family (Reis et al., 2023), may also en-
hance the system’s performance.
Integrating these models with embedded systems
like NVIDIA®Jetson Nano™ is another important
aspect of future research. This integration, along
with the use of mobile manipulators, will facilitate
practical field applications. Our goal is to employ
autonomous agricultural robots, such as Thorvald
(Grimstad and From, 2017), in conjunction with ma-
nipulators like UR-3e, to perform navigation and ma-
nipulation tasks based on the fruit detections.
Lastly, enhancing the strawberry plant generation
in simulations with random variations, such as fungal
infections, is crucial. This will create a robust simu-
lated environment, essential for applying techniques
such as reinforcement learning techniques for precise
positioning.
ACKNOWLEDGEMENTS
This work is partially supported by The Research
Council of Norway as a part of the DigiFoods SFI, un-
der grant agreement 309259. This work was partially
funded by the Coordenac¸
˜
ao de Aperfeic¸oamento de
Pessoal de N
´
ıvel Superior - Brasil (CAPES) - Finance
Code 001; The National Council for Scientific and
Technological Development – CNPq under a Mas-
ters Scholarship and project number 314121/2021-8;
and Fundac¸
˜
ao de Apoio a Pesquisa do Rio de Janeiro
(FAPERJ) - APQ1 Program - E-26/010.001551/2019.
REFERENCES
Abdulla, W. (2017). Mask r-cnn for object detection and
instance segmentation on keras and tensorflow. https:
//github.com/matterport/Mask RCNN.
Badrinarayanan, V., Kendall, A., and Cipolla, R. (2017).
Segnet: A deep convolutional encoder-decoder ar-
chitecture for image segmentation. IEEE transac-
tions on pattern analysis and machine intelligence,
39(12):2481–2495.
Balloli, V. (2021). A pytorch implementation of nfnets and
adaptive gradient clipping. https://github.com/vballol
i/nfnets-pytorch.
Belhumeur, P. N., Hespanha, J. P., and Kriegman, D. J.
(1997). Eigenfaces vs. fisherfaces: Recognition using
class specific linear projection. IEEE Transactions on
pattern analysis and machine intelligence, 19(7):711–
720.
Bolya, D., Zhou, C., Xiao, F., and Lee, Y. J. (2019). Yolact:
Real-time instance segmentation. In Proceedings of
the IEEE/CVF international conference on computer
vision, pages 9157–9166.
Brock, A., De, S., Smith, S. L., and Simonyan, K.
(2021). High-performance large-scale image recog-
nition without normalization. arXiv preprint arXiv:.
Dalal, N. and Triggs, B. (2005). Histograms of oriented
gradients for human detection. In 2005 IEEE com-
puter society conference on computer vision and pat-
ICAART 2024 - 16th International Conference on Agents and Artificial Intelligence
480

tern recognition (CVPR’05), volume 1, pages 886–
893. Ieee.
Ge, Y., Xiong, Y., Tenorio, G. L., and From, P. J.
(2019). Fruit localization and environment percep-
tion for strawberry harvesting robots. IEEE Access,
7:147642–147652.
Grimstad, L. and From, P. J. (2017). The thorvald ii agri-
cultural robotic system. Robotics, 6(4):24.
Gu, J., Wang, Z., Kuen, J., Ma, L., Shahroudy, A., Shuai, B.,
Liu, T., Wang, X., Wang, G., Cai, J., et al. (2018). Re-
cent advances in convolutional neural networks. Pat-
tern Recognition, 77:354–377.
Handa, A., Patraucean, V., Badrinarayanan, V., Stent, S.,
and Cipolla, R. (2015). Scenenet: understanding real
world indoor scenes with synthetic data. arxiv preprint
(2015). arXiv preprint arXiv:1511.07041.
Harini, S., Deshpande, P., Dutta, J., and Rai, B. (2021). A
deep learning-based fruit quality assessment system.
In International Conference on Water Energy Food
and Sustainability, pages 187–192. Springer.
He, K., Gkioxari, G., Doll
´
ar, P., and Girshick, R. (2017).
Mask r-cnn. In Proceedings of the IEEE international
conference on computer vision, pages 2961–2969.
He, K., Zhang, X., Ren, S., and Sun, J. (2016). Deep resid-
ual learning for image recognition. In Proceedings of
the IEEE conference on computer vision and pattern
recognition, pages 770–778.
Huang, Z., Huang, L., Gong, Y., Huang, C., and Wang, X.
(2019). Mask scoring r-cnn. In Proceedings of the
IEEE/CVF conference on computer vision and pattern
recognition, pages 6409–6418.
Ilyas, T., Umraiz, M., Khan, A., and Kim, H. (2021). Dam:
Hierarchical adaptive feature selection using convolu-
tion encoder decoder network for strawberry segmen-
tation. Frontiers in plant science, 12:591333.
Krizhevsky, A., Sutskever, I., and Hinton, G. E. (2012). Im-
agenet classification with deep convolutional neural
networks. Advances in neural information processing
systems, 25.
Le Lou
¨
edec, J. and Cielniak, G. (2021). 3d shape sens-
ing and deep learning-based segmentation of straw-
berries. Computers and Electronics in Agriculture,
190:106374.
Lee, S., Arora, A. S., and Yun, C. M. (2022). Detect-
ing strawberry diseases and pest infections in the very
early stage with an ensemble deep-learning model.
Frontiers in Plant Science, 13:991134.
Lin, T.-Y., Maire, M., Belongie, S., Hays, J., Perona, P.,
Ramanan, D., Doll
´
ar, P., and Zitnick, C. L. (2014).
Microsoft coco: Common objects in context. In Com-
puter Vision–ECCV 2014: 13th European Confer-
ence, Zurich, Switzerland, September 6-12, 2014, Pro-
ceedings, Part V 13, pages 740–755. Springer.
Lins Tenorio, G. and Caarls, W. (2021). Automatic visual
estimation of tomato cluster maturity in plant rows.
Machine Vision and Applications, 32(4):78.
Long, J., Shelhamer, E., and Darrell, T. (2015). Fully con-
volutional networks for semantic segmentation. In
Proceedings of the IEEE conference on computer vi-
sion and pattern recognition, pages 3431–3440.
Lowe, D. G. (2004). Distinctive image features from scale-
invariant keypoints. International journal of computer
vision, 60:91–110.
Nickolls, J. and Kirk, D. (2009). Graphics and computing
gpus. Computer Organization and Design: The Hard-
ware/Software Interface, DA Patterson and JL Hen-
nessy, 4th ed., Morgan Kaufmann, pages A2–A77.
Reis, D., Kupec, J., Hong, J., and Daoudi, A. (2023).
Real-time flying object detection with yolov8. arXiv
preprint arXiv:2305.09972.
Ren, G., Wu, H., Bao, A., Lin, T., Ting, K.-C., and Ying,
Y. (2023). Mobile robotics platform for strawberry
temporal–spatial yield monitoring within precision in-
door farming systems. Frontiers in Plant Science,
14:1162435.
Ronneberger, O., Fischer, P., and Brox, T. (2015). U-
net: Convolutional networks for biomedical image
segmentation. In Medical Image Computing and
Computer-Assisted Intervention–MICCAI 2015: 18th
International Conference, Munich, Germany, October
5-9, 2015, Proceedings, Part III 18, pages 234–241.
Springer.
Russell, B. C., Torralba, A., Murphy, K. P., and Freeman,
W. T. (2008). Labelme: a database and web-based
tool for image annotation. International journal of
computer vision, 77:157–173.
Sather, J. (2019). Viewpoint Optimization for Au-
tonomous Strawberry Harvesting with Deep Rein-
forcement Learning. PhD thesis, California Polytech-
nic State University.
Simonyan, K. and Zisserman, A. (2014). Very deep con-
volutional networks for large-scale image recognition.
arXiv preprint arXiv:1409.1556.
Tan, M. and Le, Q. (2019). Efficientnet: Rethinking model
scaling for convolutional neural networks. In Interna-
tional conference on machine learning, pages 6105–
6114. PMLR.
Viola, P. and Jones, M. (2001). Rapid object detection us-
ing a boosted cascade of simple features. In Proceed-
ings of the 2001 IEEE computer society conference on
computer vision and pattern recognition. CVPR 2001,
volume 1, pages I–I. Ieee.
Wold, J. P., O’Farrell, M., Andersen, P. V., and Tschudi, J.
(2021). Optimization of instrument design for in-line
monitoring of dry matter content in single potatoes by
nir interaction spectroscopy. Foods, 10(4):828.
Depth-Enhanced 3D Deep Learning for Strawberry Detection and Widest Region Identification in Polytunnels
481
