
USTAR2: Fast and Succinct Representation of k-mer Sets Using De
Bruijn Graphs
Enrico Rossignolo and Matteo Comin
Department of Information Engineering, University of Padova, Padova, 35131, Italy
Keywords:
k-mer Set, Compression, Smallest Path Cover.
Abstract:
A fundamental operation within the realm of computational genomics revolves around the reduction of input
sequences into their constituent k-mers. The development of space-efficient methods to represent a collection
of k-mers assumes significant importance in advancing the scalability of bioinformatics analyses. One preva-
lent strategy involves transforming the set of k-mers into a de Bruijn graph and subsequently devising a stream-
lined representation of this graph by identifying the smallest path cover. In this article, we introduce USTAR2,
a novel algorithm for the compression of k-mers. USTAR2 harnesses the principles of node connectivity in the
de Bruijn graph, for a more efficient selection of paths for constructing the path cover. We performed a series
of test on the compression of real read datasets, and compared USTAR2 with several other tools. USTAR2
achieved the best performance in terms of compression, it requires less memory and it is also considerably
faster (up to 96x). The code of USTAR2 is available at the repository https://github.com/CominLab/USTAR2.
1 INTRODUCTION
The field of computational genomics heavily relies on
k-mer-based tools for various advantages over those
directly processing reads or read alignments. These
tools primarily function by transforming input se-
quence data, which may vary in length based on se-
quencing technology, into a set of k-mers – fixed-
length strings – along with their counts.
k-mer-based methods have demonstrated supe-
rior performance across multiple applications. For
instance, in genome assembly, tools like Spades
(Bankevich et al., 2012) effectively reconstruct entire
genomes from reads with high accuracy using k-mer-
based techniques. In metagenomics, Kraken (Wood
and Salzberg, 2014) excels at classifying microorgan-
isms in complex environmental samples using k-mers,
delivering a speed advantage of up to 900 times com-
pared to MegaBLAST. Consequently, numerous tools
for metagenomic classification are now k-mer-based
(Andreace et al., 2021; Qian and Comin, 2019; Ca-
vattoni and Comin, 2023; Storato and Comin, 2022).
In genotyping, several tools (Denti et al., 2019;
Sun and Medvedev, 2019; Marcolin et al., 2022;
Monsu and Comin, 2021) employ k-mers instead of
alignments to identify genetic variations in individu-
als and populations. In phylogenomics, Mash (On-
dov et al., 2016) effectively uses k-mers to estimate
distances between genomes and metagenomes, aid-
ing in the reconstruction of evolutionary relationships
among organisms. In database searching, a plethora
of k-mer-based methods (Sun et al., 2018; Harris and
Medvedev, 2020; Bradley et al., 2019; Pandey et al.,
2018a; Marchet et al., 2020) have been introduced to
efficiently search sequences.
k-mer-based methods have revolutionized multi-
ple aspects of bioinformatics and have become in-
dispensable for analyzing large-scale genomic data.
To handle the vast modern sequencing datasets, these
tools often rely on specialized data structures for rep-
resenting sets of k-mers.
Storing sets of k-mers can be space-intensive, es-
pecially for large databases. Conway and Bromage
(Conway and Bromage, 2011) determined that, in
the worst case, at least log
4
k
n
bits are needed to
losslessly store a set of n k-mers. However, k-mer
sets generated from sequencing experiments often ex-
hibit a spectrum-like property (Chikhi et al., 2021)
and contain redundant information. Hence, practi-
cal data structures can significantly improve on this
bound (Chikhi et al., 2016).
Given the non-negligible space requirements for
storing k-mer sets, it is desirable to reduce their size.
For example, the dataset used to test the BIGSI (Rah-
man and Medvedev, 2020) index consumes approxi-
mately 12 TB of storage in compressed form.
368
Rossignolo, E. and Comin, M.
USTAR2: Fast and Succinct Representation of k-mer Sets Using De Bruijn Graphs.
DOI: 10.5220/0012423100003657
Paper published under CC license (CC BY-NC-ND 4.0)
In Proceedings of the 17th International Joint Conference on Biomedical Engineering Systems and Technologies (BIOSTEC 2024) - Volume 1, pages 368-378
ISBN: 978-989-758-688-0; ISSN: 2184-4305
Proceedings Copyright © 2024 by SCITEPRESS – Science and Technology Publications, Lda.

The necessity for an efficient representation be-
comes evident when we consider the vast volume of
data accessible to bioinformaticians. With the contin-
ued availability of cutting-edge sequencing technolo-
gies, the quantity of genomic data is projected to grow
substantially in the coming years. Consequently, the
analysis of this data necessitates increasingly substan-
tial computational resources.
However, this challenge could be mitigated by
employing a more compact representation that min-
imizes RAM usage and expedites the analysis tools,
thereby enabling the execution of more extensive
pipelines with reduced computational overhead. To
achieve this objective, a plain text representation of
k-mers has emerged as the most practical solution.
Formally, a plain text representation constitutes a
set of strings that encompasses every k-mer derived
from the input strings (including forward, reverse-
complemented, or both), while excluding any other k-
mer. Such a set is referred to as a spectrum-preserving
string set (SPSS).
A plain text representation offers a substantial ad-
vantage in certain tools, such as Bifrost’s query (Hol-
ley and Melsted, 2020), that can be utilized without
requiring any modifications.
In this paper we present USTAR2 an algorithm for
k-mer set compression based on the node connectivity
of the de Bruijn graph.
1.1 Related Works
The idea of storing a set of k-mers in plain text, with-
out repetition of k-mers, to achieve a more compact
and potentially simpler representation has recently
been independently discovered and given the name
“spectrum-preserving string sets” (SPSS) by Rahman
and Medvedev (Rahman and Medvedev, 2020), and
“simplitigs” by B
ˇ
rinda, Baym, and Kucherov (B
ˇ
rinda
et al., 2021). To avoid any confusion with our rede-
fined SPSS, we refer to this concept as “simplitigs” in
our work.
Both Rahman and Medvedev and B
ˇ
rinda, Baym,
and Kucherov put forward implementations that in-
volve greedily joining consecutive unitigs to create
such a representation. The UST algorithm by Rahman
and Medvedev operates on the node-centric de Bruijn
graph of the input strings, finding arbitrary paths in
the graph that start from arbitrary nodes.
B
ˇ
rinda, Baym, and Kucherov’s greedy algorithm
for computing simplitigs (for which the authors pro-
vide an implementation known as ProphAsm) does
not construct a de Bruijn graph. Instead, it gathers
all k-mers into a hash table and extends arbitrary k-
mers both forward and backward until they can no
longer be extended, ensuring that no k-mers are re-
peated. The extended k-mers become the final output.
Both of these heuristic approaches significantly
reduce the number of strings (string count, SC) and
the total character count in the strings (cumulative
length, CL) needed to store a k-mer set. The de-
crease in CL directly translates to reduced memory
consumption for string storage. Additionally, the re-
duction in SC is advantageous as it impacts the size
of the index structure used to store the strings, which
can be smaller when fewer strings are present.
B
ˇ
rinda, Baym, and Kucherov have shown that
both SC and CL are significantly reduced, particu-
larly for complex de Bruijn graphs, such as those for
single large genomes with short k-mer lengths and
pangenome graphs with numerous genomes. Further-
more, they have demonstrated the benefits of using
heuristic simplitigs in downstream applications, such
as improved run time for k-mer queries using BWA
(Li and Durbin, 2009). Khan et al. (Khan et al.,
2022) have provided an overview of using heuristic
simplitigs for various genomes, including a human
gut metagenome.
Both sets of authors have established a lower
bound on the cumulative length of simplitigs and
demonstrated that their heuristics produce represen-
tations with a cumulative length closely approach-
ing the lower bound for typical k-values, e.g. 31.
When k-values are lower (e.g., < 20 ), resulting in
denser de Bruijn graphs, their heuristic does not ap-
proach the lower bound as closely as for larger k-
values. Recently, in (Rossignolo and Comin, 2023)
the authors proposed a different heuristics based on
graph connectivity. USTAR (Unitig STitch Advanced
constRuction), follows a similar paradigm but im-
plements a better strategy for exploring De Bruijn
graphs. The USTAR strategy leverages the density of
the de Bruijn graph and node connectivity, enabling
a more effective path selection for the construction of
the path cover, and thus improving the compression,
especially on denser de Bruijn graphs.
All these authors have explored whether com-
puting minimum simplitigs without repeating k-mers
might be NP-hard. This has been recently disproved
by Schmidt and Alanko (Schmidt and Alanko, 2023),
who have shown that simplitigs with minimum cu-
mulative length, named also Eulertigs, can be com-
puted in polynomial time. Eulertigs are only slightly
smaller than strings computed by previous heuristics,
which suggests that further progress may be limited
when k-mer repetitions are not allowed in a plain text
representation.
Several tools are already available that leverage
simplitigs. For instance, the compacted de Bruijn
USTAR2: Fast and Succinct Representation of k-mer Sets Using De Bruijn Graphs
369

graph builder Cuttlefish2 (Khan et al., 2022) offers an
option to output simplitigs instead of maximal unit-
igs. A recent proposal for a standardized file format
for k-mer sets explicitly supports simplitigs (Dufresne
et al., 2022) and other plain text representations.
Recently, in (Schmidt et al., 2023), the authors
present the first algorithm for finding an SPSS of min-
imum size (CL) allowing for repeated k-mers. The
compression advantage of SPSS w.r.t. simplitigs and
eulertigs is considerable. They demonstrate that a
minimum SPSS with repeated k-mers is polynomi-
ally solvable, relying on a many-to-many min-cost
path query and a min-cost perfect matching approach.
However this optimal algorithm, called Matchtigs, re-
quires O(n
3
m) time, where n is the number of nodes
in the de Bruijn graph and m the number of arcs, and
thus it can not be run on large datasets. The same au-
thors provide a greedy heuristic for generating a com-
pact SPSS, called Greedy Matchtigs, omitting the op-
timal matching.
In this paper, we present USTAR2 a faster and
more memory-efficient greedy heuristic for generat-
ing a compact SPSS for large datasets. USTAR2 fol-
lows the same paradigm of USTAR (Rossignolo and
Comin, 2023), however it allows for repeated k-mers
and it can efficiently explore the de Bruijn graph at a
deeper level yielding a better compression.
2 USTAR2: UNITIG STitch
ADVANCED constRuction 2
2.1 Definitions
In the context of this paper, we consider a string com-
posed of characters from the set Σ = {A,C, T, G}. A
string with a length of k is referred to as a “k-mer”.
Its “reverse complement”, denoted as rc(·), is derived
by reversing the k-mer and substituting each character
with its complementary base, such as A 7→ T , C 7→ G,
T 7→ A, and G 7→ C. Since the origin DNA strand is
unknown, we treat a k-mer and its reverse comple-
ment as identical.
Given a string s = ⟨s
1
, . . . ,s
|s|
⟩, we use pre f
i
(s)
to denote the first i characters of s, and su f
i
(s) for
the last i characters. We introduce the “glue” oper-
ation between two strings, u and v, where su f
k−1
(u)
matches pre f
k−1
(v). This operation concatenates u
with the suffix of v:
u ⊙
k−1
v = u · su f
|v|−(k−1)
(v)
For example, given two 3-mers, u = CT G and v =
T GA, their gluing results in u ⊙
2
v = CT GA.
A collection of k-mers can be graphically rep-
resented by a de Bruijn graph, where we introduce
a node-centric definition, indicating that the con-
nections (arcs) are implicitly defined by the nodes.
Therefore, we use the terms k-mers set and dBG(K)
interchangeably.
For a given set of k-mers K = {m
1
, . . . m
|K|
}, a de
Bruijn graph of K is a directed graph, dBG(K) = (V ,
A), with the following attributes:
1. V = {v
1
, . . . ,v
|K|
}
2. Each node v in V is assigned a label lab(v
i
) = m
i
3. Each node v in V has two distinct sides s
v
∈ {0, 1},
where (v, 1) is visually represented with a tip
4. A node side (v, s
v
) is spelled as:
spell(v, s
v
) =
(
lab(v) if s
v
= 0
rc(lab(v)) if s
v
= 1
(1)
5. An arc exists between two node sides (v, s
v
) and
(u, s
u
) if and only if there are spellings that share
a (k − 1)-mer. In particular, this condition holds:
(v, s
v
), (u,s
u
)
∈ A ⇐⇒
su f
k−1
(spell (v, 1 − s
v
)) = pre f
k−1
(spell (u, s
u
))
This right-hand condition is also known as the
(v, u)-oriented-overlap (Rahman and Medvedev,
2020).
It’s important to note that the notion of node sides
allows for treating a k-mer and its reverse complement
as the same entity. Moreover, nodes can be associated
with k-mer counts.
A path p = ⟨(v
1
, s
1
), .. . ,(v
l
, s
l
)⟩ is spelled by con-
catenating the spellings of its node sides:
spell(p) = spell(v
1
, s
1
) ⊙
k−1
··· ⊙
k−1
spell(v
l
, s
l
)
A path p is considered a “unitig” if its internal
nodes have both in-degree and out-degree equal to
1. Additionally, a unitig is labeled as “maximal” if
it cannot be extended on either end. To reduce mem-
ory usage, a dBG(K) can be “compacted” by replac-
ing maximal unitigs with single nodes labeled with
the spellings of the unitigs.
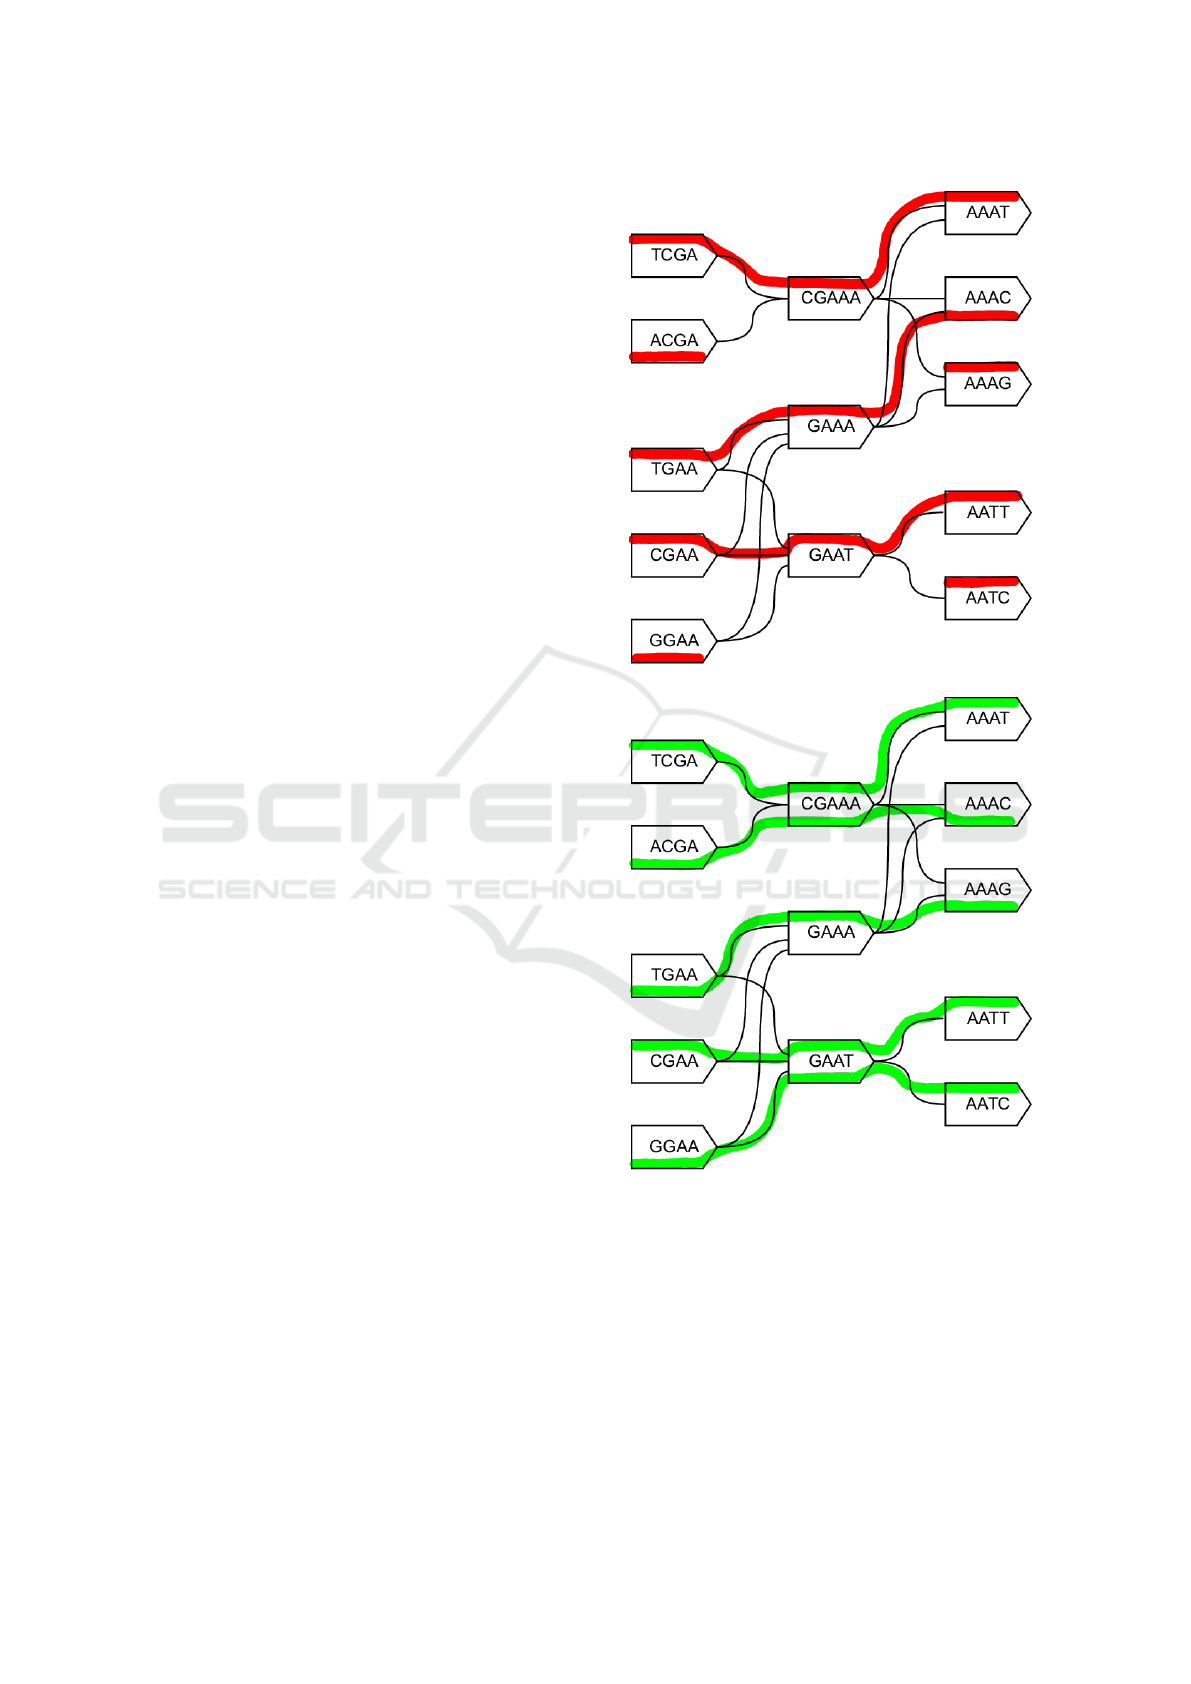
An example of a compacted dBG(K), with k = 4,
is presented in Figure 1. In this example, the maxi-
mal unitig (CGAA, GAAA) has been replaced with the
node CGAAA.
2.2 Fast and Succint k-mer Set
Compression
Compressing a k-mer set K can be achieved by finding
a representation S of K made of strings of any length
BIOINFORMATICS 2024 - 15th International Conference on Bioinformatics Models, Methods and Algorithms
370
such that the set of its substrings of length k is equal
to K.
The spectrum of a set of strings S is defined as the
set of all k-mers and their reverse complements that
occur in at least one string s ∈ S, formally
spec
k
(S) = {r ∈ Σ
k
|∃s ∈ S : r or rc(r) is substring of s}
Let’s start with a given set of input strings, de-
noted as K, each having a length of k characters. Our
objective is to determine a minimal set of strings that
preserves a specific spectrum. Let’s provide a formal
definition:
Definition 2.1. A Spectrum Preserving String Set
(SPSS) for the input set K is a collection of strings,
denoted as S, where each string in S has a length of
at least k, and such that spec
k
(K) = spec
k
(S). The
SPSS is characterized by the property that it contains
the same set of k-mers as the input set K, either di-
rectly or as their reverse complements.
Importantly, our definition allows for the repeti-
tion of k-mers and their reverse complements, both
within the same string and across different strings.
A natural way to measure the size of a string set S
is by computing its cumulative length defined as the
sum of all the string lengths:
CL(S) =
∑
s∈S
|s|
where |s| is the length of the string s.
Problem 1. Given as input a k-mer set K, find the
Spectrum Preserving String Set S with minimum size
CL(S).
In summary, our goal is to find the smallest set of
strings, each with a length of at least k, while ensur-
ing that this set retains the same k-mer spectrum as the
original input strings, even if k-mers and their reverse
complements are repeated within or across strings.
This differs from the concept of simplitigs, which ad-
here to stricter rules regarding k-mer repetitions.
It has been shown in (Schmidt et al., 2023) that
Problem 1 can be solved exactly in polynomial time.
The authors provided an algorithm based on a many-
to-many min-cost path query and a min-cost perfect
matching approach. However this optimal algorithm,
called Matchtigs, requires O(n
3
m) time, where n is
the number of nodes in the de Bruijn graph and m the
number of arcs, and thus it can not be run on large
datasets.
The aim of this study is to construct an efficient
heuristic that can be run on large datasets while main-
taining a good compression of k-mers.
Consider again the example in Figure 1. From
the path p = (GGAA, GAAT, AATC) we can compute
(a)
(b)
Figure 1: An example of a compacted de Bruijn graph with
k = 4. Nodes are labeled with k-mers. In Figure (a) an
example of simplitigs represented by the red disjoint path
cover, where each node is traversed only once. In this case,
the total CL is 35. In Figure (b) an example of SPSS rep-
resented by the green path cover computed by USTAR2,
where nodes can be reused and the total CL is 32.
its spell spell(p) = GGAATC that contains all the 4-
mers GGAA, GAAT and AATC in p, with a saving of
6 bases. Thus from a set of paths P that contains all
USTAR2: Fast and Succinct Representation of k-mer Sets Using De Bruijn Graphs
371

the nodes in dBG(K) we can derive a set S of strings
that represent all the k-mers in K. Therefore a path
cover can be used in order to compute S and thus to
compress the k-mer set. Note that the paths can pass
through the same node more than once.
For the case of simplitigs, where k-mers cannot
be reused, greedy and non-optimal algorithms have
been proposed. ProphAsm (B
ˇ
rinda et al., 2021) uses
a simple heuristic that takes an arbitrary k-mer in
the dBG(K), and it tries to extend it forward and
backward as long as possible and it restarts until
it consumes all the k-mers. Similarly, using as in-
put the compacted dBG(K) constructed by BCALM2,
UST (Rahman and Medvedev, 2020) takes an ar-
bitrary node, tries to extend it forward as long as
possible, and restarts until there are available nodes.
In the end, UST merges linked paths. Both meth-
ods perform a similar strategy by picking the first
available k-mer and extending it without consid-
ering the whole graph structure. If we consider
the example in Figure 1, ProphAsm and UST, by
choosing nodes arbitrarily, may build the simplitigs
shown in Figure 1 (a). If we compute the spelling
of each path we obtain the set of 7 strings S =
{TCGAAAT, ACGA, T GAAAC, AAAG,CGAATT,
GGAA, AATC} with cumulative length CL(S) = 35.
If we want to solve Problem 1 and to construct a
minimum SPSS, as in (Schmidt et al., 2023), it will
require O(n
3
m) time. As discussed by the authors,
this exact algorithm is impractical for large datasets.
We can observe, for the case of simplitigs, that both
ProphAsm and UST are not-optimal algorithms, how-
ever, the basic structure of these tools is very efficient,
as all nodes are considered only once.
In this work, we present USTAR2 (Unitig STitch
Advanced constRuction) a fast compression algo-
rithm that exploits the connectivity of the dBG graph,
to ensure a good compression ratio, while efficiently
traversing the graph.
USTAR2 also implements a heuristic to recon-
struct a minimum SPSS. As UST, also USTAR2 takes
advantage of the compacted de Bruijn graph com-
puted by BCALM2. Similarly to UST and ProphAsm,
at each step, USTAR2 selects a seed node in the
graph, and then it tries to compute a path starting from
this node. A path is constructed by connecting adja-
cent nodes until the path cannot be further extended.
The algorithm continues with the selection of a new
seed node until all nodes have been covered by a path.
The two key operations in this algorithm are how to
select a good seed node, and how to extend a path
among the available connections.
The pseudocode of USTAR2 is shown in Algo-
rithm 1.
Algorithm 1: USTAR2.
Data: de Bruijn graph dBG
Result: SPSS S
begin
S =
/
0
seed-nodes = sort nodes by Imb(node)
for seed ∈ seed-nodes do
if seed is not visited then
visit(seed)
contig = Extend(seed) to the
right
contig = Extend(contig) to the
left
S = S ∪ {contig}
return S
Function Extend(contig):
L = {non-visited neighbors of contig
head}
while L not empty do
v = less connected node in L
visit(v)
contig = merge(v, contig)
L = {non-visited neighbors of v}
L = {neighbors of contig head}
level = 1
found new node = false;
while level<=D and not found new node
do
L = {neighbors of all nodes in L}
level=level+1
L = Filter(L)
L
′
= {non-visited nodes in L}
if L
′
not empty then
k = less connected node in L
′
visit(k)
found new node = true;
p = path from k to contig head
contig = merge(p, contig)
if found new node then
return Extend(contig)
else
return contig
Function Filter(L):
for v ∈ L do
p = path from v to contig head
if length(p) > 2k - 2 then
remove v from L
return L
BIOINFORMATICS 2024 - 15th International Conference on Bioinformatics Models, Methods and Algorithms
372
Table 1: A summary of the read datasets used in the experiments. Datasets are downloaded from NCBI’s Sequence Read
Archive.
Dataset Description Read Length #Reads Size [GB]
SRR001665 Escherichia coli 36 20,816,448 9.304
SRR061958 Human Microbiome 1 101 53,588,068 3.007
SRR062379 Human Microbiome 2 100 64,491,564 2.348
SRR10260779 Musa balbisiana RNA-Seq 101 44,227,112 2.363
SRR11458718 Soybean RNA-seq 125 83,594,116 3.565
SRR13605073 Broiler chicken DNA 92 14,763,228 0.230
SRR14005143 Foodborne pathogens 211 1,713,786 0.261
SRR332538 Drosophila ananassae 75 18,365,926 0.683
SRR341725 Gut microbiota 90 25,479,128 1.254
SRR5853087 Danio rerio RNA-Seq 101 119,482,078 3.194
SRR957915 Human RNA-seq 101 49,459,840 3.671
In order to select a good seed node, we need to
ensure that this node will be part of an optimal path
for the SPSS problem. We define the imbalance of
a node, Imb(v) = |OutDegree(v) − InDegree(v)|, as
the difference between the out-degree and in-degree
of the node v. In general, if a node is balanced, that is
Imb(v) = 0, it will be traversed by some paths. How-
ever, as proved in (Schmidt et al., 2023), if a node is
imbalanced Imb(v) ̸= 0 it must be the starting or end-
ing point of some optimal path. Thus, nodes that are
balanced should not be considered as starting points,
instead, only the imbalanced nodes can be used as
seed nodes. To take advantage of this observation,
in USTAR2, at each iteration, we decided to select as
seed node the most imbalanced node, i.e. the node
with the highest value of Imb(v).
The topological properties of the de Bruijn graph
are important, not only for the identification of good
seed nodes, but also for the construction of a path
from this node.
For the path cover construction, in the case of
simplitigs, we observed that UST and ProphAsm
might choose a highly connected node (Rossignolo
and Comin, 2023), and since this node will not be
available in the subsequent iterations, this selection
may lead to isolated nodes, that will increase the cu-
mulative length. In Figure 1 (a) we can see that the
path cover of simplitigs generates four isolated nodes.
These isolated nodes are the ones responsible for the
large value of CL. In the case of SPSS, even if nodes
can be visited more than once, this observation still
holds.
In USTAR2 we try to avoid this scenario. At each
iteration, we extend the current path by selecting the
node with fewer connections. This will ensure that
highly connected nodes are still available for future
iterations. This choice will help to have a lower CL
since they create fewer and longer strings, reducing
the chances of creating isolated nodes. Similarly to
UST, in USTAR2 we extend the current seed node,
first to the right and then to the left, in order to recon-
struct a contig.
If the current contig cannot be further extended,
because all neighboring nodes have been already vis-
ited, we try to re-use one of these nodes in order to
reach an unvisited node. This search is implemented
with a breadth-first search on the graph with a thresh-
old D that limits the depth of the visit. At each iter-
ation we prune the search space of the graph, remov-
ing the branches that will increase the CL. In partic-
ular, we remove the nodes that will generate a path
of length greater than 2k − 2, because in this case,
the CL will not improve, and it is better to generate
two separate contigs rather than extending the current
one. If there are multiple candidate unvisited nodes,
we select again the one with fewer connections, for
the same considerations of above.
In terms of running time, the above algorithm will
traverse efficiently the de Bruijn graph. Moreover,
since we are dealing with DNA sequences, each node
in the de Bruijn graph can have at most 4 neighbors.
If we consider the example in Figure 1 (b)
we can observed that, if we are allowed to tra-
verse a node multiple times, USTAR2 can recon-
struct a SPSS of minimum size. USTAR2 guar-
antees that while constructing the first paths, the
most connected node GAAA is avoided. This
will produce a cover of the dBG with the paths
(in green) and thus a set of 5 strings S
′
=
{TCGAAAT, ACGAAAC, T GAAAG,CGAAT T,
GGAATC}. If we measure the cumulative length of
S
′
we have that CL(S
′
) = 32.
CL(S
′
) = 32 < CL(S) = 35 < CL(K) = 53
Overall, in this example, the uncompressed k-mer set
will require CL(K) = 53, with simplitigs the k-mer
USTAR2: Fast and Succinct Representation of k-mer Sets Using De Bruijn Graphs
373

set can be compressed with CL(S) = 35, whereas US-
TAR2, and its SPSS, will produce a better compres-
sion with CL(S
′
) = 32.
3 RESULTS
In this section, we present a series of experiments
conducted to identify the most effective tool for
compressing k-mers. To assess the performance
of our tool, USTAR2, we conducted a comparative
evaluations against several other existing tools, in-
cluding UST (Rahman and Medvedev, 2020), US-
TAR (Rossignolo and Comin, 2023), Matchtigs and
Greedy Matchtigs (Schmidt et al., 2023).
To conduct our assessments, we employed a col-
lection of real read datasets that were sourced from
prior studies (Pandey et al., 2018b; Rizk et al., 2013;
Kokot et al., 2017; Chikhi et al., 2016; B
ˇ
rinda et al.,
2021) and a summary of these datasets is provided
in Table 1. For each dataset, we extracted all k-mers
for different values of k, see Table 5 in the Appendix.
This information served as the input for all the com-
pression tools under evaluation. It’s important to note
that all tools require the preliminary construction of a
compacted de Bruijn graph (dBG) using BCALM2 as
a preprocessing step.
All our test are executed on a server equipped with
Intel(R) Xeon(R) Platinum 8260 CPU @ 2.40GHz
and 100GB of RAM. We run USTAR2 using the de-
fault value of the parameter D that is set to 7, whereas
all other tools do not need any parameter.
In the first experiment, we ran UST, USTAR, US-
TAR2, Greedy Matchtigs and Matchtigs using the
k-mer sets of all datasets with k = 21. The com-
plete results are presented in Table 2. In this Table
are reported the cumulative length (CL) of the se-
quences computed with each tool. We were able to
run Matchtigs only for the smaller datasets in terms
of number of k − mers, since for the bigger ones it
gave out-of-memory errors, meaning that 100GB of
RAM were not sufficient to run the program. This
was expected, because also the authors of Matchtigs
(Schmidt et al., 2023) reported the problem. For this
reason we included in the analysis also the greedy ver-
sion of Matchtigs.
Excluding Matchtigs that use an exact algorithm,
USTAR2 consistently outperformed all other tools on
average, achieving the most compact representations
for all datasets and approaching the optimum.
We can observe that the tools based on simplitigs,
UST and USTAR, cannot compress the k-mers effi-
ciently. Whereas, USTAR2 and Greedy Matchtigs,
that are based on the SPSS, where k-mers can be
reused, they obtain much better results in terms of CL.
Among the competitors, Greedy Matchtigs emerges
as the top performer, especially when considering
the memory requirements, where Matchtigs cannot be
run.
To evaluate the compression quality, we employed
two distinct metrics: CL (Cumulative Length), as de-
fined in Section 2.2, which assesses quality prior to
k-mer compression; and compression, referring to the
file size of k-mers string representation after com-
pression using the dedicated compressor MFCom-
press(Pinho and Pratas, 2014).
In the next experiment, we compare the resulting
file sizes after compression. The compression results
are presented in Table 6 in the Appendix. It’s worth
noting that Matchtigs couldn’t be executed on several
datasets due to out-of-memory errors. Additionally,
dataset SRR5853087 1 caused a crash in MFCom-
press. On average, Greedy Matchtigs prove to be the
most effective compressors, closely followed by US-
TAR2, with USTAR and UST far behind.
The k-mer length is an important parameter in
many bioinformatics applications that use k-mers. In
several applications (Wood and Salzberg, 2014; Sun
and Medvedev, 2019; Marcolin et al., 2022; Andreace
et al., 2021), k = 31 is the most used value as a trade-
off between capturing sequence context and minimiz-
ing computational resources required for the analy-
sis. Thus we examined the behaviour of CL and
compression when varying the k-mer sets, for dif-
ferent lengths k ∈ {15, 21, 31, 41}. The average CL
and compression results are reported in Tables 3 and
4 respectively. In these experiments, we excluded
Matchtigs from the analysis because it can be run only
on a small fraction of the datasets.
Among the various k-mer sizes, USTAR2 con-
sistently achieved the best CL for all sizes except
when k = 15, while it excelled in achieving the
best compression for k = 31 and k = 41. In con-
trast, UST and USTAR consistently performed sig-
nificantly poorer compared to other competitors, ex-
hibiting more than a 50% drop in compression per-
formance in some instances. This comparative anal-
ysis further solidifies the superiority of USTAR2 and
Greedy Matchtigs over UST and USTAR in terms of
both CL and compression metrics. If we consider
k = 31, that is the most widely used value of k, we
can conclude that USTAR2 achieved the best CL and
compression w.r.t. the other tools.
3.1 Time and Memory Usage
In the previous section we have observed that the
two best compression algorithms are USTAR2 and
BIOINFORMATICS 2024 - 15th International Conference on Bioinformatics Models, Methods and Algorithms
374

Table 2: Datasets (with k = 21) are processed with UST, USTAR, USTAR2, Greedy Matchtigs and Matchtigs. For each tool,
the cumulative length is reported. Note that only four dataset are processed with Matchtigs while the others gave out-of-
memory errors. The average CL over all experiments is reported in the last row.
K=21
Cumulative Length
UST USTAR USTAR2 Greedy Matchtigs Matchtigs
SRR001665 1 36,357,928 36,324,848 33,638,588 33,858,376 33,380,903
SRR001665 2 45,751,142 45,694,102 41,864,643 42,201,273 41,478,989
SRR061958 1 623,862,618 191,039,506 178,434,526 179,301,460
SRR061958 2 767,654,838 211,459,109 198,026,097 198,820,674
SRR062379 1 252,418,995 248,519,235 226,998,129 228,491,551
SRR062379 2 246,073,774 241,478,754 220,352,087 221,708,614
SRR10260779 1 188,012,488 184,854,088 170,629,253 171,477,677
SRR10260779 2 214,245,523 210,202,663 192,382,255 193,409,534
SRR11458718 1 189,827,141 185,070,581 170,218,475 171,003,884
SRR11458718 2 202,891,014 196,865,834 179,815,285 180,632,752
SRR13605073 1 86,006,020 84,974,720 81,822,046 81,970,005
SRR14005143 1 19,355,339 19,020,479 17,477,215 17,546,167 17,376,011
SRR14005143 2 42,328,593 41,492,693 37,213,243 37,481,708 36,908,792
SRR332538 1 18,649,027 18,382,747 17,615,333 17,688,889
SRR332538 2 49,648,910 46,689,430 41,053,913 41,226,736
SRR341725 1 245,548,134 243,816,714 236,221,721 236,557,911
SRR341725 2 258,344,641 256,477,401 247,741,588 248,138,629
SRR5853087 1 587,246,289 551,618,109 484,650,727 486,008,368
SRR957915 1 377,292,074 366,210,794 325,707,476 327,968,686
SRR957915 2 579,294,390 562,058,930 501,809,029 505,129,713
average 251,540,444 197,112,537 180,183,581 181,031,130
Table 3: Average CL over all datasets varying k ∈ {15, 21, 31, 41} for the tools UST, USTAR, USTAR2 and Greedy Matchtigs.
Cumulative Length
K UST USTAR USTAR2 Greedy Matchtigs
15 389,526,197 225,048,269 122,088,205 118,257,100
21 251,540,444 197,112,537 180,183,581 181,031,130
31 296,999,909 293,947,184 217,688,497 218,851,662
41 366,686,084 364,249,733 269,841,393 271,412,813
Table 4: Average compression over all datasets varying k ∈ {15, 21, 31, 41} for the tools UST, USTAR, USTAR2 and Greedy
Matchtigs.
Compression
K UST USTAR USTAR2 Greedy Matchtigs
15 114,627,914 69,954,835 30,659,296 29,313,703
21 75,103,512 71,860,009 42,115,904 41,890,264
31 68,297,756 68,585,282 49,427,296 49,672,063
41 70,445,678 71,874,051 50,595,570 51,137,503
Greedy Matchtigs. However, Greedy Matchtigs is
based on the exact algorithm of Matchtigs and for this
reason it might not be too efficient from the compu-
tational perspective. For this reason, we conducted
an in-depth analysis of their time and memory usage.
The current implementation of USTAR2 is not paral-
lelized, whereas Greedy Matchtigs is multi-threading.
At first we compared the two tools in their single-
thread settings. Considering the above experiments,
we also compute the average time and memory con-
sumption, over all datasets, while varying the k-mer
size. The average computing times are reported in
Figure 2 and the memory requirements in Figure 3.
In general, we can note a peak in both time and
memory usage when k = 15, because for small values
of k the de Bruijn graph is dense. However, when
USTAR2: Fast and Succinct Representation of k-mer Sets Using De Bruijn Graphs
375
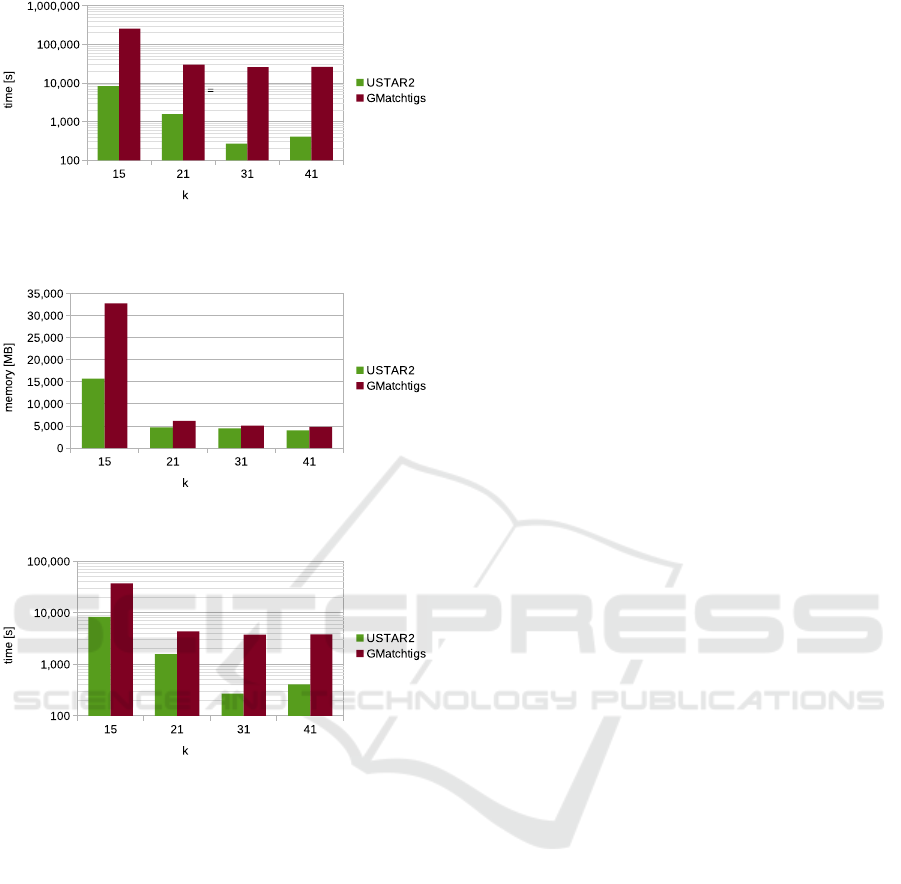
Figure 2: Average time in seconds used by USTAR2
(single-thread) and Greedy Matchtigs (single-thread) for
different k.
Figure 3: Average memory in megabyte used by USTAR2
and Greedy Matchtigs for different k.
Figure 4: Average time in seconds used by USTAR2
(single-thread) and Greedy Matchtigs (multi-thread) with
different k.
considering the computing time, USTAR2 exhibits
a decreasing trend as k increases, while for Greedy
Matchtigs, we observe a plateau after k = 21. On
the other hand, memory requirements decrease with
larger values of k for both tools.
Comparing the two tools, it is evident that
USTAR2 is more resource-efficient than Greedy
Matchtigs. Specifically, for k = 15, USTAR2 is 30
times faster than Greedy Matchtigs and its memory
usage is less than half. If we consider k = 31, that
is the most widely used value, USTAR2 is 96 times
faster w.r.t. Greedy Matchtigs.
Since Greedy Matchtigs can be run in multi-
threading, but USTAR2 cannot, we want to test if
the parallelization can help the time performance of
Greedy Matchtigs. This comparison is reported in the
Appendix in Figure 4. If we run Greedy Matchtigs
using 16 threads, we observed a decrease in the com-
putation time w.r.t. to the single-thread version. How-
ever, even with 16 threads, Greedy Matchtigs is much
slower than USTAR2. For k = 31, the most used
value, USTAR2 (single-thread) is still 15 times faster
than Greedy Matchtigs (16-threads).
In summary we can conclude that USTAR2
achieved the best performance in terms of compres-
sion and it is also resource efficient. The current
implementation of USTAR2 can also be further en-
hanced through the application of parallelization tech-
niques.
4 CONCLUSIONS
In this paper, we introduce USTAR2 a software tool
designed for the compression of sets of k-mers. Our
approach involves tackling a path cover problem on
a de Bruijn graph, to discover an optimal repre-
sentation of the k-mer set, that minimizes the cu-
mulative length of the compressed data. Making
well-informed choices rooted in node connectivity,
including the careful reuse of previously traversed
nodes, we have attained compression ratios that
outperform established tools such as UST(Rahman
and Medvedev, 2020) and USTAR(Rossignolo and
Comin, 2023). Additionally, USTAR2 proves to
be more efficient on k-mer set representation w.r.t.
Greedy Matchtigs(Schmidt et al., 2023), both in terms
of Cumulative Length and compression, for various
values of k.
We conducted a comprehensive performance as-
sessment of USTAR2 across a variety of datasets
and performed a comparative analysis with alterna-
tive tools, including Matchtigs and Greedy Matchtigs.
The results demonstrate the superiority of our ap-
proach, consistently surpassing Greedy Matchtigs in
terms of both time and memory utilization.
The execution time of USTAR2 exhibits a remark-
able speed up w.r.t. the other tools, and it is up to
96 times faster than Greedy Matchtigs and it requires
also less memory.
In conclusion, USTAR2 offers an effective and
resource-efficient solution for compressing k-mer
sets. The fact that USTAR2 currently operates as a
single thread raises the hope that its parallelization
could further enhanced the performance.
ACKNOWLEDGEMENTS
Authors are supported by the National Recovery and
Resilience Plan (NRRP), National Biodiversity Fu-
ture Center - NBFC, NextGenerationEU.
BIOINFORMATICS 2024 - 15th International Conference on Bioinformatics Models, Methods and Algorithms
376

REFERENCES
Andreace, F., Pizzi, C., and Comin, M. (2021). Metaprob 2:
Metagenomic reads binning based on assembly using
minimizers and k-mers statistics. Journal of Compu-
tational Biology, 28(11):1052–1062.
Bankevich, A., Nurk, S., Antipov, D., Gurevich, A. A.,
Dvorkin, M., Kulikov, A. S., Lesin, V. M., Nikolenko,
S. I., Pham, S., Prjibelski, A. D., et al. (2012). Spades:
a new genome assembly algorithm and its applications
to single-cell sequencing. Journal of computational
biology, 19(5):455–477.
Bradley, P., Den Bakker, H. C., Rocha, E. P., McVean, G.,
and Iqbal, Z. (2019). Ultrafast search of all deposited
bacterial and viral genomic data. Nature biotechnol-
ogy, 37(2):152–159.
B
ˇ
rinda, K., Baym, M., and Kucherov, G. (2021). Simplitigs
as an efficient and scalable representation of de bruijn
graphs. Genome biology, 22(1):1–24.
Cavattoni, M. and Comin, M. (2023). Classgraph: Im-
proving metagenomic read classification with over-
lap graphs. Journal of Computational Biology,
30(6):633–647. PMID: 37023405.
Chikhi, R., Holub, J., and Medvedev, P. (2021). Data struc-
tures to represent a set of k-long dna sequences. ACM
Computing Surveys (CSUR), 54(1):1–22.
Chikhi, R., Limasset, A., and Medvedev, P. (2016). Com-
pacting de bruijn graphs from sequencing data quickly
and in low memory. Bioinformatics, 32(12):i201–
i208.
Conway, T. C. and Bromage, A. J. (2011). Succinct data
structures for assembling large genomes. Bioinfor-
matics, 27(4):479–486.
Denti, L., Previtali, M., Bernardini, G., Sch
¨
onhuth, A., and
Bonizzoni, P. (2019). Malva: genotyping by mapping-
free allele detection of known variants. Iscience,
18:20–27.
Dufresne, Y., Lemane, T., Marijon, P., Peterlongo, P., Rah-
man, A., Kokot, M., Medvedev, P., Deorowicz, S., and
Chikhi, R. (2022). The K-mer File Format: a stan-
dardized and compact disk representation of sets of
k-mers. Bioinformatics, 38(18):4423–4425.
Harris, R. S. and Medvedev, P. (2020). Improved repre-
sentation of sequence bloom trees. Bioinformatics,
36(3):721–727.
Holley, G. and Melsted, P. (2020). Bifrost: highly parallel
construction and indexing of colored and compacted
de bruijn graphs. Genome biology, 21:249.
Khan, J., Kokot, M., Deorowicz, S., and Patro, R. (2022).
Scalable, ultra-fast, and low-memory construction of
compacted de bruijn graphs with cuttlefish 2. Genome
Biology, 23:190.
Kokot, M., Długosz, M., and Deorowicz, S. (2017). Kmc 3:
counting and manipulating k-mer statistics. Bioinfor-
matics, 33(17):2759–2761.
Li, H. and Durbin, R. (2009). Fast and accurate short read
alignment with Burrows–Wheeler transform. Bioin-
formatics, 25(14):1754–1760.
Marchet, C., Iqbal, Z., Gautheret, D., Salson, M., and
Chikhi, R. (2020). Reindeer: efficient indexing of k-
mer presence and abundance in sequencing datasets.
Bioinformatics, 36(Supplement
1):i177–i185.
Marcolin, M., Andreace, F., and Comin, M. (2022). Effi-
cient k-mer indexing with application to mapping-free
SNP genotyping. In Lorenz, R., Fred, A. L. N., and
Gamboa, H., editors, Proceedings of the 15th Inter-
national Joint Conference on Biomedical Engineering
Systems and Technologies, BIOSTEC 2022, Volume 3:
BIOINFORMATICS, February 9-11, 2022, pages 62–
70.
Monsu, M. and Comin, M. (2021). Fast alignment of
reads to a variation graph with application to snp
detection. Journal of Integrative Bioinformatics,
18(4):20210032.
Ondov, B. D., Treangen, T. J., Melsted, P., Mallonee, A. B.,
Bergman, N. H., Koren, S., and Phillippy, A. M.
(2016). Mash: fast genome and metagenome distance
estimation using minhash. Genome biology, 17(1):1–
14.
Pandey, P., Almodaresi, F., Bender, M. A., Ferdman, M.,
Johnson, R., and Patro, R. (2018a). Mantis: a fast,
small, and exact large-scale sequence-search index.
Cell systems, 7(2):201–207.
Pandey, P., Bender, M. A., Johnson, R., and Patro, R.
(2018b). Squeakr: an exact and approximate k-mer
counting system. Bioinformatics, 34(4):568–575.
Pinho, A. J. and Pratas, D. (2014). Mfcompress: a compres-
sion tool for fasta and multi-fasta data. Bioinformat-
ics, 30(1):117–118.
Qian, J. and Comin, M. (2019). Metacon: Unsupervised
clustering of metagenomic contigs with probabilistic
k-mers statistics and coverage. BMC Bioinformatics,
20(367).
Rahman, A. and Medvedev, P. (2020). Representation of k-
mer sets using spectrum-preserving string sets. In In-
ternational Conference on Research in Computational
Molecular Biology, pages 152–168. Springer.
Rizk, G., Lavenier, D., and Chikhi, R. (2013). Dsk: k-mer
counting with very low memory usage. Bioinformat-
ics, 29(5):652–653.
Rossignolo, E. and Comin, M. (2023). Ustar: Improved
compression of k-mer sets with counters using de
bruijn graphs. In Guo, X., Mangul, S., Patterson,
M., and Zelikovsky, A., editors, Bioinformatics Re-
search and Applications, pages 202–213, Singapore.
Springer Nature Singapore.
Schmidt, S. and Alanko, J. N. (2023). Eulertigs: min-
imum plain text representation of k-mer sets with-
out repetitions in linear time. Research square, page
rs.3.rs—2581995.
Schmidt, S., Khan, S., Alanko, J. N., Pibiri, G. E., and
Tomescu, A. I. (2023). Matchtigs: Minimum plain
text representation of k-mer sets. Genome Biology
(Online), 24.
Storato, D. and Comin, M. (2022). K2mem: Discover-
ing discriminative k-mers from sequencing data for
metagenomic reads classification. IEEE/ACM Trans-
actions on Computational Biology and Bioinformat-
ics, 19(1):220–229.
USTAR2: Fast and Succinct Representation of k-mer Sets Using De Bruijn Graphs
377

Sun, C., Harris, R. S., Chikhi, R., and Medvedev, P. (2018).
Allsome sequence bloom trees. Journal of Computa-
tional Biology, 25(5):467–479.
Sun, C. and Medvedev, P. (2019). Toward fast and accurate
snp genotyping from whole genome sequencing data
for bedside diagnostics. Bioinformatics, 35(3):415–
420.
Wood, D. E. and Salzberg, S. L. (2014). Kraken: ultra-
fast metagenomic sequence classification using exact
alignments. Genome biology, 15(3):1–12.
APPENDIX
Table 5: Number of k-mers for each dataset varying k ∈ {15, 17, 21, 31, 41}.
dataset #15-mers #21-mers #31-mers #41-mers
SRR001665 1 13,889,837 14,286,068 10,343,472 -
SRR001665 2 16,371,558 16,895,362 12,058,109 -
SRR061958 1 225,788,025 388,490,798 404,149,685 392,492,657
SRR061958 2 265,935,616 482,235,278 495,804,915 475,405,235
SRR062379 1 109,810,585 152,875,155 160,692,477 160,746,342
SRR062379 2 108,958,432 151,987,994 159,905,793 158,802,318
SRR10260779 1 84,250,397 113,667,728 123,624,245 127,090,699
SRR10260779 2 93,032,179 128,074,943 139,633,894 143,150,103
SRR11458718 1 89,998,269 126,431,861 137,995,280 143,397,012
SRR11458718 2 94,018,791 134,997,414 150,549,990 159,144,668
SRR13605073 1 43,488,336 54,085,000 55,764,573 54,682,553
SRR14005143 1 11,307,338 13,223,059 15,005,192 16,272,583
SRR14005143 2 23,691,810 28,456,533 31,850,681 33,872,511
SRR332538 1 10,624,064 11,404,027 11,382,816 10,666,430
SRR332538 2 18,741,106 25,674,930 28,880,136 27,477,871
SRR341725 1 132,442,790 188,913,254 185,618,107 176,391,089
SRR341725 2 136,484,353 196,035,961 192,133,588 181,970,438
SRR5853087 1 159,744,051 316,438,109 382,773,071 399,026,650
SRR957915 1 126,236,121 208,110,514 239,200,400 250,988,377
SRR957915 2 188,867,779 335,926,750 364,597,018 361,352,380
Table 6: k-Mers (with k = 21) file size after compression with MFCompress. Dataset SRR5853087 1 gave a compression
error. Many Matchtigs cannot be computed due to out-of-memory errors.
K=21
compression
UST USTAR USTAR2 Greedy Matchtigs Matchtigs
SRR001665 1 12,641,658 12,332,551 8,728,852 8,813,736 8,845,254
SRR001665 2 15,492,263 15,109,673 10,915,321 11,003,600 10,876,474
SRR061958 1 194,173,905 185,905,825 45,510,962 45,454,536
SRR061958 2 235,657,588 225,975,765 50,801,622 50,486,848
SRR062379 1 82,713,766 79,283,723 59,070,721 58,566,163
SRR062379 2 80,164,746 76,708,406 57,036,189 56,882,630
SRR10260779 1 64,644,700 61,724,139 43,373,952 43,311,649
SRR10260779 2 72,772,294 69,375,320 49,077,343 48,574,622
SRR11458718 1 64,694,925 61,236,404 42,840,309 42,645,409
SRR11458718 2 68,982,466 65,438,050 45,077,154 44,708,191
SRR13605073 1 25,833,347 24,546,244 20,149,898 20,144,454
SRR14005143 1 6,419,520 6,220,215 4,222,948 4,179,654 4,194,213
SRR14005143 2 13,117,896 12,655,430 9,056,375 8,932,076 8,980,170
SRR332538 1 5,737,778 5,599,034 4,393,161 4,393,504
SRR332538 2 14,410,775 13,528,977 9,930,431 9,712,821
SRR341725 1 80,436,678 78,193,253 60,766,288 61,160,751
SRR341725 2 84,250,689 81,877,574 63,879,557 64,009,811
SRR5853087 1
SRR957915 1 122,748,678 116,872,195 83,947,935 82,631,218
SRR957915 2 182,073,051 172,757,385 131,423,152 130,303,345
average 75,103,512 71,860,009 42,115,904 41,890,264
BIOINFORMATICS 2024 - 15th International Conference on Bioinformatics Models, Methods and Algorithms
378
