
Predicting Major Donor Prospects Using Machine Learning
Greg Lee, Aishwarya Vaishali Sathyamurthi
a
and Mark Hobbs
Jodrey School of Computer Science, Acadia University, Wolfville, Canada
Keywords:
Fundraising Institutions, Major Donors, Machine Learning.
Abstract:
An important concern for many fundraising institutions is major gift fundraising. Major gifts are large gifts
(typically $10,000+) and donors who give these gifts are called major donors. Depending upon the institution
type, major gifts can constitute 80% of donation dollars. Thus, being able to predict who will give a major gift
is crucial for fundraising institutions. We sought the most useful major donor prospect model by experimenting
with 11 shallow and deep learning algorithms. A useful model discovers major donor prospects (i.e., false
positives) without generating a similar number of false negatives, helping to preserve accuracy. The study also
examined the impact of using different types of data, such as donation data exclusively, on the model’s utility.
Notably, an LSTM-GRU model achieved a 92.2% accuracy rate with 110 false positive prospects and 40 false
negatives for a religious fundraising institution. This model could assist major donor officers in identifying
potential major donors. Similarly, for an education fundraising institution, an extra trees classifier was able to
generate a major donor model with 92.5% accuracy, 71 false positives and 40 false negatives. False positives
are prospects for fundraising institutions, providing major gift officers potential major donors.
1 INTRODUCTION
Fundraising institutions rely on major gifts for a sig-
nificant portion of their budget. University founda-
tions in particular receive about 80% of their donation
dollars from major gifts (Gift’s, 2021). The thresh-
old for a major gift varies by fundraising institution,
but typically ranges from $10,000 to $50,000. While
these are typical minimum thresholds, major gifts can
be in the range of millions of dollars.
Major donors are donors who have either given a
gift that meets the fundraising institution’s major giv-
ing threshold or who have an official pledge to do so
with the fundraising institution. Since these donations
can be 500x to 50000x larger than the average dona-
tion to a fundraising institution, fundraising institu-
tions spend much more time with each potential ma-
jor donor than non-major donors in order to increase
the likelihood of a gift. Thus, having a precise list of
likely major donors is critical for a fundraising insti-
tution’s success. The aim of the research presented in
this paper is to predict potential major donors. Ma-
jor donors are important because their gifts make up
a large chunk of the organisations overall fundrais-
ing revenue. It is crucial to prioritize the relationships
with them. Major donors are more inclined to give to
a
https://orcid.org/0009-0007-7107-1569
fundraising institutions that have a dedicated steward-
ship strategy to cultivate their relationships (Market-
ing, 2021).
An important distinction in the search for major
donors is the need for prospects, which amount to
false positives in the output of the model. These
prospects would be correctly classified as negative ex-
amples, since they have not yet given a major gift, but
a model that correctly classifies all negative examples
is of no use to a fundraising institution or its major
gift officers. On the other hand, false negatives are in
no way desirable as they amount to a model classi-
fying major donors as non major donors, which they
cannot be, since they have already given a major gift.
Thus, what is sought from a major gift model is an im-
perfect model (i.e., a model with some accuracy loss)
where more/most of the errors are false positives. We
thus created a metric called the False Positive Nega-
tive (FPN) ratio which we use in our empirical evalu-
ation to choose the best learners for various fundrais-
ing institutions. It is calculated as FP/FN. This is
similar to cost-sensitive learning, but more directly
models the relationship between (desirable) false pos-
itives and (undesirable) false negatives.
462
Lee, G., Sathyamurthi, A. and Hobbs, M.
Predicting Major Donor Prospects Using Machine Learning.
DOI: 10.5220/0012422700003636
Paper published under CC license (CC BY-NC-ND 4.0)
In Proceedings of the 16th International Conference on Agents and Artificial Intelligence (ICAART 2024) - Volume 2, pages 462-470
ISBN: 978-989-758-680-4; ISSN: 2184-433X
Proceedings Copyright © 2024 by SCITEPRESS – Science and Technology Publications, Lda.

2 RELATED RESEARCH
Most of the past research done predicting donor giv-
ing behavior makes use of linear techniques. Con-
nolly and Blanchette (1986) (Michael S. Connolly,
1986) used discriminant analysis, and Gerlinda Mel-
chiori (1988) (Melchiori, 1988) used classification
analysis to predict donor behavior, both of which are
types of linear regression. These techniques are in-
appropriate when the object is to predict rare events
(such as giving over $10,000) or when the dependent
variable has an upper or lower bound and there are a
large number of individuals at the bound (as with giv-
ing, where there are numerous individuals with zero
giving).
Brittingham and Pezzullo note that certain current
characteristics of alumni were found to be predictors
for major gift giving in some studies, but not oth-
ers (Brittingham and Pezzullo, 1990). Income, age,
number of degrees from the institution, emotional at-
tachment to the school, participation in alumni events,
and participation in and donation to other voluntary
and religious groups were found to be predictors.
Wesley and Christopher (1992) used logit analy-
sis in 1992 to predict the individuals who would give
higher (e.g., $100,000) or lower ($1,000) donations
based on the data from the alumni database as well as
the geo-demographic information (Winship and Lin-
dahl., 1992). Their result showed that 92% of the
dollars could be collected with 36.5% prospects se-
lected in the annual fund model. Later with their up-
graded model (1994) (Lindahl and Winship, 1994),
a slightly better performance was achieved for major
gift prediction. In this research, the test results using
deep learning models showed accurate results when
using large data sets for certain fundraising institu-
tions, compared to some shallow learning models as
described in empirical studies.
3 PROBLEM FORMULATION
The business problem at hand is to generate a ranked
list of constituents who have never given a major gift
as prospects, so that MGOs
1
can focus their time and
effort on them. To do so, we solve the problem of de-
termining which machine learning algorithm can best
learn to distinguish between major donors and non-
1
Fundraising institutions employ major gift officers
(MGOs) to seek out and ‘convert’ major donor prospects.
These MGOs can spend years developing a relationship
with potential major donors and thus the decision con-
cerning with whom to begin a relationship is an important
one (Gift’s, 2021).
major donors and then use that algorithm to predict
future major donors.
The process of securing a major gift generally
takes over a year, and involves several touch points
from the MGO. Typically, an MGO meets in person
with a major gift candidate on several occasions be-
fore a gift can be secured. This differs from non-
major gifts where there is generally just one touch -
an email, phone, or direct mail solicitation. Fundrais-
ing institutions must be aware of their cost per dol-
lar raised, so when an MGO spends fundraising in-
stitution money and time on a prospect, the prospect
must have the potential to give a large gift. Thus,
it is imperative that the model ordering the major
donor prospects be accurate, since so much time (and
money) will be spent with each prospect.
The data used in the experiments is provided
anonymously by Anonymous, an Anonymous-based
company whose objective is to help non-profit orga-
nizations raise more money by focusing on turning
one-time donors into lifetime supporters. Anonymous
works with organizations such as universities and dis-
ease related fundraising institutions. They create per-
sonalized emails and develop donor profiles based on
their interaction with the software. This approach
generates a huge amount of data, which is provided to
machine learning algorithms to help achieve the ob-
jective of this research.
The major donor data generated by Anonymous
is based on constituent interaction with fundraising
institutions. For our experiments, we collected data
from 8 fundraising institutions as shown in the Ta-
ble 1.
Table 1: Data sets from 8 fundraising institutions from 3
verticals (disease, education, religious).
Representation Type of FI’s
AlzF Alzheimer’s FI
CF Cancer FI
EF-1 Educational FI 2
EF-2 Educational FI 2
EF-3 Educational FI 3
EF-4 Educational FI 4
RF-1 Religious FI 1
RF-2 Religious FI 2
These data sets have far fewer major donors than
non-major donors as seen in Table 2. This means
the major donor data is heavily skewed towards non-
major donors and must be balanced before training a
model (Lee et al., ). Note that fundraising institutions
EF-1, EF-2, EF-4 and RF-1 had significantly more
major donors than the other 4 fundraising institutions
and we focus our attention on these. We examine the
Predicting Major Donor Prospects Using Machine Learning
463

results for AlzF, CF, EF-3 and RF-2 in Experiment 5.
Table 2: Number of samples of each type in each data set.
Major Donors Non-Major Donors
AlzF 46 90859
CF 82 52123
EF-1 2080 104677
EF-2 4393 76155
EF-3 658 54121
EF-4 3226 211519
RF-1 1856 64843
RF-2 309 101459
Fundraising institutions gather data on their con-
stituents for tax purposes. This information includes
the constituent’s address, as well as the donation
amount and date. As data analysis and machine learn-
ing technologies become more common, fundraising
institutions have recognized the value of data and be-
gun to collect more data to help differentiate between
constituents. This data can be broken down roughly
into the following categories:
3.1 Demographic Data
Demographic data include age, gender, income, and
job title, but most fundraising institutions do not keep
track of these values for many constituents. Instead,
address information can be used to infer some of this
information, and the method of request is recorded to
determine which solicitation methods and modes of
communication are acceptable to a constituent.
3.2 Donation Data
Donation data is recorded by fundraising institutions
to track revenue. Donation dates and amounts can
aid machine learning algorithms, but they do not di-
rectly provide trend data to them. As a result of these
two simple features, we create new donation features
such as number of donations by phone appeal, small-
est gift, and variance.
3.3 Educational Data
University foundations benefit from a more in-depth
understanding of their constituents’ activities while
they were students. These foundations use club mem-
berships, degree numbers, and graduation dates to de-
termine what materials to send to their alumni, and
machine learning can use these features as well.
3.4 Behavioural Data
The interactions of constituents with a given fundrais-
ing institution are frequently not recorded by the
fundraising institution, but they can be an indicator of
future giving. Whether a constituent attends events,
volunteers, opens emails, or watches fundraising in-
stitution videos, computers can learn how much affin-
ity a constituent has for a fundraising institution.
4 DATA PREPARATION
We feed the data in the form of comma separated
value (CSV) files to machine learning models whose
dimension along the X-axis is the number of con-
stituents and the dimension along the Y-axis is the
number of features.
There are two different datasets fed to the machine
learning model, major donors (data which has ma-
jor donations made by constituents) and non-major
donors (data where no major donations are made by
constituents). The non-major donors data have more
samples (negatives) compared to major donor data
(positives) which makes the data unbalanced.
As the data in Table 2 are unbalanced, we balance
the data of major donors and non-major donors and
then split into train (70%) and test (30%) to feed to the
machine learning algorithm and calculate the accu-
racy and FPN ratio. We oversample the major donors
dataset and balance using the following approach.
We have oversampled the minority class us-
ing synthetic minority oversampling technique
(SMOTE). We define a SMOTE instance with default
parameters that will balance the minority class and
then fit and apply it in one step to create a trans-
formed version of the dataset. Once transformed, we
summarize the class distribution of the new trans-
formed dataset, which would be balanced through the
creation of new synthetic examples in the minority
class.
4.1 Dealing with Missing Values in
Dataset
Most statistical modeling is unable to handle missing
values and may produce unpredictable results. In this
research, all the null values are replaced with zero be-
cause with neural networks, it is safe to input miss-
ing values as zero, with the condition that zero is not
already a meaningful value. The network will learn
from exposure to the data that the value zero means
missing data and will start ignoring the value.
ICAART 2024 - 16th International Conference on Agents and Artificial Intelligence
464

4.2 Handling Categorical Data
Categorical data is also known as nominal and ordi-
nal data. Some features, such as “title” (e.g., “Ms”)
are nominal and thus need to be transformed for most
machine learning algorithms. We use one-hot encod-
ing and create a new feature for every value of each
nominal feature, with exactly one of these newly cre-
ated features having value 1 for each parent feature,
and the rest of the values being 0.
4.3 Handling Giveaway Features
Giveaway features for major giving include maximum
donation, average donation, intercept, slope, total do-
nations and standard deviation of gifts, since values of
these that are larger than the major giving threshold
for a fundraising institution can immediately reveal to
a model who the major donors are, and thus create
a perfect, yet useless, model, since no false positives
will occur and thus prospects are found. We remove
giveaway features from the data in order to build use-
ful models.
5 THEORY AND APPROACH
We used 11 machine learning algorithms in order to
try to accurately model major giving, so that we can
feed a model a constituent and get an accurate idea
of whether that constituent is likely to give a major
gift. In this section, we briefly describe the algorithms
used that produced usable results, and the setup of our
empirical work.
We compared various machine learning and deep
learning techniques and evaluated the mean accuracy
for each of them by a stratified K-fold cross-validation
to prevent overfitting. In this basic approach, K-fold
CV, the training set is split into k smaller sets:
1. The model is trained using the K-1 folds as train-
ing data.
2. The last fold is used to compute the model perfor-
mance.
5.1 Gaussian Naive Bayes
Naive Bayes classifiers are a group of supervised ma-
chine learning classification algorithms based on the
Bayes theorem. It is a simple classification technique,
but has high functionality (Majumder, 2021). Com-
plex classification problems can also be implemented
by using Naive Bayes Classifier. When working with
continuous data, an assumption often taken is that the
continuous values associated with each class are dis-
tributed according to a normal (or Gaussian) distribu-
tion. The likelihood of the features is assumed to be:
P(x
i
| y) =
1
q
2πσ
2
y
exp
−
(x
i
− µ
y
)
2
2σ
2
y
!
(1)
Sometimes assume variance is independent of Y
(i.e., σi), or independent of Xi (i.e., σk) or both (i.e.,
σ(z))
5.2 Decision Trees
Decision trees are fundamentally recursive, the algo-
rithm learns through repetition (Khan, 2021). The al-
gorithms attempts different splits and determines the
split that achieves the correct classification as many
times as possible. The root node is selected based on
the attribute selection measure (ASM) and is repeated
until there is a leaf node (cannot split anymore). ASM
is a technique used in data mining processes for data
reduction. The two main ASM techniques are Gini In-
dex and Information Gain (ID3). The ID3 algorithm
builds decision trees using a top-down greedy search
approach through the space of possible branches with
no backtracking. The steps in ID3 algorithm are as
follows:
1. It begins with the original set S as the root node.
2. On each iteration of the algorithm, it iterates
through the very unused attribute of the set S and
calculates Entropy(H) and Information Gain (IG)
of this attribute.
3. It then selects the attribute which has the smallest
entropy or largest information gain.
4. The set S is then split by the selected attribute to
produce a subset of the data.
5. The algorithm continues to recur on each subset,
considering only attributes never selected before.
5.3 Random Forest Classifier
A random forest is a collection of decision trees
whose results are aggregated into one final result.
They limit overfitting without substantially increasing
error due to bias. It is also one of the most used algo-
rithms, because of its simplicity and diversity (it can
be used for both classification and regression tasks).
A random forest has nearly the same hyperparameters
as a decision tree or a bagging classifier. With random
forest, we can also deal with regression tasks by us-
ing the algorithm’s regressor. Random forest adds ad-
ditional randomness to the model, while growing the
Predicting Major Donor Prospects Using Machine Learning
465

trees. Instead of searching for the most important fea-
ture while splitting a node, it searches for the best fea-
ture among a random subset of features. We can also
make trees more random by additionally using ran-
dom thresholds for each feature rather than searching
for the best possible thresholds (like a normal deci-
sion tree does).
5.4 Extra Trees Classifier
An extra trees classifier also known as extremely ran-
domized trees is an ensemble machine learning algo-
rithm that combines predictions from many decision
trees. It is related to random forests. It uses a simpler
algorithm to construct the decision trees than random
forests do to use as members of the ensemble.
5.5 Adaboost Classifier
Adaboost or Adaptive Boosting is one of ensem-
ble boosting classifier proposed by Yoav Freund and
Robert Schapire in 1996 (Navlani, 2018). It is a
meta-estimator that begins by fitting a classifier on the
original dataset and then fits additional copies of the
classifier on the same dataset but where the weights
of incorrectly classified instances are adjusted such
that subsequent classifiers focus more on difficult
cases. The basic concept behind Adaboost is to set the
weights of classifiers and training the data sample in
each iteration such that it ensures the accurate predic-
tions of unusual observations. Any machine learning
algorithm can be used as a base classifier if it accepts
weights on individual training examples. Adaboost
should meet two conditions:
1. The classifier should be trained interactively on
various weighed training examples.
2. In each iteration, it tries to provide an excellent fit
for these examples by minimizing training error.
5.6 Convolutional Neural Networks
Convolutional neural networks (CNNs) are a spe-
cialized type of neural network model designed for
working with two-dimensional image data, although
they can be used with one-dimensional and three-
dimensional data.
CNNs have the same functionality irrespective of
their dimensionality. The only difference is the struc-
ture of the input data and how the filter, also known as
convolutional kernel or feature detector, moves across
the data. Each layer of CNNs (Figure 1) conduct dif-
ferent tasks.
Convolutional Layer: It has two key parameters.
One is the kernel size, and the other is the number of
Figure 1: Convolutional neural networks(Saha, 2018).
filters. The layer first divides the input into fixed-size
patches that are the same size in all filters.
Pooling Layer: It reduces the size of a feature
map. Once the feature maps from previous convo-
lutional layer enter a pooling layer, the network di-
vides the input feature map into a fixed number of re-
gions (determined by the pool size) and summarises
the value in each region into a single maximum or av-
erage value.
Dense Layer: It is also known as fully connected
layer and is the last part of the network. Follow-
ing completion of all convolutional-pooling computa-
tions, the network arranges the values of final feature
maps in a row.
5.7 Recurrent Neural Networks (RNNs)
Standard neural networks do not have memory to
store what they learn. RNNs have a unique archi-
tecture that enables data to persist and models short
term dependencies. So, RNN are neural networks that
are designed for the effective handling of sequential
data but are also useful for non-sequential data (Seker,
2020).
5.8 Gated Recurrent Unit (GRU)
A Gated Recurrent Unit is a type of Recurrent Neu-
ral Network that addresses the issue of long term de-
pendencies which can lead to vanishing gradients. To
solve the vanishing gradient problem of a standard
RNN, GRU uses an update gate and reset gate. GRUs
store “memory” from the previous time point to help
inform the network for future predictions (Kostadi-
nov, 2017).
5.9 Recurrent Neural Networks
Standard neural networks such as feed forward neu-
ral networks do not have memory to store what they
learn. For every iteration, the network starts fresh as
it does not remember the data in the previous itera-
tion while processing the current set of data, which
ICAART 2024 - 16th International Conference on Agents and Artificial Intelligence
466
is a disadvantage when identifying correlations and
data patterns. This is where recurrent neural networks
(RNNs) come into picture. RNNs have a unique
architecture that enables data to persist and models
short term dependencies. So, RNN are neural net-
works that are designed for the effective handling of
sequential data but are also useful for non-sequential
data (Seker, 2020).
5.10 Gated Recurrent Unit
Gated Recurrent Unit is a type of Recurrent Neural
Network that addresses the issue of long term depen-
dencies which can lead to vanishing gradients larger
vanilla RNN networks experience. To solve the van-
ishing gradient problem of a standard RNN, GRU
uses update gate and reset gate. These are two vectors
which decide what information should be passed to
the output. GRUs address this issue by storing “mem-
ory” from the previous time point to help inform the
network for future predictions (Kostadinov, 2017).
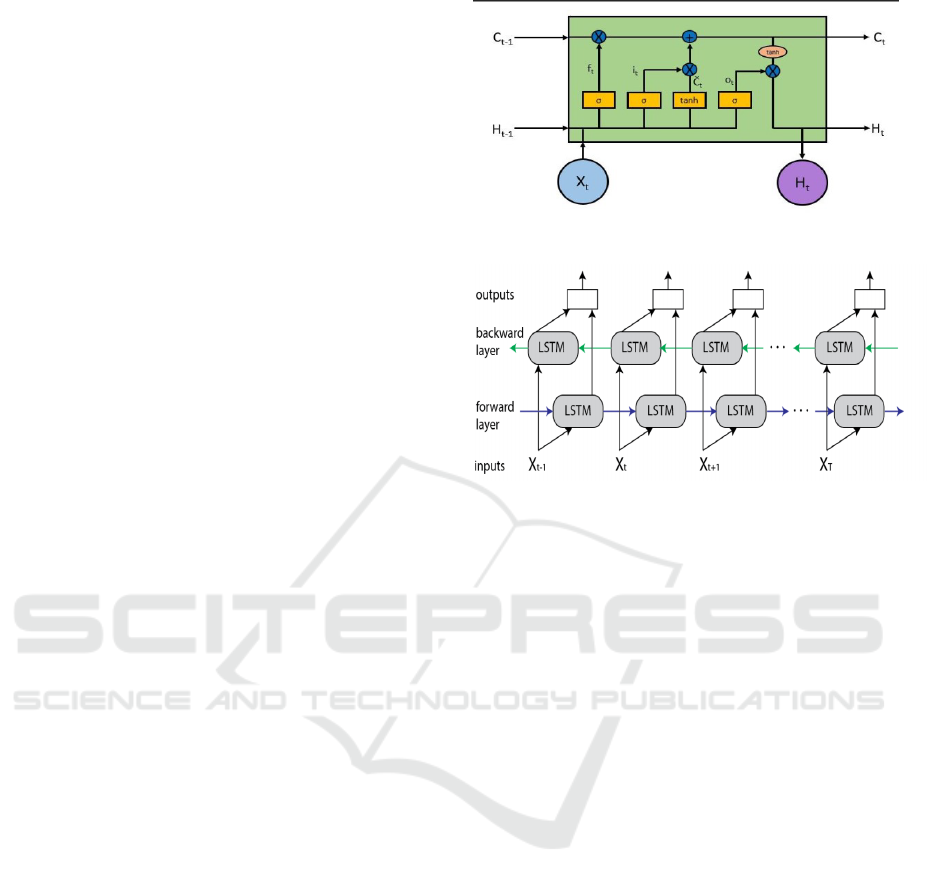
5.11 Long Short-Term Memory
Networks
Long Short-Term Memory networks (LSTMs) is a
type of RNNs, which are capable of learning long-
term dependencies and they work effectively on a
large variety of problems. LSTMs remember infor-
mation for a long period of time and are designed
explicitly to solve long-term problems. LSTMs have
similar structure though the internals have different
components when compared to a single tanh (activa-
tion) layer in RNN. The four layers in the architecture
interact with each other. The cell state C allows infor-
mation to flow through the entire LSTM unchanged,
which enables the LSTM to remember context for a
long period of time (See Figure 2). The horizon-
tal line has several inputs and outputs which is con-
trolled by gates that allows information to be added
to or removed from the cell state. The sigmoid lay-
ers output numbers between 0 and 1, describing how
much should be let through from each component. An
LSTM has three of these gates to control the cell state:
Forget gate, input gate and output gate.
5.12 Bi-Directional Long Short-Term
Memory Networks
A Bi-directional LSTM, or BDLSTM, is a sequence
processing model that consists of two LSTMs: one
taking the input in a forward direction, and the other
in a backwards direction. BDLSTMs effectively in-
Figure 2: Long Short-term Memory(blog, 2015).
Figure 3: Bi-directional long short-term memory (Alhamid,
2021).
crease the amount of information available to the net-
work, improving the context available to the algo-
rithm. BDLSTM adds one more LSTM layer, which
reverses the direction of information flow. It means
that the input sequence flows backward in the addi-
tional LSTM layer. Then it combines the outputs from
both LSTM layers in several ways, such as average,
sum, multiplication, or concatenation (Figure 3).
6 EMPIRICAL EVALUATION
The initial experiments were carried out on balanced
datasets using random forest classifiers, Adaboost,
extra trees classifiers, Gaussian na
¨
ıve-Bayes, decision
trees and logistic regression to see how well shallow
machine learning models can predict potential major
donors, Non-major donors (negative cases) outnum-
ber major donors (positive cases) for all fundraising
institutions as seen in Table 2. Data was balanced
in all experiments in order to not bias the model to-
wards negative cases. Testing data was kept separate
from training data and all results shown are on testing
data. We used accuracy and the False Positive Neg-
ative (FPN) ratio as metrics to evaluate our models.
To be included in the presented results, models must
have had an FPN of at least 1 (at least as many false
positives as false negatives) and an accuracy above
80%. When more than one model met these criteria
for a fundraising institution, the model with the higher
Predicting Major Donor Prospects Using Machine Learning
467

FPN was presented. There were some exceptions to
this rule where there were no FPNs >= 1 or no accu-
racies above 80% among the models that were used.
6.1 Experiment 1: Predicting Prospects
Using Shallow Models
The goal of this experiment was to demonstrate shal-
low learning models’ ability to predict major donor
prospects for fundraising institutions (FIs). We exper-
imented with 6 different ML models for 4 fundraising
institutions in order to accurately predict future ma-
jor donor prospects. Based on the accuracy and FPN
values, the best performing models are shown in Ta-
ble 3. For each of the fundraising institutions with a
significant number of major donors, there is a shallow
learner that is able to provide an accurate model (of
at least 82%) with at least as many FPs as FNs (an
FPN > 1). While AdaBoost generally provides the
most accurate models with FPN ratios above 1, de-
cision trees and extra tree classifiers sometimes have
similar performance.
Table 3: Best shallow learners for Experiment 1.
Learner FI Accuracy STD FP FN FPN
ExtraTrees EF-1 92.52 0.117 71 40 1.78
AdaBoost EF-2 91.83 0.045 87 86 1.01
AdaBoost EF-4 88.94 0.110 44 31 1.42
AdaBoost RF-1 81.95 0.135 134 67 2.00
6.2 Experiment 2: Predicting Prospects
Using Deep Learning
This experiment’s objective is to improve the FPN
while maintaining similar accuracies to Experiment 1
using deep learning techniques. Table 4 shows results
for 4 fundraising institutions (FIs) using deep learn-
ing algorithms. For EF-1 and EF-2, there is a drop in
accuracy, although EF-2 has a 65% rise in FPN. For
RF-1, there is an increase in both the accuracy of the
learner and the FPN, showing that deep learning helps
for that particular fundraising institutions.
Table 4: Best deep learners for Experiment 2.
Learner FI Accuracy STD FP FN FPN
BDLSTM-GRU-TDL EF-1 87.27 0.014 113 76 1.49
RNN EF-2 80.80 0.031 254 153 1.66
GRU EF-4 91.00 0.008 50 48 1.04
LSTM-GRU RF-1 92.19 0.012 110 40 2.75
6.3 Experiment 3: Predicting Prospects
Using Only Donation Data
This experiment’s objective is to input only donation
data to deep learning models and remove the behav-
ioral data, educational data, demographic data and
giveaway features to observe the effect for 4 fundrais-
ing institutions (FIs) to predict future major donors.
The data we used for this experiment is the dona-
tion data used in Experiment 6.1 (Table 1). Table 5
shows the best deep learners using only donation data.
LSTM-GRU is the most useful learner in this exper-
iment, showing an improvement or holding steady
over Experiment 2 in terms of both accuracy and FPN
ratio. We include LSTM-GRU for RF-1 here to show
that while BDLSTM-CNN was better in terms of ac-
curacy and FPN ratio, the difference is minimal and
that LSTM-GRU is generally the best choice of algo-
rithm when using only donation data.
Table 5: Best deep learners for Experiment 3.
Learner FI Accuracy STD FP FN FPN
LSTM-GRU EF-1 85.65 0.016 143 70 2.04
LSTM-GRU EF-2 85.75 0.008 216 86 2.51
LSTM-GRU EF-4 94.00 0.016 123 111 1.10
BDLSTM-CNN RF-1 94.34 0.019 32 31 1.03
LSTM-GRU RF-1 94.25 0.017 31 33 0.94
6.4 Experiment 4: Predicting Prospects
Using Only Donation and
Behavioural Data
This experiments objective is to input only donation
and behavioral data to deep learning models and re-
move educational data, demographic data and give-
away features to observe the effect for 4 fundraising
institutions (FIs) to predict future major donors. The
data we used for this experiment is the same dona-
tion and behavioural data used in experiment 6.1 (Ta-
ble 1). Table 6 shows the results. Accuracies drop
compared to Experiment 3, which is surprising given
that behavioural data is included here and is not in-
cluded in Experiment 3. False positive numbers in-
creasing is the explanation for this accuracy drop, and
if a fundraising institution is seeking more prospects
and willing to sacrifice some accuracy, using both do-
nation and behavioural data may be the best decision.
Note that we again include LSTM-GRU here for RF-
1 to show it’s FPN of 8 with an accuracy comparable
to RNN.
ICAART 2024 - 16th International Conference on Agents and Artificial Intelligence
468

Table 6: Best deep learners for Experiment 4.
Learner FI Accuracy STD FP FN FPN
RNN EF-1 77.23 0.096 205 133 1.54
LSTM-GRU EF-2 80.18 0.133 252 168 1.5
GRU EF-4 88.02 0.027 116 102 1.13
RNN RF-1 90.21 0.034 84 25 3.36
LSTM-GRU RF-1 89.49 0.029 104 13 8
6.5 Experiment 5: Predicting Prospects
for Smaller Fundraising Institutions
While fundraising institutions AlzF, CF, EF-3 and RF-
2 have only 46, 82, 658, and 309 major donors each,
they do represent much of the charitable sector that
does not have a large amount of data on major donors.
We present the best learners for these fundraising in-
stitutions (FIs) in Table 7. Note that all results are
using all data available. While the results are more
difficult to trust given the smaller number of false pos-
itives and false negatives, they do follow the same pat-
tern as those in Experiments 1-4 and should provide
smaller fundraising institutions with some confidence
that these methods will help them find major donor
prospects.
Table 7: Best learners for smaller fundraising institutions.
Learner FI Accuracy STD FP FN FPN
GRU AlzF 88.00 0.015 6 2 3
Random Forest CF 94.11 0.162 2 1 2
RNN EF-3 85.56 0.016 33 21 1.57
BDLSTM-CNN RF-2 96.54 0.057 9 7 1.29
7 DISCUSSION AND FUTURE
WORK
1. Based on Experiments 1-5, shallow ML models
such as AdaBoost and Random Forest and deep
learning models, such as LSTM-GRU, BDLSTM-
GRU-TDL, BDLSTM-CNN, GRU, and RNN can
be used to accurately predict major donors for a
fundraising institution, with an FPN ratio above 1.
We summarize the best learners for each fundrais-
ing institution in Table 8.
2. The LSTM-GRU algorithm is the most consis-
tent across all fundraising institutions, in terms
of accuracy and FPN. While they are not the best
model for all data sets, the models produced are
among the best models.
3. Gaussian na
¨
ıve-Bayes, Logistic Regression and
basic Decision Trees rarely produced models of
the same quality as other shallow models (such as
Table 8: Best ML model for each fundraising institution,
using accuracy and FPN.
Models Data set ML Model AccuracyFPN
AlzF All features GRU 88.00 3
CF All features Random Forest 94.11 2
EF-1 All features Extra trees 92.52 1.78
EF-2 Donation LSTM-GRU 85.75 2.51
EF-3 All features RNN 85.56 1.57
EF-4 Donation BDLSTM 94.00 1.10
-CNN
RF-1 Donation + RNN 90.21 3.36
Behavioural
RF-2 All features BDLSTM 96.54 1.29
-GRU-TDL
random forests, extra trees or AdaBoost) or deep
models.
4. For most models, eliminating data did increase
both false positives and false negatives (and thus
decrease accuracy), but as was seen in Table 5,
LSTM-GRU models actually improve or stay the
same with less data. This shows that perhaps de-
mographic, education, and behavioural data can
be noisy and that donation data provides a clearer
signal to LSTM-GRU models.
The current research can be advanced by taking
the following ways:
1. Using wealth indicators which are publicly avail-
able data points about donors that provide insights
into their income and wealth status. Wealth in-
dicators can tell which of the prospects are fi-
nancially capable of making a major gift and the
likely size of that gift.
2. It will be interesting to explore other models such
as univariate chi-square methods for features se-
lection. The SMOTE upsampling method that
perturbs some of the features during upsampling
could be implemented and compared with the cur-
rent results.
3. Deep ANNs could be used to develop a regres-
sion model for predicting how much money major
donor constituents would actually contribute.
REFERENCES
Alhamid, M. (2021). Bidirectional lstm. https://
towardsdatascience.com/tagged/bidirectional-lstm.
blog, C. (2015). Understanding lstm networks.
https://colah.github.io/posts/2015-08-Understanding-
LSTMs/.
Brittingham, B. E. and Pezzullo, T. R. (1990). Fund
raising in higher education / barbara e. brittingham
Predicting Major Donor Prospects Using Machine Learning
469

and thomas r. pezzullo. https://catalogue.nla.gov.au/
Record/5520361.
Gift’s, M. (2021). Donor search. https://www.donorsearch.
net/major-gifts-guide/.
Khan, S. (2021). Data science explained: Deci-
sion trees. https://www.godatadrive.com/blog/data-
science-for-business-leaders-decision-trees.
Kostadinov, S. (2017). Understanding gru networks.
https://towardsdatascience.com/understanding-gru-
networks-2ef37df6c9be.
Lee, G., Raghavan, A. K. V., and Hobbs, M. Machine learn-
ing the donor journey. In Goutte, C. and Zhu, X., ed-
itors, Advances in Artificial Intelligence - 33rd Cana-
dian Conference on Artificial Intelligence, Canadian
AI 2020, Ottawa, ON, Canada, May 13-15, 2020, Pro-
ceedings.
Lindahl, W. and Winship, C. (1994). A logit model with
interactions for predicting major gifts doonors. Re-
search in Higher Education, 35(6):729–743.
Majumder, P. (2021). Gaussian naive bayes. https://iq.
opengenus.org/gaussian-naive-bayes/.
Marketing, N. (2021). Major donor fundraising: Effec-
tive strategies for 2022. https://www.donorsearch.net/
major-donor-fundraising/.
Melchiori, G. S. (1988). Alumni research: An introduc-
tion. https://onlinelibrary.wiley.com/doi/abs/10.1002/
ir.37019886003.
Michael S. Connolly, R. B. (1986). Understanding and pre-
dicting alumni giving behavior. https://onlinelibrary.
wiley.com/doi/abs/10.1002/ir.37019865107.
Navlani, A. (2018). Adaboost classifier in python.
https://www.datacamp.com/community/tutorials/
adaboost-classifier-python.
Saha, S. (2018). A comprehensive guide to convolutional
neural networks. https://towardsdatascience.com/a-
comprehensive-guide-to-convolutional-neural-
networks-the-eli5-way-3bd2b1164a53.
Seker, E. (2020). Recurrent neural networks and lstm
explained. https://purnasaigudikandula.medium.
com/recurrent-neural-networks-and-lstm-explained-
7f51c7f6bbb9.
Winship, C. and Lindahl., W. E. (1992.). Predictive mod-
els for annual fundraising and major gift fundraising.
Nonprofit Management and Leadership.
ICAART 2024 - 16th International Conference on Agents and Artificial Intelligence
470
