
AI-Based Recognition of Sketched Class Diagrams
Thomas Buchmann
1
and Jonas Fraas
2
1
Faculty of Computer Science, Deggendorf Institute of Technology, Dieter-G
¨
orlitz-Platz 1, 94469 Deggendorf, Germany
2
Chair of Applied Computer Science I, University of Bayreuth, Universit
¨
atsstrasse 30, 95440 Bayreuth, Germany
Keywords:
Model-Driven Development, Machine Learning, Class Diagrams, Sketching.
Abstract:
Class diagrams are at the core of object oriented modeling. They are the foundation of model-driven software
engineering and backed up by a wide range of supporting tools. In most cases, source code may be gener-
ated from class diagrams which results in increasing productivity of developers. In this paper we present an
approach that allows the automatic conversion of hand-drawn sketches of class diagrams into corresponding
UML models and thus can help to speed up the development process significantly.
1 INTRODUCTION
Model-driven software engineering (V
¨
olter et al.,
2006) is a discipline which has become more and
more important during the last few years. It puts
strong emphasis on the development of higher-level
models rather than on source code. Over the years,
UML (OMG, 2017) has been established as the stan-
dard modeling language for model-driven develop-
ment. The basic idea behind UML is providing a stan-
dardized modeling language for the Model-Driven Ar-
chitecture (MDA) (Mellor et al., 2002) approach prop-
agated by the Object Management Group (OMG).
A wide variety of different tools exist, which sup-
port the modeler during the development process.
Since model-driven software development is not tied
to a special software development methodology, these
tools usually can be used with any development pro-
cess.
When talking about model-driven software de-
velopment, most people instantly think of class dia-
grams. For a reason: They are the foundation of ob-
ject oriented modeling and serve as a basis for gener-
ating source code from respective models.
While the usage of class diagrams has become
ubiquitous nowadays, the editing experience of re-
spective diagrams highly depends on the accompany-
ing editors. In most cases, these are graphical editors
that allow the creation and editing of class diagrams
using mouse and keyboard as input devices.
In most development processes, but in agile pro-
cesses in particular, sketches or drafts of diagrams
drawn on paper are often used for communication
purposes.
However, sketches drawn on paper or whiteboard
have to be distributed to all involved team members,
e.g. by scanning or photographing the result. This
raises several problems. While in source code based
approaches, where diagrams are only used for doc-
umentation purposes, a photograph of a whiteboard
sketch might be enough, model-driven approaches de-
mand for models as first class entities. Thus, every di-
agram that has been sketched on a whiteboard or on a
piece of paper has to be redone in the respective mod-
eling tool, which results in an additional overhead.
Furthermore, sketches on whiteboards or papers are
often done in an informal or semi-formal way. E.g.
they often are missing some essential details like role
names or cardinalities of associations. Usually these
errors are resolved at a later time, when the sketch is
redone with the respective modeling tool.
In this paper we show our approach to use ma-
chine learning and concepts from computer vision to
automatically transform sketches of class diagrams
into respective UML models.
The paper is structured as follows: In Section 2
we discuss related work. Subsequently we motivate
our work presented in this paper in section 3. Section
4 gives insights into our chosen approach followed by
an evaluation in Section 5. The paper is concluded in
Section 6.
Buchmann, T. and Fraas, J.
AI-Based Recognition of Sketched Class Diagrams.
DOI: 10.5220/0012421900003645
Paper published under CC license (CC BY-NC-ND 4.0)
In Proceedings of the 12th International Conference on Model-Based Software and Systems Engineering (MODELSWARD 2024), pages 227-234
ISBN: 978-989-758-682-8; ISSN: 2184-4348
Proceedings Copyright © 2024 by SCITEPRESS – Science and Technology Publications, Lda.
227

2 RELATED WORK
Research in the field of machine learning (ML) and
artificial neuronal networks (ANN) became increas-
ingly popular over the last few years. However, there
is still only a limited number of projects which ad-
dress the use of machine learning in the context of
software engineering. This holds in particular for
the analysis of (handwritten) UML diagrams. In the
following section we give an overview about related
work in this context.
In (Gosala et al., 2021) the following binary clas-
sification problem is studied: For a given image the
network should decide whether it contains a UML
class diagram or not. A classifier solving this problem
may have several applications. In different phases of
the software development process, different types of
diagrams are used, including class diagrams. An au-
tomated analysis of diagrams defined for a project al-
lows for a quantification of the use of class diagrams
for a given phase in the development process. Fur-
thermore, the classifier may be used to automatically
build a collection of class diagrams generated from
images taken from the internet. These diagrams may
serve as examples for novice developers.
A classifier is introduced in (Gosala et al., 2021),
which is able to solve the aforementioned classifica-
tion problem and which evaluates the results on a test
set. The classifier is based on a CNN (convolutional
neural network). A type of ANN which is popular for
image related classification tasks. It consists of four
convolutional layers and two fully connected layers as
output layers.
The problem of offline recognition of handwrit-
ten diagrams – i. e. having no additional information
about how the text was created by the writer – is de-
scribed in (Sch
¨
afer et al., 2021). The tool introduced
in the paper is based on a sophisticated ANN (called
Arrow R-CNN in the paper) and allows for being used
for a large number of different diagram types due to
its generic approach. It is not limited to a certain dia-
gram type, e. g. class diagrams, but it requires a large
number of classified training data for each type of di-
agram. The tool consists of two different parts: In
the first part, a ANN is used to detect and classify the
different shapes that are contained in the image. In a
second processing step, these shapes are passed to a
diagram-specific algorithm which produces a digital
representation of the diagram.
The Arrow R-CNN network consists of three com-
ponents: A CNN which is used for feature extraction
of the images. The result is then fed into an ANN,
called a Region Proposal Network, which is used to
calculate a large number of Regions of Interest (RoIs.
Each RoI consists of a feature map which is passed to
a ANN consisting of fully connected layers. For each
RoI a corresponding class is determined, which yields
the respective type of model element.
3 ARCHITECTURE
This section describes the architecture of our tool.
We employ techniques from computer vision to de-
tect the classes, their features and relationships be-
tween classes. Details of the implementation of these
steps are discussed in 4. Apart from classical algo-
rithms and concepts from the field of computer vi-
sion, two classifiers based on ANNs, that detect the
hand-written text and numbers and cardinality sym-
bols used for association ends respectively, were im-
plemented. Therefore, we present a short overview of
their specifics in the following paragraphs.
3.1 Classifier for Detecting Multiplicity
Symbols and Numbers
There are already many approaches that tackle the
problem of recognizing hand-written numbers. In
particular broad research was done for the classifica-
tion problem based on the MNIST data set. Results
listed in (LeCun et al., ) reveal that classifiers using
ANNs achieve the best results, especially when CNNs
are used in the first step for feature extraction. Conse-
quently, our classifier follows this approach. We use
a data set containing hand-written numbers. These
are written in the european style contrary to those of
the american-style MNIST dataset
1
. Furthermore, the
dataset is augmented with images of the hand-written
* symbol used for representing unbounded multiplic-
ity in UML. This data set is referred to as ESHWD
(european-style hand-written digits) in the remainder
of this paper.
3.1.1 Preprocessing
We use a 28x28 pixel sized binary image of a sym-
bol or a number as an input for the neural network.
In order to meet this precondition, the images taken
from the ESHWD data set need to undergo several
preprocessing steps: (1) The grey-scale images are
binarized, before (2) artefacts are removed. Since the
line width of the numbers is usually not large enough,
it is enhanced (3) using dilation. In order to meet the
size requirements, each image is (4) resized to 18x18
pixels, and 5 black pixels are added in each direction
1
https://github.com/kensanata/numbers
MODELSWARD 2024 - 12th International Conference on Model-Based Software and Systems Engineering
228
and dimension as padding. (5) Finally, the grey val-
ues, which are now either 0 or 255, are normalized,
i. e. mapped onto the range [−0.5, 0.5].
3.1.2 Architecture
The ANN consists of a sequence of three blocks with
similar structure. They are used to extract features
from the image with an increasing level of abstrac-
tion. Each of the blocks consists of three connected
layers and a boolean neuron in the last layer in order
to normalize the output values. We use a Squeeze and
Excitation Block as described in (Hu et al., ) which
receives its input from the last connected layer. Using
this structure improves the performance of the CNN
significantly without having a major impact on com-
putation times during training.
3.1.3 Training
The network is trained by using 80% of the data set as
training data and the remaining ones as test data. We
used a batch size of 32. Moreover, we use the API
for test data augmentation provided by Tensorflow to
artificially increase the size of the training data set and
to make the classifier more robust.
3.2 Classifier for Handwritten Text
Recognition
The classifier used for realizing handwritten text
recognition (HTR) was trained using the IAM data
set
2
. The input is a grey scale image of a handwrit-
ten word. It has a fixed width (W) and height (H).
The output is a sequence with a maximum length L
consisting of characters. We set L=32 for the imple-
mentation of the classifier. Detecting text at the level
of characters allows for recognizing words, which are
not part of the training data set. The characters are
taken from a set C of characters which are contained
in the training data set.
We used an ANN to realize the classifier. A CNN
consisting of multiple layers is used for feature ex-
traction on the input image. Afterwards, a recurrent
neural network (RNN) calculates an output sequence
with 32 time steps. Finally, a special layer called
Connectionist Temporal Classification (CTC) is used.
During training this layer serves to compute the value
of a loss function which is to be optimized. During
classification it decodes the output of the RNN into a
sequence of characters taken from C which it deems
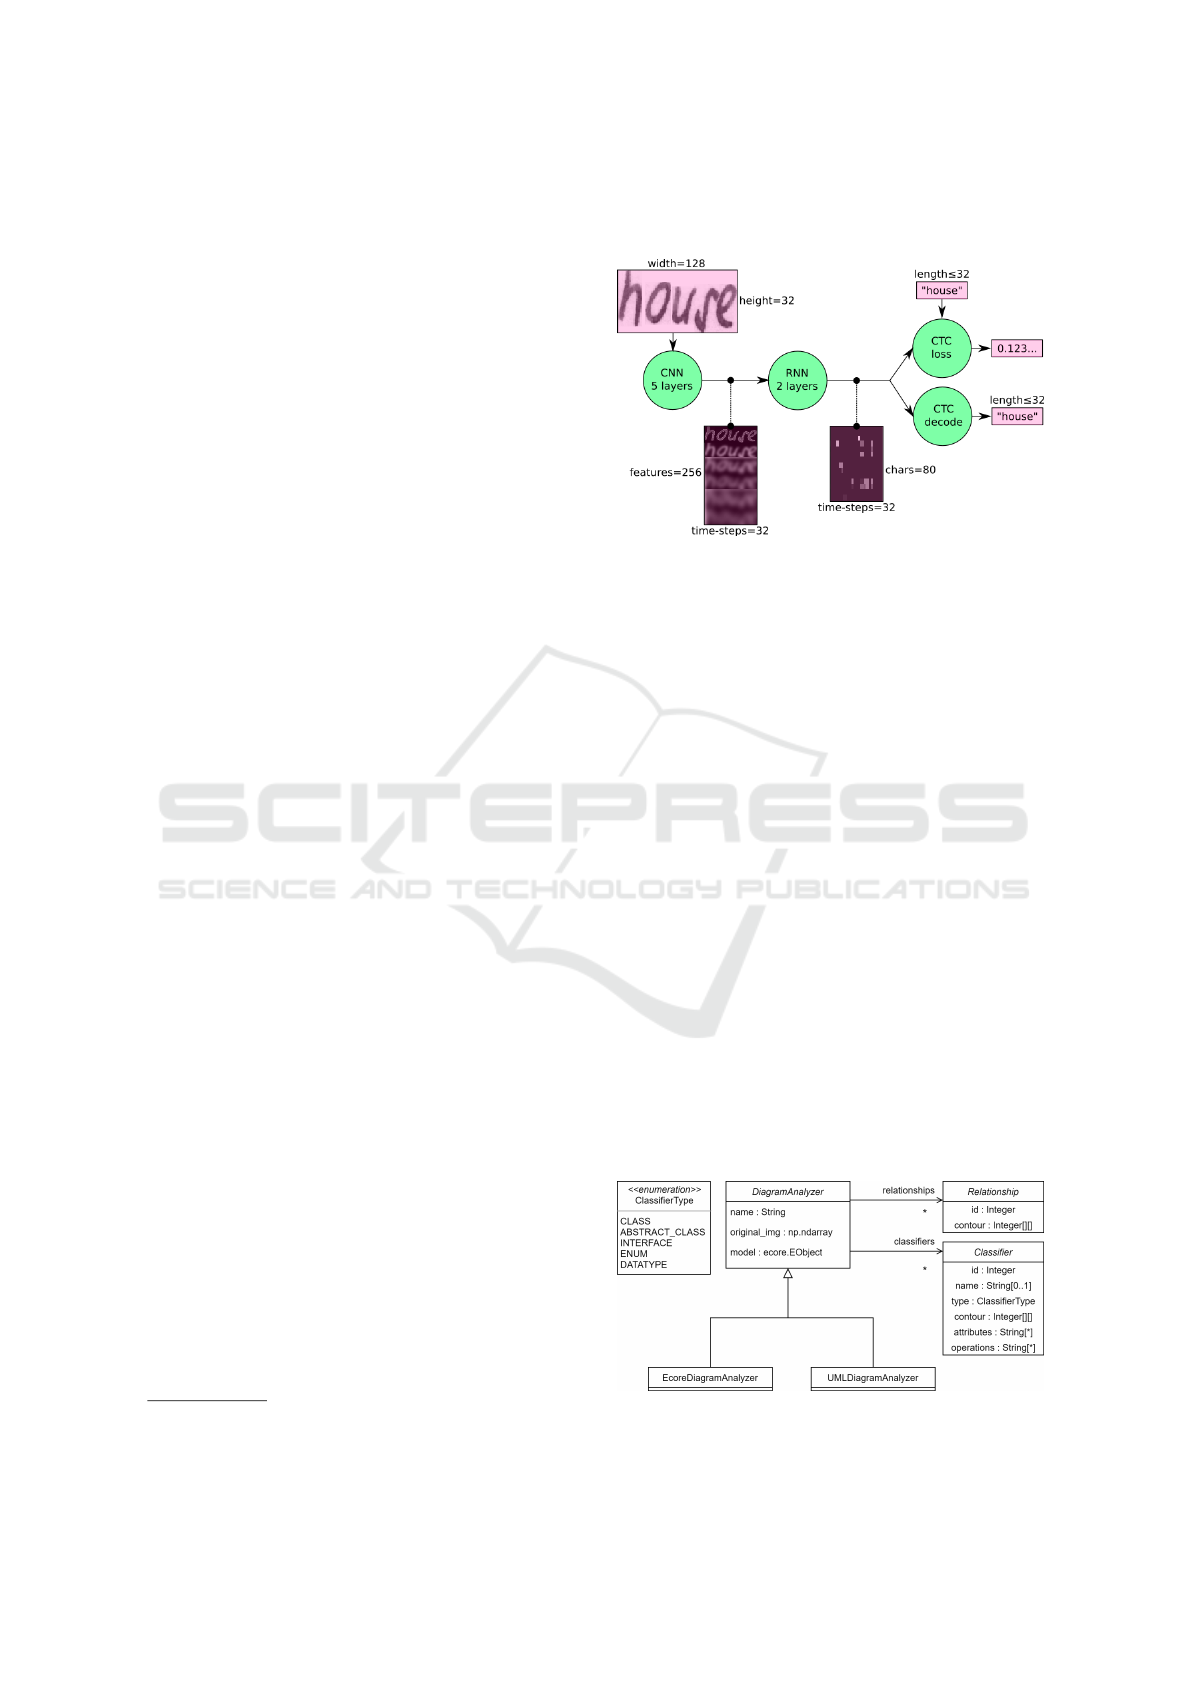
most likely based on the state of the RNN. Figure 1
2
https://fki.tic.heia-fr.ch/databases/iam-handwriting-
database
depicts an overview of the architecture including in-
termediate outputs.
Figure 1: Overview of the architecture depicting inputs and
outputs of the respective layers.
3.2.1 Architecture
As shown in Figure 1, the first CNN consists of 5
layers and is used to extract features from the input
image. The output is then processed by a RNN con-
sisting of two layers. The popular Long Short-Term
Memory (LSTM) type of RNN is used for both lay-
ers. One layer considers results of previous time steps
for computing the output of a neuron, the other one
results from future time steps. This stems from the
fact, that recognizing a character of a word depends
on the context of the surrounding characters in both
directions. Finally the CTC decodes characters from
the result of the RNN.
3.3 Modular Approach
The tool has been designed with modularity and ex-
tensibility in mind. In its current state, two differ-
ent modes for transforming a handwritten class dia-
gram are implemented: (1) creating an Ecore model
(Steinberg et al., ) and (2) creating an UML model, al-
though only the most frequently used model elements
are supported (OMG, 2017).
Figure 2: Tool architecture.
AI-Based Recognition of Sketched Class Diagrams
229

Figure 2 depicts the two imple-
mented variants represented by respective
subclasses EcoreDiagramAnalyzer and
UMLDiagramAnalyzer. A data model is used
for the important elements contained in class dia-
grams, using classifiers and their relationships. This
model is used to save information about the graphical
representation, e.g. coordinates of the outline of clas-
sifiers within the diagram or end points of lines which
depict relationships between classifiers. Furthermore
names and types of classifiers are stored which are
required later when the final model is constructed.
4 IMPLEMENTATION
In this Section, we briefly describe the steps that are
required in order to transform a handwritten diagram
into a model. These steps are roughly the following
(1) Detect the classifiers (2) Segment the sub blocks
of each classifier (3) Identify the type and name of
each classifier (4) Detect between which classifiers
relationships exist (5) Classify the type of each re-
lationship (6) Detect the name and multiplicity for
each of the ends of the identified associations (7) De-
tect structural features of attributes, i. e. attributes (8)
Construct the output model based on all previously
collected information.
The developed prototype is written completely in
Python. For most of the tasks in steps (1) - (7) al-
gorithms from the field of computer vision are em-
ployed. For their implementation the library OpenCV
was chosen. The classifiers which are described in
the previous section are applied in steps (3), (6) and
(7) and were implemented using the frameworks Ten-
sorflow and Keras, two well-known machine learning
frameworks for Python.
4.1 Detecting Classifiers
Classifiers are represented by rectangular blocks in
the class diagram. Hand-drawn classdiagrams, espe-
cially when resulting from freehand sketching, con-
tain irregular blocks consisting of uneven lines of dif-
ferent length. All of those problems have to be con-
sidered accordingly. After a series of preprocessing
steps and applying different filters for denoising the
original image, the connected components are com-
puted.
The floodfill algorithm is used in the next step to
fill all closed structures in the image. Afterwards,
all rectangles representing UML classifiers are filled
completely. The resulting image is now the input for
edge extraction. For each edge, different criteria are
evaluated in order to check if it represents a classifier
or not.
In the next step, the rectangles have to be seg-
mented in sub-rectangles, as a classifier may have up
to three compartments in a UML class diagram. To
this end, the original classifier is cut from the origi-
nal image. The bounding box is calculated and the
area, which is enlarged by a few pixel in each direc-
tion is cut from the original image. The respective re-
gion is converted into a binary image and the resulting
conversion artefacts are removed. The horizontal and
vertical structures of the binary image are extracted in
order to determine the contours of the image.
We assume, that the block containing the name
of the classifier consists at most of two lines of text,
where one line contains the identifier and the other
one additional information about the type (by using a
stereotype). Before being able to perform a segmenta-
tion of the text in the name block, it has to be cut from
the original image using the largest interior rectangle
method. The image that has been cut out is trans-
formed into a grey scale image before the contained
text is segmented. We use the IAM dataset (Marti and
Bunke, 2002) to detect words and characters in the
image.
4.2 Detecting Relationships
In a first step, we determine the classifiers which are
involved in relations. In the current state of our proto-
type, reflexive relations can not be detected yet. Fur-
thermore, we only support binary associations and no
association classes. A relation is a solid line in con-
crete syntax, whose ends may contain different deco-
rators, indicating different types of relationships.
We start with a binarized version of the binary im-
age and remove all detected classifiers from the im-
age. Afterwards, artefacts are removed and the image
is segmented. The contours of the image are calcu-
lated and a hierarchy of contours is established. Each
contours on the highest level are candidates for lines
representing relationships. Child contours indicate
that the corresponding relationship has an association
end. In the next step the start end end points of the
line are determined and the classifiers involved in the
relationship are identified.
The type of a relationship depends on its ends and
the respective information needs to be extracted from
the hand-drawn class diagram. To this end, the con-
tours calculated in the previous step are required.
In a final step, additional information as multiplic-
ities of association ends is determined.
MODELSWARD 2024 - 12th International Conference on Model-Based Software and Systems Engineering
230

4.3 Detecting Structural Features of
Classifiers
Classifiers in a UML class diagram may comprise
structural features like properties and operations. In
its current state, our tool only supports the detec-
tion of properties (attributes). In the following we
describe the algorithm used for detecting attributes,
which are specified in a textual notation using the fol-
lowing form: <identifier> : <typename>.
In a first step, the respective block representing
the attribute compartment in the classifier is cut from
the original image. This is also done according to the
largest interior rectangle method. A segmentation al-
gorithm is applied to the resulting image and the text
is recognized using the IAM dataset.
4.4 Generating the Output Model
After the tool performed a complete analysis of the
image, and all relevant information has been ex-
tracted, an output model is generated. We support
two different modes for generating output models: (1)
UML mode and (2) Ecore mode. In the following,
we focus on the description of generating an Ecore
model.
In a first step, classifiers are transformed into in-
stances of EClass. If the classifier is annotated with
<<interface>> or <<abstract>> in the class dia-
gram, the respective properties of the EClass are set.
In a second step, superclasses are identified and
set accordingly in the output model. This is done
based on the information extracted from the respec-
tive relationships in the class diagram. Next, relation-
ships are transformed into EReferences between the
involved classifiers.
Finally, structural features are transformed into
EAttributes and the model is persisted. The result-
ing models may then be used in the user preferred tool
(e.g. any Ecore-based tool, or UML compliant tool
like Valkyrie (Buchmann, 2012)).
5 EVALUATION
This section provides evaluation results for the tool
presented in this paper. In the first subsection we dis-
cuss the results of the classifiers used to detect hand-
written names and numbers/symbols using different
metrics.
The results of the overall tool are discussed after-
wards using examples of handwritten class diagrams.
5.1 Classifiers
The classifier for detecting numbers was evaluated
based on the MNIST data set and the ESHWD data
set. There is a large number of metrics allowing
for the quantification of classifiers and their perfor-
mances.
For a binary classification problem, each sample
x ∈ X belongs either to the class ω
0
or ω
1
. The sam-
ples in ω
0
and ω
1
respectively, which are classified
correctly are referred to as true positives (TP) and true
negatives (TN), respectively. Consequently, the sam-
ples that are classified in a wrong way are called false
negatives (FN) and false positives (FP). A confusion
matrix may be used to aggregate the numbers for each
category. For both data sets, the confusion matrix for
the class 0 – representing the eponymous number – is
depicted in Tables 1 and 2 (Mitchell, 1997).
Table 1: MNIST.
Prediction
0 Not 0
Actual
0 980 0
Not 0 3 9017
Table 2: ESHWD.
Prediction
0 Not 0
Actual
0 292 5
Not 0 7 2975
The accuracy determines the ratio of all correct classi-
fications to the amount of total classifications. For the
MNIST data set our classifier achieves an accuracy
of 99.66% for a test set of 10000 elements. For the
ESHWD dataset the accuracy value is slightly lower
(98.26% for a test set of 3279 elements).
For the binary case, precision is defined as
T P
T P+FP
and recall as
T P
T P+FP
. Intuitively, both numbers give
a notion of how well the classifier detects samples of
the class ω
0
. But both numbers emphasize different
aspects. In some applications, one number needs to
be maximized (often resulting in a degradation of the
second one). The F1-Score combines both metrics
in a harmonic mean. Higher values correspond to a
better performance of the classifier on samples taken
from class ω
0
. Table 3 depicts the obtained numbers
for each class of the ESHWD data set.
The performance of our classifier for HTR was
evaluated using the IAM data set. We used the met-
rics Character Error Rate (CER) and Word Error Rate
(WER), two commonly used metrics in the context of
text recognition for this purpose.
AI-Based Recognition of Sketched Class Diagrams
231
Table 3: Performance of the classifier on the ESHWD data
set (P = T P + FN)
Class precision recall f1 P
0 0.9766 0.9832 0.9799 297
1 0.9524 0.9971 0.9742 341
2 0.9912 0.9912 0.9912 339
3 0.9844 0.9723 0.9783 325
4 0.9877 0.9907 0.9892 323
5 0.9735 0.9880 0.9807 334
6 0.9940 0.9736 0.9837 341
7 0.9907 0.9846 0.9876 324
8 0.9939 0.9614 0.9774 337
9 0.9843 0.9843 0.9843 318
For calculating the value of CER, the number of op-
erations needed to transform the recognized text (RT)
into the actual text from the training set – the ground
truth text (GTT) – is divided by the length of the GTT.
Valid operations are insertion, deletion and substitu-
tion of characters (i.e. the expression in the numerator
is closely connected to the Levenshtein distance).
CER =
#insertions + #deletions + #substitutions
|GT T |
=
lev(RT, GT T )
|GT T |
In order to calculate the WER, the text is split into
a sequence S = (w
1
, . . . , w
n
) of words. Analogously,
the GTT is split into a sequence T = (v
1
, . . . , v
m
) of
words. Similar to the calculation of the CER, the
WER is determined, with the number of edit opera-
tions on the level of words being divided by the num-
ber of words in the sequence T (Scheidl, ).
W ER =
#insertions + #deletions + #substitutions
m
=
lev
w
(S, T )
m
For the IAM data set our classifier achieves a CER
of 10.91% and a WER of 22.52%. This means that
approx. 77.48% of the words in the test data set are
classified correctly.
5.2 Example Diagrams
Figure 3 depicts the first class diagram which is dis-
cussed in this Section. The image was taken with the
camera of a smart phone. It displays an inhomoge-
neous illumination and the background contains a lot
of noise. These facts complicate the analysis process.
The bounding boxes of the classifiers contained in
the diagram have been recognized correctly, as well
as the segmentation of building blocks of classifiers
Figure 3: First example class diagram.
in the next step. Recognizing the relationships led to
some problems. The line of the association between
the classes Car and Door is not continuous after the
binarization of the image, as a result of the small line
width in the image and the poor image quality. Never-
theless, the relationship was recognized and all other
relationships were identified correctly as well. The ar-
row head of the inheritance relationships is drawn in
a relatively small way, which almost led to those re-
lationships being classified as directed associations.
The filled diamond of the composition relation be-
tween Car and Seat is rotated and thus it is not clas-
sified correctly (instead a regular association is used
in the recognized model). The cardinality 2..5 was
identified correctly, but our recognizer failed to clas-
sify the upper bound of 2..7 correctly, since both
numbers are strongly rotated in the image. This high
degree of rotation was absent in the images of the
training data set. Names and types were classified al-
most correctly. Only the very first character of Car
and Sedan was recognized as lower case instead of
upper case. This error was fixed automatically as part
of the post-processing step during model generation.
The segmentation of the word Sedan and that of
some other identifiers led to over segmentation. Our
tool provides mechanisms to cope with this issue,
which can not be described in detail in this paper due
to space restrictions. The attributes of Car lead to a
segmentation as depicted in the lower part of Figure
4.
The word ”brand” was over segmented. The dis-
tance between the characters in this word is bigger
compared with the other words present in the hand
written diagram. All other words are classified cor-
rectly, and brand was recognized as ”braned”.
Figure 5 depicts an example diagram, which was
scanned and thus provides a much better background
illumination and considerably less background noise.
This results in a much easier binarization process
MODELSWARD 2024 - 12th International Conference on Model-Based Software and Systems Engineering
232
Figure 4: Segmentation results.
Figure 5: Second class diagram example.
and leads to a correct recognition and segmentation
of the contained classifiers. Even the enumeration
was classified correctly as such. The lines of text
are segmented correctly, except the line containing
the stereotype enum, which is also over segmented
due to the space between the brackets and the word
enum. The names of Items and Kind were recog-
nized as ”Jtems” and ”klind”. The enumeration literal
Food was recognized correctly, but Electronics has a
larger deviation with a Levenshtein distance of 5 be-
tween recognized and actual word. The classification
of the last four characters poses a difficulty for our
HTR system. The relation between Items and Order
was identified as a bidirectional association and addi-
tionally the multiplicities were classified correctly.
5.3 Discussion
The results demonstrate that our tool achieves good
results in the correct classification of hand written
class diagrams. Even for images with bad illumina-
tion and a lot of noise. As our goal was to minimize
the effort for developers as much as possible when
transferring a hand written diagram into a model, we
consider our tool as an improvement to the status quo
in this scenario.
The recognition of classifiers in the diagram
works very well. In almost all cases were they iden-
tified correctly, if the lines do not contain large gaps.
In the case of gaps, a classifier can currently not be
detected and all of its properties and relationships are
not recognized which is problematic. Segmentation
of sub blocks works well, except for blocks which
contain text that intersects with the outer contours
of the block as separating those poses a significant
challenge. In that case the block can not be seg-
mented correctly, which affects the following steps of
the recognition pipeline.
Recognizing relationships and their respective end
points was successful in almost every case, but the
used method can be improved to be more robust
against errors introduced in preceding analysis steps.
6 CONCLUSION
In this paper, we presented a novel approach to au-
tomatically detect hand drawn class diagrams using
methods from computer vision and artificial neural
networks. Based on the results, a prototype tool has
been implemented as a proof of concept which is able
to produce EMF class diagrams and UML class dia-
grams.
Future work comprises mechanisms to allow for
an easy training of different styles of hand-written
characters. Furthermore, we are working on support-
ing other UML diagrams as well, e.g. use case dia-
grams or state machines.
REFERENCES
Buchmann, T. (2012). Valkyrie: A uml-based model-driven
environment for model-driven software engineering.
In Hammoudi, S., van Sinderen, M., and Cordeiro,
J., editors, ICSOFT 2012 - Proceedings of the 7th In-
ternational Conference on Software Paradigm Trends,
Rome, Italy, 24 - 27 July, 2012, pages 147–157.
SciTePress.
Gosala, B., Chowdhuri, S. R., Singh, J., Gupta, M., and
Mishra, A. (2021). Automatic classification of uml
class diagrams using deep learning technique: Convo-
lutional neural network. Applied Sciences, 11(9).
Hu, J., Shen, L., Albanie, S., Sun, G., and Wu, E. Squeeze-
and-excitation networks. 42(8):2011–2023.
LeCun, Y., Cortes, C., and Christopher J.C., B.
The mnist databaseof handwritten digits.
http://yann.lecun.com/exdb/mnist/.
AI-Based Recognition of Sketched Class Diagrams
233

Marti, U. and Bunke, H. (2002). The iam-database: an en-
glish sentence database for offline handwriting recog-
nition. Int. J. Document Anal. Recognit., 5(1):39–46.
Mellor, S. J., Scott, K., Uhl, A., and Weise, D. (2002).
Model-driven architecture. In Bruel, J. and Bellah-
sene, Z., editors, Advances in Object-Oriented In-
formation Systems, OOIS 2002 Workshops, Montpel-
lier, France, September 2, 2002, Proceedings, volume
2426 of Lecture Notes in Computer Science, pages
290–297. Springer.
Mitchell, T. M. (1997). Machine learning, International
Edition. McGraw-Hill Series in Computer Science.
McGraw-Hill.
OMG (2017). Unified Modeling Language (UML). Object
Management Group, Needham, MA, formal/2017-12-
05 edition.
Sch
¨
afer, B., Keuper, M., and Stuckenschmidt, H. (2021).
Arrow R-CNN for handwritten diagram recognition.
Int. J. Document Anal. Recognit., 24(1):3–17.
Scheidl, H. Handwritten text recognition in historical doc-
uments. PhD thesis.
Steinberg, D., Budinsky, F., Paternostro, M., and Merks, E.
EMF: Eclipse Modeling Framework. Eclipse Series.
Addison-Wesley, 2 edition.
V
¨
olter, M., Stahl, T., Bettin, J., Haase, A., and Helsen, S.
(2006). Model-Driven Software Development: Tech-
nology, Engineering, Management. John Wiley &
Sons.
MODELSWARD 2024 - 12th International Conference on Model-Based Software and Systems Engineering
234
