
The Risk of Image Generator-Specific Traces in Synthetic Training Data
Georg Wimmer
∗ a
, Dominik Söllinger
∗ b
and Andreas Uhl
c
Paris Lodron University Salzburg, Jakob-Haringer-Str. 2, 5020 Salzburg, Austria
Keywords:
Image Synthesis, GAN, Diffusion Model, Synthetic Artifacts.
Abstract:
Deep learning based methods require large amounts of annotated training data. Using synthetic images to train
deep learning models is a faster and cheaper alternative to gathering and manually annotating training data.
However, synthetic images have been demonstrated to exhibit a unique model-specific fingerprint that is not
present in real images. In this work, we investigate the effect of such model-specific traces on the training of
CNN-based classifiers. Two different methods are applied to generate synthetic training data, a conditional
GAN-based image-to-image translation method (BicycleGAN) and a conditional diffusion model (Palette).
Our results show that CNN-based classifiers can easily be fooled by generator-specific traces contained in
synthetic images. As we will show, classifiers can learn to discriminate based on the traces left by the generator,
instead of class-specific features.
1 INTRODUCTION
Large amounts of publicly available data are the basis
for training deep neural networks. To properly train
a neural network, huge amounts of annotated train-
ing data are necessary. Of course, gathering such
amounts of data is time consuming and expansive. A
potential solution to that problem is to generate syn-
thetic data (Man and Chahl, 2022). With the emer-
gence of versatile and powerful new approaches like
generative adversarial networks (GAN) and diffusion
models (DM) that are able to generate photo-realistic
images, synthetic image generation has become a hot
topic in science. There are different approaches to us-
ing synthetic data for training deep neural networks.
They range from using synthetic data only for certain
classes (e.g. to remove class imbalances (Elreedy and
Atiya, 2019)) to a general mixture of real and syn-
thetic training data for all classes (categories) to the
exclusive use of synthetic data.
An often raised question is how closely synthetic
data resembles real data and whether the synthetic
data are suited to train or improve a neural network.
Recent work in various fields like e.g. medical imag-
ing (Torfi et al., 2022; Chen et al., 2022), face recog-
nition (Qiu et al., 2021; Zhang et al., 2021) and object
a
https://orcid.org/0000-0001-5529-0154
b
https://orcid.org/0000-0002-4262-9195
c
https://orcid.org/0000-0002-5921-8755
∗
These authors contributed equally
detection (Li et al., 2022) show the potential of us-
ing synthetic data. On the other hand, mostly driven
by the need to detect deep fakes, some work (Wes-
selkamp et al., 2022) has also shown that image syn-
thesis methods leave unique artifacts in the image do-
main that are not contained in the real data. Hence, it
can be argued that as long as such artifacts are present,
synthetic images do not perfectly resemble real data.
Such generator-specific traces might not be an issue
for applications where the images across all cate-
gories (classes) are generated from the same image
synthesis method (as e.g. in face recognition). How-
ever, we hypothesize that generator-specific traces
can cause severe problems if deep learning based
classifiers are trained using synthetic images, where
different classes are generated using different image
generators. The same may apply for classifiers that
are trained using a mixture of real and synthetic data,
if specific classes of the training data are only repre-
sented by synthetic data from a given generator (e.g.
class 1 = synthetic, class 2 = real). For example, we
might encounter such scenarios in the field of medi-
cal image analysis where a lack of data is an imma-
nent problem as data cannot be easily shared due to
privacy concerns. Additionally, there is often a lack
of data for specific classes of images. Therefore, it
might be tempting to increase the number of images
with synthetic data. If a deep learning based classifier
is now trained on both real and synthetic data (e.g.,
class 1 = synthetic and class 2 = real), it may learn to
Wimmer, G., Söllinger, D. and Uhl, A.
The Risk of Image Generator-Specific Traces in Synthetic Training Data.
DOI: 10.5220/0012420600003660
Paper published under CC license (CC BY-NC-ND 4.0)
In Proceedings of the 19th International Joint Conference on Computer Vision, Imaging and Computer Graphics Theory and Applications (VISIGRAPP 2024) - Volume 3: VISAPP, pages
199-206
ISBN: 978-989-758-679-8; ISSN: 2184-4321
Proceedings Copyright © 2024 by SCITEPRESS – Science and Technology Publications, Lda.
199

Figure 1: Example of a security label.
discriminate based on the traces left by the generator,
which may provide a perfect decision boundary. The
same applies if the classifier is trained using only syn-
thetic data (e.g., class 1 = synthetic (generator A) and
class 2 = synthetic (generator B)).
In this work, we therefore investigate whether
the aforementioned hypothesis indeed poses an issue
based on a scenario we encountered in industry. The
detection of genuine and counterfeit "security labels"
based on synthetically generated security labels. To
the best of our knowledge, no previous work has in-
vestigated the effect of generator-specific traces (e.g.,
artifacts) on classifiers that are trained using synthetic
images.
2 PRODUCT AUTHENTICATION
BASED ON SECURITY LABELS
In order to stop product counterfeiting, the company
"Authentic Vision"
1
offers security labels that can
be attached to a product or its packaging. One ex-
ample of such a security label can be seen in Figure
1. Each label features a hologram with a unique ran-
dom pattern and multiple security features to prevent
the security label from being replicated. For instance,
the holographic foil shows reflections when exposed
to light. Hence, missing reflections indicate forgery.
Additionally, removing the security label exposes a
diagonal, grid-like pattern which is referred to as the
VOID pattern. Examples of security labels with a
clearly visible VOID pattern can be found in Figure
2(c) and (f). Once the VOID pattern becomes visi-
ble, the product cannot be considered genuine. Note
that in some cases, the VOID pattern is fairly hard to
detect, in particular in cases where the VOID pattern
only appears at small parts of the label. In order to
verify whether a product is genuine or not, users can
scan the security label with a smartphone app, which
then performs all necessary checks to verify whether
the product is genuine.
1
https://www.authenticvision.com/
In order to verify whether a VOID pattern is visi-
ble or not, a convolutional neural network (CNN) is
employed. This VOID pattern detector is trained on
thousands of manually annotated security label scans
in order to reliably detect scans with VOID patterns.
As a result, changing key characteristics of the secu-
rity label, such as its shape, can be challenging since
new training data must first be gathered in order to re-
train the model.
A potential solution to speed up the tedious task of
manually collecting and annotating security labels is
the use of synthetic data. One way to approach this
task is by synthesizing environmental-specific char-
acteristics (e.g., reflections, over-/underexposure, im-
age blur), onto previously unseen labels (which might
have a different shape).
In this work, we analyze whether synthetic data is a
viable solution for that problem. This is done by com-
paring the results of the VOID pattern detector using
either synthetic, real or mixed data to train the detec-
tor.
3 EXPERIMENTAL SETUP
3.1 Dataset
The dataset utilized in this work is composed of two
types of images: enrollment images and scan images.
Enrollment images are images of a security label that
were captured in the factory. On the other hand, scan
images are images of a security label captured in the
real world (from users that scan the security label
with the smartphone app). Since each security la-
bel is unique, each scan image can be uniquely as-
signed to an enrollment image. For every enrollment
image, there is at least one scan image in the dataset.
Examples of two enrollment images and their corre-
sponding scan images can be observed in Figure 2
(top row). In total, there are 43517 enrollment images
and 289309 scan images which exhibit a resolution
of 165×189 pixel. Each of the scan image has been
labeled as either genuine (class ’AUTH’) or counter-
feit (class ’VOID’). Note that all images underwent
an initial prealignment to ensure that the hologram is
perfectly aligned at the image center. Due to the pre-
alignment, extracting a patch of size 128×128 from
the image center results in an image that shows the
hologram but almost no background. An example of
such center-cropped enrollment and scan images can
be found in Figure 2 (bottom row).
In order to validate the performance of the VOID
pattern detector (described in Sec. 3.3) on scan im-
ages that have not been used for the training of the
VISAPP 2024 - 19th International Conference on Computer Vision Theory and Applications
200

(a) Enrollment (b) Scan AUTH (c) Scan VOID
(d) Enrollment (e) Scan AUTH (f) Scan VOID
Figure 2: Examples of enrollment and scan images. Each
row shows an original enrollment image (left) as well as
a corresponding authentic scan (center) and void image
(right). The bottom row shows the center-cropped version
of the same enrollment and scan images.
detector nor the image synthesis methods (Sec. 3.2),
the dataset is split into two sets: A training set com-
posed of ∼ 90% of the enrollment images and the cor-
responding scan images, and a test set composed of
the remaining ∼ 10% of the enrollment images and
the corresponding scan images. As a result, the train-
ing set has 39193 enrollment and 259871 scan images
(240075 Authentic + 19796 VOID). We further de-
note the Authentic (AUTH) scan images and their cor-
responding enrollment images from the training set
as AUTH training set and the VOID scan images and
their corresponding enrollment images from the train-
ing set as VOID training set. The test set has 4324
enrollment and 29438 scan images (26990 AUTH +
2448 VOID).
3.2 Synthetic Image Generation
We employ two different DL-based methods for
conditional multi-modal image synthesis. The first
method is based on a GAN, and the second model
is based on a diffusion model. Both methods are em-
ployed to generate scan images based on enrollment
images as input. The methods are trained using image
pairs, where one image is an enrollment image and the
other image a corresponding scan image. Both meth-
ods are once trained to generate Authentic scan im-
ages (using paired data from the AUTH training set)
and once trained to generate VOID scan images (us-
ing paired data from the VOID training set).
A brief description of the employed architectures
can be found in the following.
BicycleGAN. BicycleGAN (Zhu et al., 2017) (B-
GAN) is a GAN-based conditional image generator
for image-to-image translation. An advantage of
the BicycleGAN model compared to most other
DL-based image generation methods is its ability
to produce both diverse and visually appealing
results. This is achieved by learning an invertible
mapping between the output of a generator (a scan
image) and an 8-dimensional latent code, so that
different latent code vectors actually lead to different
outputs. The style of the scan images is encoded
in the low-dimensional latent vector, which can
be randomly sampled at test time. We use the
implementation available at this website
2
. The
BicycleGAN model is trained for 60 epochs with
a batch size of 2. To fit the size of the images to
the BicycleGAN’s required image size, the training
images (both enrollment and scan images) are first
made quadratic (165 × 189 → 189 × 189) by adding
black background at the left and right side of the
images, and then scaled to the size 256 × 256.
Finally, the generated synthetic scan images are
downsized (256 × 256 → 189 × 189) and the black
background is removed (189 × 189 → 165 × 189).
All enrollment images were initially transformed to
grayscale. Grayscale conversion and the described
resizing method led to the best results, in the author’s
opinion (we tested a lot of different configurations to
find the best working one).
Palette. Palette (Saharia et al., 2022a) (P-DM) is an
image-to-image diffusion model. An image-to-image
diffusion model is a conditional diffusion model of
the form p(y|x), where x and y are images. In our
case, x is an enrollment image and y is a scan image.
For the diffusion process, Palette uses a U-Net archi-
tecture (Ho et al., 2020) with several modifications
inspired by recent work (Dhariwal and Nichol, 2021;
Saharia et al., 2022b; Song et al., 2020). Note that
unlike in the original work, we train the network on
128×128 sized images (center-cropped from the en-
rollment and scan images) to reduce the quite substan-
tial learning and inference time. We use the imple-
mentation available at this website
3
. The Palette Au-
thentic image synthesizer is trained on AUTH training
set for 240k iterations with a batch size of 64. The
VOID image synthesizer is trained on VOID train-
ing set for 354k iterations with a batch size of 64.
Random horizontal flipping is applied to increase the
number of samples in the training set.
2
https://github.com/junyanz/BicycleGAN
3
https://github.com/Janspiry/
Palette-Image-to-Image-Diffusion-Models
The Risk of Image Generator-Specific Traces in Synthetic Training Data
201

3.3 CNN-Based VOID Pattern Detector
In order to assess the ability of the synthetic data
to replace real data, a CNN-based VOID pattern de-
tector is trained to differentiate genuine scan images
(AUTH images) from counterfeits (VOID images).
An EfficientNet-B0 (Tan and Le, 2019) pretrained on
ImageNet is utilized for this purpose. The model
is trained to distinguish AUTH from VOID samples
using a binary cross entropy loss. Thanks to the
pretrained model, training with an ADAM optimizer
(learning rate lr = 10
−4
, weight decay w = 10
−3
and
batch size b = 64) for only 3000 iterations is sufficient
to achieve model convergence. Furthermore, note
that there is a significant class imbalance between the
number of scan images of the AUTH training set and
the VOID training set. In order to overcome this issue,
we applied weight sampling to make sure that images
of each class have the same likelihood of being shown
to the model.
3.4 Evaluation Protocol
To analyze the impact of the employed training data
on the accuracy of the VOID pattern detector, we
conduct experiments with the following training data
compositions:
• Real world scan images from the AUTH (∼240k
images) and VOID training set (∼20k images).
This is the baseline accuracy.
• Real world scan images from the VOID training
set (∼ 20k images) and synthetic scan images
from class AUTH (50k images). This data compo-
sition is motivated by the possibly too low number
of training samples from the VOID training set to
properly train the image synthesis methods.
• Synthetic images from both classes (50k images
per class)
In order to generate synthetic training data for the
AUTH and VOID class, separate models are trained
for each class (AUTH and VOID) and architecture
(B-GAN and P-DM). We generate a set of 50k
synthetic images for each class. The synthetic images
of class Authentic are generated from 10k enrollment
images from the AUTH training set (5 scan images
per enrollment image) and the synthetic images of
class VOID are generated from 1k enrollment images
from the VOID training set (50 scan images per
enrollment image).
The model performance evaluation is carried
out on the real scan images of the test set. The test
set is quite imbalanced with respect to the number
(a) B-GAN
AUTH
(b) P-DM AUTH (c) B-GAN
VOID
(d) P-DM VOID
(e) B-GAN
AUTH
(f) P-DM AUTH (g) B-GAN
VOID
(h) P-DM VOID
Figure 3: Synthetic images from both classes (AUTH and
VOID) and models (B-GAN and P-DM) generated from the
enrollment images in Figure 2 (Top row 2(a) and bottom
row 2 (d)).
of images per class (∼27k Authentic scan images
and ∼2450 VOID scan images). Hence, we employ
evaluation metrics that are suited for imbalanced
datasets. As performance measures we compute the
per-class accuracy (number of correctly classified
images of a given class divided by the number of
samples of the given class) and the Balanced accuracy
(sum over the per-class accuracies divided by the
number of classes (2)). The VOID pattern detector
is trained and evaluated 5 times (runs) and we report
the means and the standard deviations of the results
over the 5 runs.
4 RESULTS
The following section reports the results of the image
quality analysis (Sec. 4.1) and the performance of the
VOID pattern detector trained on synthetic and real
images (Sec. 4.2).
4.1 Image Quality Analysis
In this section, we analyze the quality of the differ-
ent generators by visually analyzing the image qual-
ity and by measuring the Frechet Inception Distance
(FID) (Heusel et al., 2017). In Figure 3, some rep-
resentative image samples generated by both genera-
tion methods (i.e., B-GAN and P-DM) are shown. To
generate the synthetic scan images, grayscale trans-
formed enrollment images of the original size are
used for B-GAN and center cropped enrollment im-
ages for P-DM.
VISAPP 2024 - 19th International Conference on Computer Vision Theory and Applications
202

Table 1: Frechet Inception Distance (FID) for each genera-
tor.
Model Trained on Image Size FID
B-GAN AUTH 128×128 22.65
B-GAN AUTH original 27.47
P-DM AUTH 128×128 11.64
B-GAN VOID 128×128 35.52
B-GAN VOID original 36.77
P-DM VOID 128×128 10.97
At the first glance, the generated synthetic images
from both image generation methods all look con-
vincing and show image effects that also appear in the
real scan images. The B-GAN generated images im-
press with their diversity. However, at the pixel level
one can observe that the B-GAN generated images
are more blurry than the original images. Further-
more, there are no B-GAN generated VOID images in
which the VOID pattern appears only on small parts
of the label (which occurs in some of the real VOID
images and also the P-DM generated VOID images).
The synthetic images generated by the P-DM are also
quite diverse, but not to the same extent than the ones
from the B-GAN. In the authors opinion, the qual-
ity of the generated images from the P-DM appears
slightly better than those from the B-GAN.
The FID scores of each generator are shown in Ta-
ble 1. Note that in literature, FID scores are mostly
used to measure the sample quality of unconditional
image generators. However, to measure the FID
score of a conditional image generator, the FID score
should only depend on the distribution of the scan
images and be independent on the underlying enroll-
ment images. Therefore, we create a ground-truth set
for FID score computation by randomly sampling 15k
real scan images from the AUTH and VOID training
set, respectively. We then take the corresponding en-
rollment image of each scan and generate a synthetic
image using the generator. Afterwards, we calculate
the FID score between the two sets from the same
class, each composed of 15k images.
As can be seen in Table 1, the FID scores obtained
by B-GAN trained on AUTH images are lower than
on VOID images. This indicates that synthetic AUTH
images have a superior quality, which is also inline
with our visual observation. A reasonable argument
to justify this observation is by the number of sam-
ples. While the AUTH generators were trained on
∼240k real images, the VOID generators could only
be trained on ∼20k images due to a lack of real VOID
scan images.
Surprisingly, this is not the case for P-DM. In con-
trast to B-GAN, the P-DM model trained on VOID
images achieves a slightly lower FID than the model
trained on AUTH images. However, generating some
VOID scan images using P-DM for some selected en-
(a) Real void (b) Real void (c) Real void (d) Real void
(e) Synth void (f) Synth void (g) Synth void (h) Synth void
Figure 4: Examples of real and synthetic VOID scan images
for chosen enrollment images from the training set. The top
row shows the real images. The bottom row shows some
synthetic images generated by the P-DM model.
rollment shows the potential explanation for the low
FID score. Figure 4 show a series of VOID images
generated by P-DM (bottom row) from a single en-
rollment image as well as some corresponding real
VOID images (top row). As can be seen by compar-
ing both rows, the model seems to have memorized
the training images and hence the generated samples
lack diversity. Even the VOID pattern in the synthetic
images occurs at the same position as in the real im-
ages (right bottom part of the hologram). Note that
this phenomenon has already been observed before
(Carlini et al., 2023).
In summary, after inspecting the images visually
as well as using FID, images generated by the diffu-
sion model tend to have a better image quality. How-
ever, generated images lack diversity and they are
more prone to overfitting (this can be observed in par-
ticular for the VOID model). Scan images generated
by BicycleGAN exhibit a lower quality but are clearly
more diverse.
We argue that although overfitting clearly is not
ideal, it is not an issue for the subsequent experi-
ment using the VOID pattern detector. In fact, if the
generator just learned to copy scan images from the
training set, a VOID pattern detector trained on these
data should exhibit the same performance as a detec-
tor trained on real images. Hence, we expect that scan
images produced by the diffusion model should out-
perform scan images produced by BicycleGAN in the
VOID pattern detection evaluation. At least if FID is
a useful metric to measure the quality of a dataset for
such a task.
4.2 VOID Pattern Detection Results
In Table 2, we present the average results on the test
set over 5 runs of training and evaluation of the CNN-
The Risk of Image Generator-Specific Traces in Synthetic Training Data
203

Table 2: Mean VOID detection results and the standard de-
viations (in brackets).
Data ACC
AUTH VOID Image Size AUTH VOID Balanced
Real Real 128×128 0.99 (0.00) 0.84 (0.01) 0.91 (0.01)
Real Real original 1.00 (0.00) 0.83 (0.01) 0.91 (0.00)
B-GAN Real 128×128 0.12 (0.00) 0.98 (0.01) 0.56 (0.02)
B-GAN Real original 0.00 (0.00) 1.00 (0.00) 0.50 (0.00)
P-DM Real 128×128 0.42 (0.00) 0.96 (0.01) 0.76 (0.05)
B-GAN B-GAN 128×128 0.99 (0.00) 0.69 (0.05) 0.83 (0.02)
B-GAN B-GAN original 0.99 (0.00) 0.63 (0.02) 0.81 (0.01)
P-DM P-DM 128×128 0.88 (0.00) 0.73 (0.03) 0.81 (0.02)
based VOID detection. The CNN is trained either
with real scan images, synthetic images, or using real
scan images for the class VOID and synthetic im-
ages for the class AUTH. As expected, the clearly
best results are achieved using only real world train-
ing data with a balanced accuracy of 91% for both im-
age sizes. This constitutes the performance baseline,
which synthetic images should come close too. Us-
ing real world training data from the VOID class and
synthetic images for the AUTH class did not work at
all for B-GAN and only quite poor for P-DM. When
the CNN is trained using synthetic image from one
and the same method, then the results are clearly bet-
ter than for the mixed scenario (B-GAN:81%/83%,
P-DM:81%), but still clearly worse than the results
using real image data for training.
From the results in Table 2, we can see that the
worst classification accuracy is achieved if synthetic
training data is used for class AUTH and real train-
ing data for class VOID. The fact that using mixed
training data produces worse results than using only
synthetic images, despite the fact that real-world data
produces the best results, leaves only one plausible
explanation: The CNN-based VOID detector pref-
erentially learns model-specific features over class-
specific features. Such detectors can only fail on
the test set, which is composed of real data. This is
clearly recognizable when we observe the per-class
accuracies for using mixed training data: Nearly all
test set images were classified as VOID, the same
class that includes the real training data.
So, in case of the mixed training data, the VOID
detector primarily learned to differentiate between
real and synthetic images, instead of learning to dif-
ferentiate between the two classes AUTH and VOID
as it was supposed to. This means that the synthetic
image data is clearly distinguishable from the real im-
ages and the differences between real and synthetic
data provide a more obvious decision boundary for
the VOID detector than class-specific features.
So, the further questions are what are these differ-
ences between real and synthetic images and how can
these differences be reduced.
5 MODEL-SPECIFIC
FINGERPRINTS IN
SYNTHETIC DATA
It was shown in previous research (Wesselkamp et al.,
2022; Corvi et al., 2023), that synthetically generated
images from both GAN and diffusion model based
approaches include visible artifacts in the frequency
domain and that synthetic and real images exhibit sig-
nificant differences in the mid-high frequency signal
content. These characteristics of synthetic images can
be used to identify them as synthetically generated.
We visually highlight the fingerprint of synthetic
images from a image generation model in the fol-
lowing way. We randomly select a set of n = 5000
real (referred to as R) and synthetic (referred to as S)
scan images from one class. Then the fingerprint of
the trained image synthesis model is computed as fol-
lows:
FP(R, S) =
1
n
n
∑
i=1
log(|F(S
i
)|) −
1
n
n
∑
i=1
log(|F(R
i
)|)
(1)
where F denotes the Fourier transformation, S
i
de-
notes a synthetic scan image and R
i
a real scan image.
Taking the logarithm over the absolute valued Fourier
transformed image distinctly highlights the artifacts
in the frequency domain caused by the image genera-
tors. Broadly speaking, the fingerprint is the spectral
difference between synthetic images and real images,
where ideally all values should be close to zero.
In Figure 5, we present the fingerprints FP of the
two employed image generators of both classes. We
can observe that the B-GAN fingerprints exhibit a dis-
tinct grid pattern. This pattern is most likely a result
of the transposed-convolution operation used for up-
sampling, which is known to cause checkerboard arti-
facts in the spatial domain (Frank et al., 2020). The B-
GAN fingerprints of the two classes are similar from
a visual point of view, but there are also clear differ-
ences between them. This indicates that the B-GAN
models of the two classes generate slightly different
model-based image characteristics.
The P-DM FPs do not exhibit the clearly notice-
able grid-like pattern like B-GAN FPs (at least it is
less prominent). However, there are some other types
of repeating pattern. These patterns seem to be char-
acteristic for each class. In any case, there is an ob-
vious difference between the FPs of both classes. We
assume that the presence of repeated patterns in the
frequency domain of the synthetic images is one of
the fundamental reasons why the VOID pattern detec-
tor trained on synthetic images performs worse than
on real images. Even worse, the pattern that emerges
VISAPP 2024 - 19th International Conference on Computer Vision Theory and Applications
204
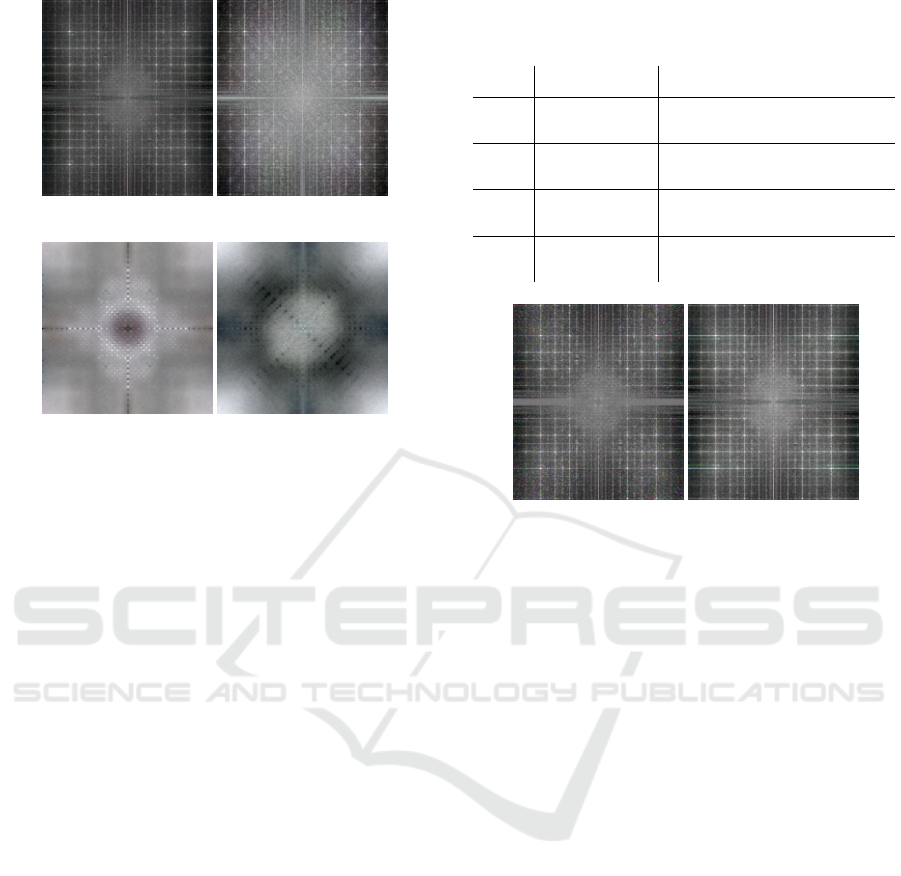
(a) FP B-GAN AUTH (b) FP B-GAN VOID
(c) FP P-DM AUTH (d) FP P-DM VOID
Figure 5: B-GAN and P-DM fingerprints (FP) of synthetic
images from the classes VOID and AUTH.
appears to be distinct for each generator and class
(note that each fingerprint shown in Figure 5 exhibits
a unique pattern). That means that the VOID detec-
tor can be easily tempted to classify images using
model-based characteristics instead of class-specific
characteristics (e.g., the VOID pattern). Since the test
set is composed of real images, which do not exhibit
such fingerprint, the VOID detector will fail to clas-
sify those images. This of course leads to the problem
that the VOID detector is not able to properly differ-
entiate between the classes when applied to real scan
images, whenever the VOID model is trained at least
partly with synthetic data (one class real scan images
the other one synthetic images or both classes trained
with synthetic images).
To deal with that problem, we employ two meth-
ods from the research area of deep fake detection that
were presented in (Wesselkamp et al., 2022). The two
methods ’Mean-Spectrum Attack’ and ’Frequency-
Peaks Attack’ both aim to remove or lessen the fin-
gerprints on synthetic images. These two methods
were employed in (Wesselkamp et al., 2022) to coun-
terattack methods that recognize synthetic images.
Roughly explained, the method Mean-Spectrum At-
tack (MSA) calculates the average difference in the
frequency spectrum between synthetic and real im-
ages and then subtracts the average difference from
each synthetic image in the frequency domain. How-
ever, we observed that it is only able to slightly re-
duce the peaks in the fingerprints as shown in Figure
5. The method Frequency-Peaks Attack (FPA) fol-
lows a slightly different strategy and aims to remove
Table 3: VOID detection results before and after finger-
print removal using the two methods Mean-Spectral Attack
(MSA) and Frequency-Peak Attack (FPA).
Data ACC
FP rem. AUTH VOID AUTH VOID Bal.
- B-GAN Real 0.12 (0.00) 0.98 (0.01) 0.56 (0.02)
MSA B-GAN Real 0.20 (0.00) 0.98 (0.00) 0.62 (0.04)
FPA B-GAN Real 0.03 (0.00) 1.00 (0.00) 0.51 (0.01)
- P-DM Real 0.42 (0.00) 0.96 (0.01) 0.76 (0.05)
MSA P-DM Real 0.20 (0.00) 0.98 (0.00) 0.62 (0.04)
FPA P-DM Real 0.03 (0.00) 1.00 (0.00) 0.51 (0.01)
- B-GAN B-GAN 0.99 (0.00) 0.69 (0.05) 0.83 (0.02)
MSA B-GAN B-GAN 1.00 (0.00) 0.63 (0.02) 0.81 (0.01)
FPA B-GAN B-GAN 1.00 (0.00) 0.14 (0.07) 0.57 (0.03)
- P-DM P-DM 0.88 (0.00) 0.73 (0.03) 0.81 (0.02)
MSA P-DM P-DM 0.37 (0.00) 0.91 (0.04) 0.65 (0.01)
FPA P-DM P-DM 0.84 (0.00) 0.27 (0.19) 0.56 (0.04)
(a) FP B-GAN MSA (b) FP B-GAN FPA
Figure 6: Fingerprints (FP) of B-GAN generated images
from the class AUTH after fingerprint removal using the
methods MSA and FPA.
the peaks in the frequency domain, that are typically
in synthetic images and can be observed in the finger-
prints shown in Figure 5. However, we observed that
this methods does not only remove peaks but partly
changes also other image characteristics like the color
and brightness distribution of the images.
In Table 3, we present the results of the VOID de-
tection model (mean and Std (in brackets) over the
results of 5 runs) after applying the two fingerprint
removal techniques MSA and FPA, compared to the
results without fingerprint removal. Unfortunately,
it turned out both fingerprint removal methods did
not improve the results but even made them worse.
Even more so, the fingerprints of synthetic images
did hardly change and were still present after the fin-
gerprint removal. This can be observed in Figure
6, where we show the fingerprints of B-GAN gener-
ated images after applying the two fingerprint removal
techniques to the generated images.
6 CONCLUSION
In this work we analyzed the impact of synthetic train-
ing data on a deep-learning based classifier. The clas-
sification models were trained either with real, syn-
thetic, or mixed data (one class of real images, the
The Risk of Image Generator-Specific Traces in Synthetic Training Data
205

other one with synthetic images). The clearly best
classification rates were achieved using only real-
world data (91%), followed by using only synthetic
data (81-83%), and the worst results were achieved
using mixed data (50-76%). A comparison of the fre-
quency spectra of the synthetic images showed that
each generator exhibits unique model-specific char-
acteristics (a model-specific fingerprint). It’s likely
that this fingerprint is one of the reasons for the de-
graded performance of the classifiers trained on syn-
thetic data and, even more so, on mixed data. In any
case, the experiments clearly demonstrate that, de-
spite substantial developments in the field of synthe-
sis, synthetic training data should always be used with
caution, especially when synthetic data is used to re-
place only data of a single class. There is always the
risk that a deep learning based classifier learns to dif-
ferentiate based on model-specific characteristics and
not, as intended, based on class-specific features.
The employed FP removal techniques did not
work as intended and were unable to bridge the gap
between real and synthetic data. In future work,
we therefore plan to develop better FP removal tech-
niques.
ACKNOWLEDGEMENTS
This work has been partially supported by the
Salzburg State Government within the Science and In-
novation Strategy Salzburg 2025 (WISS 2025) under
the project AIIV Salzburg (Artificial Intelligence in
Industrial Vision), project no 20102-F2100737- FPR.
REFERENCES
Carlini, N., Hayes, J., Nasr, M., Jagielski, M., Sehwag, V.,
Tramèr, F., Balle, B., Ippolito, D., and Wallace, E.
(2023). Extracting training data from diffusion mod-
els.
Chen, Y., Yang, X.-H., Wei, Z., Heidari, A. A., Zheng, N.,
Li, Z., Chen, H., Hu, H., Zhou, Q., and Guan, Q.
(2022). Generative adversarial networks in medical
image augmentation: A review. Computers in Biology
and Medicine, 144:105382.
Corvi, R., Cozzolino, D., Poggi, G., Nagano, K., and Ver-
doliva, L. (2023). Intriguing properties of synthetic
images: from generative adversarial networks to dif-
fusion models.
Dhariwal, P. and Nichol, A. (2021). Diffusion models beat
gans on image synthesis. Advances in neural informa-
tion processing systems, 34:8780–8794.
Elreedy, D. and Atiya, A. F. (2019). A comprehensive
analysis of synthetic minority oversampling technique
(smote) for handling class imbalance. Information
Sciences, 505:32–64.
Frank, J., Eisenhofer, T., Schönherr, L., Fischer, A.,
Kolossa, D., and Holz, T. (2020). Leveraging fre-
quency analysis for deep fake image recognition. In
International conference on machine learning, pages
3247–3258. PMLR.
Heusel, M., Ramsauer, H., Unterthiner, T., Nessler, B., and
Hochreiter, S. (2017). Gans trained by a two time-
scale update rule converge to a local nash equilibrium.
Advances in neural information processing systems,
30.
Ho, J., Jain, A., and Abbeel, P. (2020). Denoising diffusion
probabilistic models. Advances in neural information
processing systems, 33:6840–6851.
Li, G., Ji, Z., Qu, X., Zhou, R., and Cao, D. (2022). Cross-
domain object detection for autonomous driving: A
stepwise domain adaptative yolo approach. IEEE
Transactions on Intelligent Vehicles, 7(3):603–615.
Man, K. and Chahl, J. (2022). A review of synthetic im-
age data and its use in computer vision. Journal of
Imaging, 8(11).
Qiu, H., Yu, B., Gong, D., Li, Z., Liu, W., and Tao, D.
(2021). Synface: Face recognition with synthetic data.
In Proceedings of the IEEE/CVF International Con-
ference on Computer Vision, pages 10880–10890.
Saharia, C., Chan, W., Chang, H., Lee, C., Ho, J., Sali-
mans, T., Fleet, D., and Norouzi, M. (2022a). Palette:
Image-to-image diffusion models. In ACM SIG-
GRAPH 2022 Conference Proceedings, pages 1–10.
Saharia, C., Ho, J., Chan, W., Salimans, T., Fleet, D. J., and
Norouzi, M. (2022b). Image super-resolution via iter-
ative refinement. IEEE Transactions on Pattern Anal-
ysis and Machine Intelligence, 45(4):4713–4726.
Song, Y., Sohl-Dickstein, J., Kingma, D. P., Kumar, A.,
Ermon, S., and Poole, B. (2020). Score-based gen-
erative modeling through stochastic differential equa-
tions. arXiv preprint arXiv:2011.13456.
Tan, M. and Le, Q. (2019). Efficientnet: Rethinking model
scaling for convolutional neural networks. In Interna-
tional conference on machine learning, pages 6105–
6114. PMLR.
Torfi, A., Fox, E. A., and Reddy, C. K. (2022). Differen-
tially private synthetic medical data generation using
convolutional gans. Information Sciences, 586:485–
500.
Wesselkamp, V., Rieck, K., Arp, D., and Quiring, E. (2022).
Misleading deep-fake detection with gan fingerprints.
In 2022 IEEE Security and Privacy Workshops (SPW),
pages 59–65, Los Alamitos, CA, USA. IEEE Com-
puter Society.
Zhang, H., Grimmer, M., Ramachandra, R., Raja, K., and
Busch, C. (2021). On the applicability of synthetic
data for face recognition. In 2021 IEEE International
Workshop on Biometrics and Forensics (IWBF), pages
1–6. IEEE.
Zhu, J., Zhang, R., Pathak, D., Darrell, T., Efros,
A. A., Wang, O., and Shechtman, E. (2017). To-
ward multimodal image-to-image translation. CoRR,
abs/1711.11586.
VISAPP 2024 - 19th International Conference on Computer Vision Theory and Applications
206
