
Using Retrieval Augmented Generation to Build the Context for
Data-Driven Stories
Angelica Lo Duca
a
Institute of Informatics and Telematics, National Research Council, via G. Moruzzi 1, 56124 Pisa, Italy
Keywords: Data Storytelling, Retrieval Augmented Generation, Data Visualization, Generative AI.
Abstract: Data Storytelling (DS) is building data-driven stories to communicate the result of a data analysis process
effectively. However, it may happen that data storytellers lack the competences to build compelling texts to
include in the data-driven stories. In this paper, we propose a novel strategy to enhance DS by automatically
generating context for data-driven stories, leveraging the capabilities of Generative AI (GenAI). This
contextual information provides the background knowledge necessary for the audience to understand the
story's message fully. Our approach uses Retrieval Augmented Generation (RAG), which adapts large
language models (LLMs), the core concept behind GenAI, to the specific domain required by a data-driven
story. We demonstrate the effectiveness of our method through a practical case study on salmon aquaculture,
showcasing the ability of GenAI to enrich DS with relevant context. We also describe some possible strategies
to evaluate the generated context and ethical issues may raise when using GenAI in DS.
1 INTRODUCTION
Data Storytelling (DS) is communicating data in a
way that is both accessible and memorable (Knaflic
2015). Using stories to contextualize and humanize
data can make it more relatable and meaningful to our
audience (Dykes 2019). Data-driven stories are often
built by data analysists at the end of their process of
data analysis to communicate their results non-
technical experts. Although data analysists have a
deep understanding of the data analysis field, they
may lack the competences to build compelling texts
to include in their data-driven stories.
This is where generative AI (GenAI) can play a
transformative role. GenAI is a subfield of Artificial
Intelligence (AI) that generates new content (text,
images, and voice) based on an input text (Gozalo-
Brizuela 2023). Referring to DS, GenAI can be used
in different ways. If we consider a data-driven story
composed of tasks (e.g., story planning, execution,
and communication), we could use GenAI in different
ways to implement a task: as a creator, an optimizer,
a reviewer, or an assistant (Li 2023-2).
GenAI can help data storytellers extract insights
by discovering patterns and correlations among data
samples and identifying anomalies. It can also
a
https://orcid.org/0000-0002-5252-6966
generate relevant context related to the extracted
insights regarding textual annotations, images
reinforcing the described concepts, and voice.
Finally, GenAI can fine-tune the story's next steps by
anchoring it to an ethical framework.
In this paper, we define a strategy to use GenAI to
generate context to incorporate in a data-driven story.
The story context is the background the audience
requires to understand a data-driven story. For
example, if a story talks about the problem of salmon
aquaculture in the U.S., the context is the underlying
situation among salmons, such as the aquaculture
regulations, any previous illness situation, and so on.
In detail, in this paper, we propose a strategy to
use Retrieval Augmented Generation (RAG) (Lewis
2020) to generate the textual context for a data-driven
story. RAG is a technique for adapting a Large
Language Model (LLM), the model behind GenAI, to
a specific domain. After describing the architecture of
the proposed approach, we also describe a practical
case study related to salmon aquaculture.
Using RAG may not produce the desired results
thus it is important to always check the produced
output. We will discuss different strategies to
evaluate the output produced by RAG.
690
Lo Duca, A.
Using Retrieval Augmented Generation to Build the Context for Data-Driven Stories.
DOI: 10.5220/0012419700003660
Paper published under CC license (CC BY-NC-ND 4.0)
In Proceedings of the 19th International Joint Conference on Computer Vision, Imaging and Computer Graphics Theory and Applications (VISIGRAPP 2024) - Volume 1: GRAPP, HUCAPP
and IVAPP, pages 690-696
ISBN: 978-989-758-679-8; ISSN: 2184-4321
Proceedings Copyright © 2024 by SCITEPRESS – Science and Technology Publications, Lda.

Using GenAI may also generate some ethical
risks, especially in the field of DS, where it could be
used to create fake or biased stories to manipulate an
audience. In this paper, we also discuss some possible
ethical challenges raised by GenAI when applied to
DS.
The remainder of the paper is organized as
follows. In Section 2, we describe the related
literature. Section 3 describes the concept of context
in DS, and Section 4 the proposed approach to
incorporate GenAI in DS. Section 5 illustrates a case
study, and Section 6 discusses some possible
consequences and Section 7 some ethical issues
related to the incorporation of GenAI in DS. Finally,
Section 8 gives conclusions.
2 RELATED WORK
GenAI is a revolutionary technology with the
potential to modernize software product management
by automating tasks, improving efficiency, and
enhancing customer experience (Peng et al., 2023;
Siggelkow & Terwiesch, 2023).
Research in GenAI is rapidly evolving, and every
day a significant amount of scientific papers is
published about this topic. Although GenAI is a very
young research field, many works exist in the
literature, covering a variety of tasks from storytelling
(Akoury 2020, Nichols 2020) to code synthesis
(Austin 2021) and email auto-completion (Yonghui
2018). AI for storytelling is used mainly in education
(Ali 2021, Crompton 2022, Han 2023) and co-writing
(Yuan 2022).
Referring to using GenAI for DS, there are two
preliminary papers by Haotian Li et al. The first paper
describes a systematic review of data storytelling
tools that support human-AI collaboration. The paper
also recognizes common collaboration patterns, such
as human-led creation with AI assistance, AI-led
creation with human optimization, and human-AI co-
creation (Li 2023-1). The second paper describes the
results of a questionnaire asking data storytellers their
intention to use AI tools to build stories (Li 2023-2).
Another contribution to the topic is by Lo Duca, who
theorized a possible application combining GenAI
tools and DS (Lo Duca 2023). The same author also
wrote a book about a practical integration of GenAI
and DS (Lo Duca 2024).
Considering the broader topic of DS, the literature
is varied and covers different aspects, such as the role
of rhetoric in building narratives (Hullman 2011,
Hullman 2013). A great effort has been made to
identify commonly used approaches to build stories
in the media and news field. Segel and Heer propose
seven genres of narrative visualization for newspaper
stories: magazine style, annotated chart, partitioned
poster, flow chart, comic strip, slide show, and video
(Segel 2010). The approaches proposed by Segel and
Heer are limited to the specific scenario of
newspapers. Other scenarios would require additional
approaches and critical evaluation of the
effectiveness of the built stories (Kosara 2013).
Lundgard & Satyanarayan organized the semantic
content of textual descriptions of charts into four
levels: enumerating visualization construction
properties, reporting statistical concepts and
relations, identifying perceptual and cognitive
phenomena, and explaining domain-specific insights
(Lundgard 2021).
To the best of our knowledge, this paper is the
first tentative of incorporating RAG in DS.
3 THE CONCEPT OF CONTEXT
IN DS
Context is the set of information required by an
audience to understand a data-driven story and
depends on the type of audience you are faced with
(Lo Duca 2024). For example, if we talk with an adult
about how much we paid for a product, we do not
need to explain how money works. Instead, if we talk
to our kids about the same topic, we probably need to
explain the denominations of the different banknotes
and how the monetary system works.
In the remainder of this section, we describe the
main types of context and audiences.
3.1 Types of Contexts
There are different types of context: commentary,
annotation, image, and symbols.
A commentary is a text that precedes the main
point or insight of a data-driven story. It includes the
background that helps the audience to set the scene
and understand the insight. In the example of the
product cost explained to our kids, the commentary
includes banknotes denominations, and how the
monetary system works.
An annotation is a short text explaining a chart's
detail, for example, an anomalous point or a trendline.
An image is a picture enforcing the commentary
or the annotation. In the example of the product cost,
we could add banknote images to help our kids
understand the different denominations.
Using Retrieval Augmented Generation to Build the Context for Data-Driven Stories
691
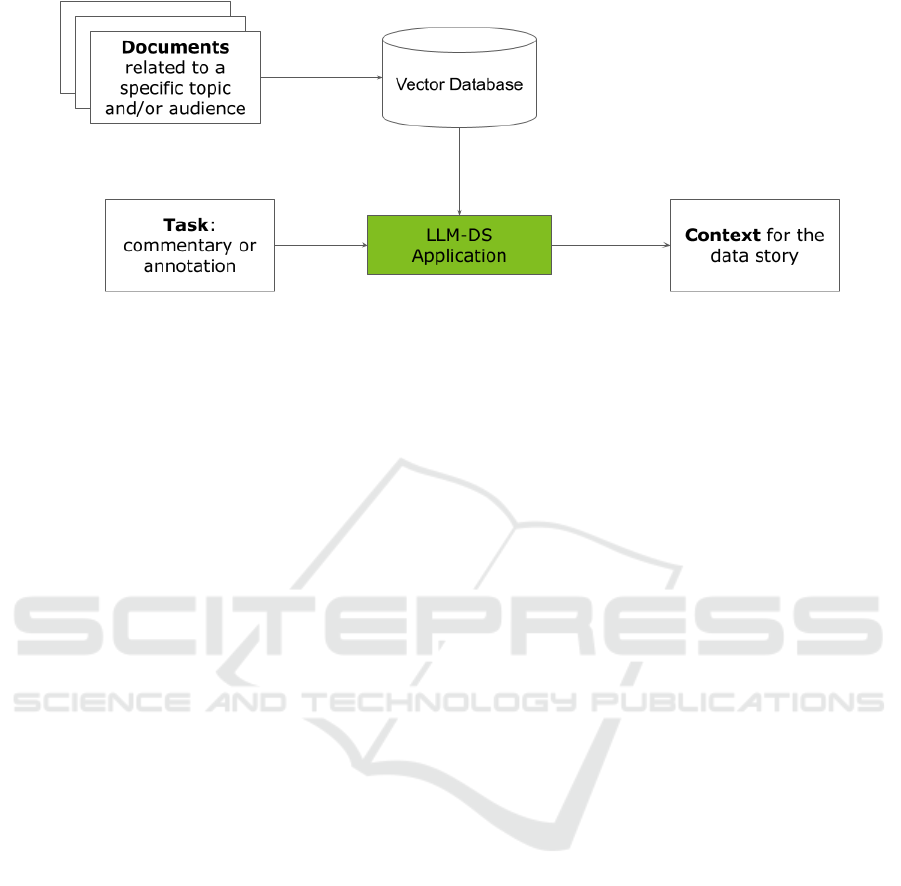
Figure 1.
Symbols include arrows, circles, lines, and so on,
combined with annotations. They help the audience
focus on particular points of a chart.
This paper will focus only on commentaries and
annotations because they are texts. We reserve to
future work the incorporation of symbols and images,
as GenAI evolves.
3.2 Types of Audiences
The audience is the person or group reading or
listening to a data-driven story. Understanding the
target audience is crucial to building data stories that
convey information effectively (Dykes 2019). For
simplicity, in this paper, we consider three common
types of audiences: the general public, executives,
and professionals.
The general public includes individuals from
various backgrounds and levels of knowledge. They
may have little to no previous knowledge of the topic
of our data story. When crafting data stories for the
general public, we should use precise language, avoid
overwhelming them with too much information, and
focus on presenting the most relevant insights
visually and engagingly.
Executives are typically high-level decision-
makers in organizations who rely on data-driven
insights to make essential business choices. They
often have limited time and need concise and
actionable information. When creating data stories
for executives, it is essential to present key findings,
trends, and recommendations upfront.
Professionals comprise individuals with a specific
domain expertise or professional background. They
have a deeper understanding of data and require more
analytical information. When creating data stories for
professionals, explain the data analysis's
methodology, assumptions, and limitations.
4 THE PROPOSED APPROACH
The proposed approach consists of adapting LLMs to
the specific domain required by the data-driven story
and using the adapted model to generate the context
of the story. For domain adaptation, we use Retrieval
Augmented Generation (RAG). RAG is an advanced
Natural Language Processing (NLP) technique
combining information retrieval and text generation
elements. There are other techniques to adapt LLMs
to a specific domain, such as fine-tuning and
parameter efficiency tuning (Zhang 2023). We
reserve to future work their analysis.
First, RAG performs a retrieval step, which
queries an external knowledge source, such as a vast
text corpus or a structured database. Next, RAG uses
this knowledge source to enhance its response
generation. RAG integrates the retrieved facts into its
generated text.
In the DS domain, we can use RAG to adapt our
LLM to our specific topic, such as a product, real-
time data, customer reviews, and other relevant
information. For instance, by querying the knowledge
base for specific product details, we can generate ad-
hoc commentaries and annotations.
Figure 1 shows the architecture of the RAG
system adapted for DS.
The system receives as input one or more
documents related to a specific topic and or/audience.
For example, to build a data-driven story about
salmon aquaculture, we must provide the system with
documents related to the salmon aquaculture topic,
such as aquaculture regulations, statistics, and so on.
In addition, if we want to tailor the story to a specific
audience, we can also add specific documents related
to that audience to make our system use the same
audience language and terminology. All the domain-
specific documents are given as input to a vector
IVAPP 2024 - 15th International Conference on Information Visualization Theory and Applications
692
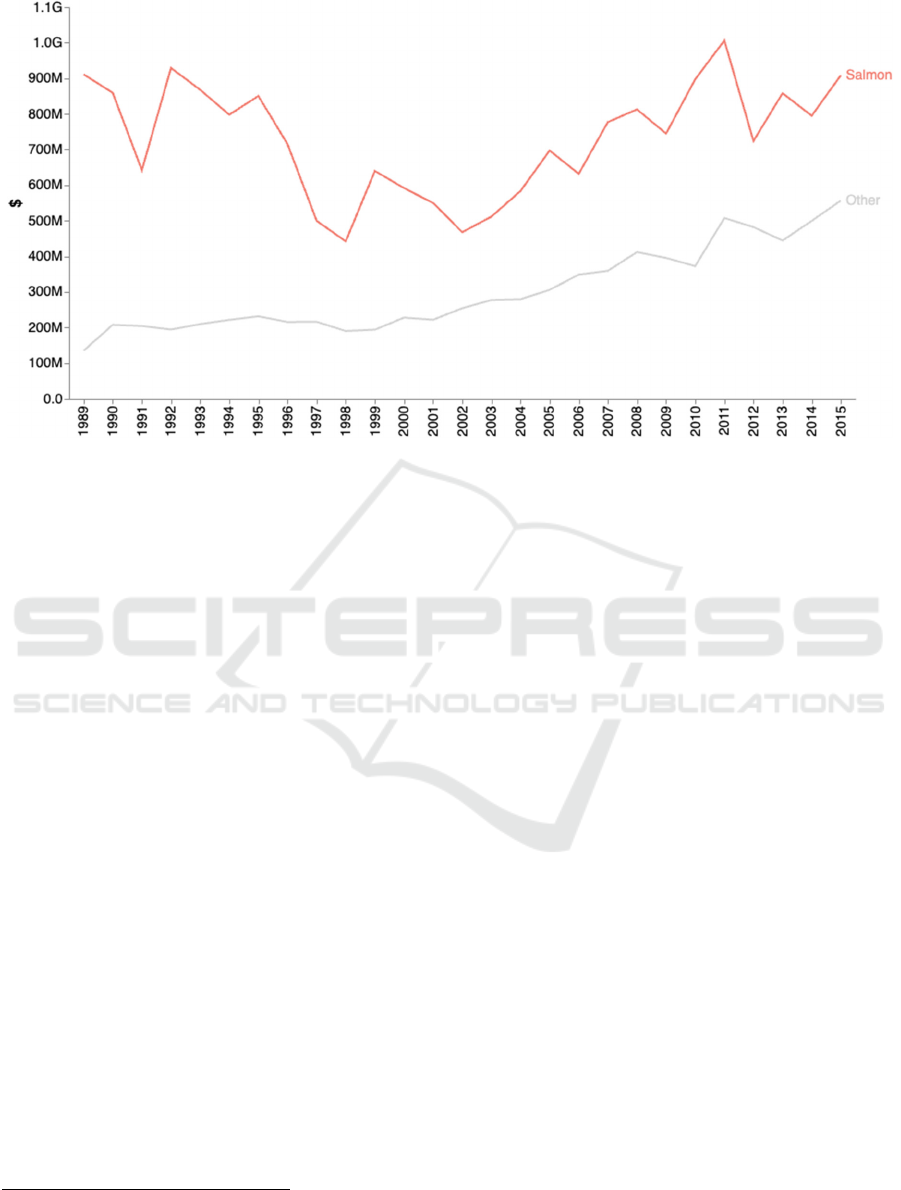
Figure 2.
database, which indexes them and makes them ready
for consumption by the LLM-DS Application. This
application, which is the core of the system, also
receives as an input prompt the task to perform. The
task is a text that describes the action to perform, such
as generating a commentary or an annotation, the
desired output length, a possible style, and so on. As
the final output, the LLM-DS Application produces
the desired context, which the storyteller must always
verify before using.
5 CASE STUDY
The case study involves building a data-driven story
for professionals around the safety problem in salmon
aquaculture in the U.S. We use data provided by the
Department of Agriculture, Economic Research
Service under the CC-0 license
2
. We decided to plot
the salmon aquaculture sales trendline versus the
other types of aquaculture. As an insight, we
discovered that since 1998 there has been an increase
in sales, following a period of decrease in sales from
1992 to 1998. We discovered that the decreasing
period was partially due to some health problems in
the salmon aquaculture. Figure 2 shows a chart
containing the described data.
To apply the framework described in Figure 1, we
will add a commentary to the chart. Our commentary
2
https://data.world/agriculture/aquaculture-data
3
https://www.fda.gov/food/seafood-guidance-documents-
regulatory-information/aquacultured-seafood
will explain how safety works in the U.S. aquaculture.
We will build the commentary based on the
Aquacultured Seafood document
3
, an official United
States government website. This document describes,
among other aspects, the safety of aquaculture
seafood. Since the document is written formally, we
consider it already tailored to a public of
professionals, so we will not search for other
documents to tailor the story for a specific audience.
We implement the RAG-based system that builds
the required commentary using the architecture
described in Figure 1. Technically speaking, we used
LangChain
4
to build the LLM-DS application,
Chroma DB
5
for the vector database, and GPT-3.5-
turbo
6
as underlying LLM.
Once we have imported the document into the
vector database, we build the task using the following
prompt template:
You are a bot that generates commentaries of
200 characters for graphs based on the context
and question provided. If you don't know the
answer, simply state that you don't know.
{context}
question: {question}
Next, we use our document as a context and the
following text as a question: Describe the Safety of
4
https://www.langchain.com/
5
https://www.trychroma.com/
6
https://platform.openai.com/docs/models/gpt-3-5
Using Retrieval Augmented Generation to Build the Context for Data-Driven Stories
693

Aquaculture Seafood in the U.S.. The following text
shows the produced commentary:
Aquaculture seafood in the U.S. is regulated
by the FDA to ensure safety. Strict standards
are in place to monitor water quality, feed,
and disease control. Regular inspections and
testing are conducted to minimize risks and
protect consumers.
After reviewing the generated commentary, we can
now insert it in the chart. As an example, for
comparison, we show a possible output generated by
ChatGPT
7
, a general-purpose LLM using the
following prompt:
You are a bot that generates commentaries of
200 characters for graphs. Describe the
Safety of Aquaculture Seafood in the U.S.
In our experiment, ChatGPT produced the following
output:
The safety of aquaculture seafood in the U.S.
appears robust with stringent regulations and
monitoring, ensuring consumers enjoy low-
risk, high-quality products.
Our system produced a more specific commentary
than ChatGPT because it refers to a specific regulator
system (FDA).
For completeness, Figure 3 shows the final chart
enriched with the produced context. We have also
added an annotation highlighting the decreasing
period.
6 DISCUSSION
The case study described in the previous section
shows that using RAG for generating context means
providing a longer text as an input for the LLM,
helping the model to focus better the context.
However, providing a longer text as an input may not
be necessarily connected to a better output. For this
reason, we should evaluate the produced output.
Validation could be performed in terms of: a)
benchmarking with existing models b) human
evaluation of produced outputs, c) custom metrics for
narrative quality.
6.1 Benchmarking with Existing
Models
Benchmarking with existing models means
comparing the produced output by a RAG-based
model with that produced by a general-purpose
7
https://chat.openai.com/
model. If the produced output by the RAG-based
model is better than that produced by the general-
purpose model, this means that using RAG has helped
to build a better output. Otherwise, it is sufficient to
use the general-purpose model for context building.
This type of evaluation could be performed using
some predefined metrics or a human judgment.
6.2 Human Evaluation of Produced
Outputs
Human should always control the quality of the text
produced by the LLM to avoid problems such as
hallucinations (Rawte 2023), bias (Baer 2019) or
other undesirable outputs that might propagate errors.
Hallucination happens when an LLM generates
content that does not correspond to reality.
Hallucinations within AI can lead to the creation of
misleading or entirely fabricated data, potentially
causing significant ethical concerns. In his book, Baer
defines bias as an inclination or a prejudice for or
against a person or a group, especially in a way to be
considered unfair (Baer 2019).
Human evaluation of the produced output should
follow some specific criteria. We demand to future
work the analysis of this aspect.
6.3 Custom Metrics for Narrative
Quality
To evaluate the quality of the produced output, we
should define some metrics. In 2004, Beattie et al
described a methodology to evaluate narratives in
annual reports (Beattie 2004). In a more recent paper,
Pawar et al. define three metrics: readability,
perplexity, and essay grading (Pawar 2023).
Readability is a measure of how easy a text is to read
and understand. Perplexity is a measure of how well
a probabilistic model predicts a sample. Essay
grading is a process of evaluating and assigning a
score to an essay based on a set of criteria. Essay
grading can be done by human raters or by automated
systems.
7 ETHICAL IMPLICATIONS
Using GenAI in DS can raise ethical issues (Stahl
2024). When using generative AI in data storytelling,
we should consider at least two primary ethical
issues: bias and misinformation.
IVAPP 2024 - 15th International Conference on Information Visualization Theory and Applications
694
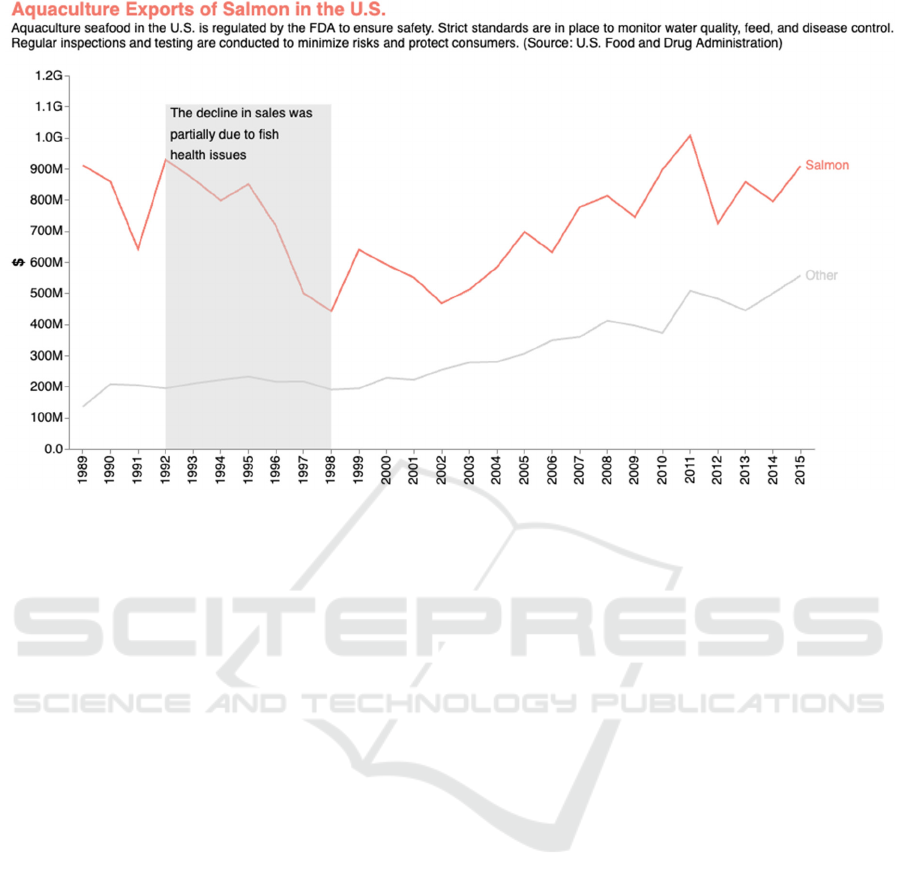
Figure 3.
Firstly, bias in AI refers to systemic and
unjustified preferences, stereotypes, or prejudices in
AI systems due to altered training data (Roselli 2019).
This can result in narratives that inadvertently
perpetuate stereotypes or unfair representations of
certain groups, undermining the objectivity and
fairness of data stories.
Secondly, misinformation can arise when AI
systems generate plausible-sounding content that
does not correspond with reality. This may lead to
disseminating misleading information and building
fake data stories that seem plausible.
To overcome these ethical issues, one approach is
to review the content produced by generative AI
tools.
8 CONCLUSIONS
In this paper, we presented a novel strategy for
generating context for data-driven stories using
GenAI. We demonstrated how to generate relevant
contextual information that enhances the storytelling
process automatically. Our approach can potentially
provide a more comprehensive and engaging way to
communicate data insights. We validated our method
through a practical case study on salmon aquaculture.
In future work, we plan to explore further using
different GenAI techniques, such as fine-tuning and
parameter efficiency tuning, to enhance the generated
context's quality and creativity. In addition, we aim to
investigate more deeply the ethical implications of
using GenAI in DS, ensuring that generated content
is unbiased, fair, and transparent. Finally, we intend
to develop a comprehensive framework for
integrating GenAI into the DS process, enabling
seamless collaboration between data storytellers and
AI systems.
REFERENCES
Akoury, N., Wang, S., Whiting, J., Hood, S., Peng, N., &
Iyyer, M. (2020). Storium: A dataset and evaluation
platform for machine-in-the-loop story generation.
arXiv preprint arXiv:2010.01717.
Ali, S., DiPaola, D., Lee, I., Hong, J., & Breazeal, C. (2021,
May). Exploring generative models with middle school
students. In Proceedings of the 2021 CHI Conference
on Human Factors in Computing Systems (pp. 1-13).
Austin, J., Odena, A., Nye, M., Bosma, M., Michalewski,
H., Dohan, D., ... & Sutton, C. (2021). Program
synthesis with large language models. arXiv preprint
arXiv:2108.07732.
Baer, T. (2019). Understand, manage, and prevent
algorithmic bias: A guide for business users and data
scientists. New York, NY: Apress.
Beattie, V., McInnes, B., & Fearnley, S. (2004, September).
A methodology for analysing and evaluating narratives
in annual reports: a comprehensive descriptive profile
and metrics for disclosure quality attributes. In
Using Retrieval Augmented Generation to Build the Context for Data-Driven Stories
695

Accounting forum (Vol. 28, No. 3, pp. 205-236). No
longer published by Elsevier.
Dykes, B. (2019). Effective data storytelling: how to drive
change with data, narrative and visuals. John Wiley &
Sons.
Gozalo-Brizuela, R., & Garrido-Merchan, E. C. (2023).
ChatGPT is not all you need. A State of the Art Review
of large Generative AI models. arXiv preprint
arXiv:2301.04655.
Hullman, J., & Diakopoulos, N. (2011). Visualization
rhetoric: Framing effects in narrative visualization.
IEEE transactions on visualization and computer
graphics, 17(12), 2231-2240.
Hullman, J., Drucker, S., Riche, N. H., Lee, B., Fisher, D.,
& Adar, E. (2013). A deeper understanding of sequence
in narrative visualization. IEEE Transactions on
visualization and computer graphics, 19(12), 2406-
2415.
Knaflic, C. N. (2015). Storytelling with data: A data
visualization guide for business professionals. John
Wiley & Sons.
Kosara, R., & Mackinlay, J. (2013). Storytelling: The next
step for visualization. Computer, 46(5), 44-50.
Lewis, P., Perez, E., Piktus, A., Petroni, F., Karpukhin, V.,
Goyal, N., ... & Kiela, D. (2020). Retrieval-augmented
generation for knowledge-intensive nlp tasks.
Advances in Neural Information Processing Systems,
33, 9459-9474.
Li, H., Wang, Y., & Qu, H. (2023-1). Where Are We So
Far? Understanding Data Storytelling Tools from the
Perspective of Human-AI Collaboration. arXiv preprint
arXiv:2309.15723.
Li, H., Wang, Y., Liao, Q. V., & Qu, H. (2023-2). Why is
AI not a Panacea for Data Workers? An Interview
Study on Human-AI Collaboration in Data Storytelling.
arXiv preprint arXiv:2304.08366.
Lo Duca, A. (2023). Towards a Framework for AI-Assisted
Data Storytelling. In 19th International Conference on
Web Information Systems and Technologies
(WEBIST), Roma, Italy, 17-17 November 2023
Lo Duca, A. (2024). AI-Powered Data Storytelling in
Python with Altair. Manning Publications. ISBN: 978-
1633437920. https://www.manning.com/books/ai-
powered-data-storytelling
Lundgard, A., & Satyanarayan, A. (2021). Accessible
visualization via natural language descriptions: A four-
level model of semantic content. IEEE transactions on
visualization and computer graphics, 28(1), 1073-1083.
Pawar, S., Palshikar, G., Jain, A., Singh, M., Rangarajan,
M., Agarwal, A., ... & Singh, K. (2023, July).
Evaluation Metrics for Depth and Flow of Knowledge
in Non-fiction Narrative Texts. In Proceedings of the
The 5th Workshop on Narrative Understanding (pp. 16-
24).
Peng, S., Kalliamvakou, E., Cihon, P., & Demirer, M.
(2023). The impact of AI on developer productivity:
Evidence from github copilot. arXiv preprint
arXiv:2302.06590 https://doi.org/10.48550/arXiv.
2302.06590
Rawte, V., Sheth, A., & Das, A. (2023). A survey of
hallucination in large foundation models. arXiv preprint
arXiv:2309.05922.
Roselli, D., Matthews, J., & Talagala, N. (2019, May).
Managing bias in AI. In Companion Proceedings of The
2019 World Wide Web Conference (pp. 539-544).
Segel, E., & Heer, J. (2010). Narrative visualization:
Telling stories with data. IEEE transactions on
visualization and computer graphics, 16(6), 1139-1148.
Siggelkow, N., & Terwiesch, C. (2023, April 4). Create
winning customer experiences with generative AI.
Harvard Business Review. https://www.hbr.org/
2023/04/create-winning-customer-experiences-with-
generative-ai
Stahl, B. C., & Eke, D. (2024). The ethics of ChatGPT–
Exploring the ethical issues of an emerging technology.
International Journal of Information Management, 74,
102700.
Yonghui W. (2018). Smart compose: Using neural
networks to help write emails. Google AI Blog.
Yuan, A., Coenen, A., Reif, E., & Ippolito, D. (2022,
March). Wordcraft: story writing with large language
models. In 27th International Conference on Intelligent
User Interfaces (pp. 841-852).
Zhang, S., Dong, L., Li, X., Zhang, S., Sun, X., Wang, S.,
... & Wang, G. (2023). Instruction tuning for large
language models: A survey. arXiv preprint
arXiv:2308.10792.
IVAPP 2024 - 15th International Conference on Information Visualization Theory and Applications
696
