
Climate-Friendly Online Shopping Within the Green eCommerce
Project: A Fitting Tool to Determine T-Shirt Sizes Using Active Depth
Sensing
Alexander K. Seewald
1
, Thomas Wernbacher
3
, Thomas Winter
4
, Mario Platzer
2
and Alexander Pfeiffer
3
1
Seewald Solutions GmbH, L
¨
archenstraße 1, 4616 Weißkirchen a.d. Traun, Austria
2
yVerkehrsplanung GmbH, Brockmanngasse 55, 8010 Graz, Austria
3
Universit
¨
at f
¨
ur Weiterbildung Krems, Dr.-Karl-Dorrek-Straße 30, 3500 Krems, Austria
4
Liberacerta e.U., Am Lindenhof 37/11, 8043 Graz, Austria
alexander.pfeiffer@donau-uni.ac.at
Keywords:
AI for Green, Characterizing Returns, Fitting Tool, Depth Cameras.
Abstract:
Within the context of the Green eCommerce project where we build tailored add-ons for webshops to in-
crease climate-friendly shipping, we analyzed reasons for returns using a modified rule learning algorithm
but found no actionable rules. However, since many returns are driven by wrong size information, we have
also developed a prototype Fitting Tool app that uses active depth sensing to measure several relevant body
measurements and uses these to estimate T-Shirt sizes. Although these body measurements could be shown
to be quite precise, T-Shirt sizes could only be predicted at low accuracy. On the other hand, self-reporting by
test users showed that the perceived accuracy was considered 1.5-3x higher. Analyzing this issue, it was found
that the reason for this is most likely manufacturer bias in reported size, which will be addressed in future
work.
1 INTRODUCTION
In recent years, online shopping has increased rapidly.
This trend was also being fuelled by the Covid 19 pan-
demic and, according to many experts, will continue
unabated in the future. As a result, e-commerce in the
Business-to-Consumer (B2C) sector recorded record
figures in 2021 in terms of turnover (9.6 billion eu-
ros in Austria according to Knabl et al. (2021)) and
in terms of postal parcels delivered (Sievering, 2020).
However, this flood of parcels goes hand in hand with
the many negative consequences of a rapidly grow-
ing volume of goods transport on the last mile, which
manifest themselves in traffic jams, noise pollution,
air pollution and a decreasing quality of stay in public
spaces.
Many study authors (BMVIT, 2015; DCTI, 2015;
BMK, 2020; Kolf, 2021) come to the conclusion that
online shopping only has a better ecological balance
than shopping in stationary retail stores under opti-
mal framework conditions (e.g. promotion of collec-
tive orders, climate-friendly means of transport and
avoidance of return shipments and same-day deliver-
ies). However, the package delivery situation is cur-
rently characterized by frequent multiple deliveries,
climate-damaging and underutilised means of trans-
port and, above all, high return rates, which amount
to up to 47% in the Austrian clothing sector (Kn-
abl et al., 2021). On the demand side, the situa-
tion is aggravated by the fact that end consumers in
online shops are often offered no or only very lim-
ited climate-friendly delivery options, which contra-
dicts the increasing sustainability awareness (Holt-
mann and Klitzsch, 2021) of many end customers.
This is where the preventive and customer-
oriented approach of the Green eCommerce research
project (Wernbacher et al., 2023) comes in. Within
a continuation of the previous project Think!First
(Wernbacher et al., 2019), contextually tailored add-
ons based on behavioural, technology-based and lo-
gistical interventions for the existing online shops of
the participating partners are designed, developed and
tested in practice. With the help of an unique com-
bination of a gamified loyalty system that rewards
920
Seewald, A., Wernbacher, T., Winter, T., Platzer, M. and Pfeiffer, A.
Climate-Friendly Online Shopping Within the Green eCommerce Project: A Fitting Tool to Determine T-Shirt Sizes Using Active Depth Sensing.
DOI: 10.5220/0012419500003636
Paper published under CC license (CC BY-NC-ND 4.0)
In Proceedings of the 16th International Conference on Agents and Artificial Intelligence (ICAART 2024) - Volume 3, pages 920-927
ISBN: 978-989-758-680-4; ISSN: 2184-433X
Proceedings Copyright © 2024 by SCITEPRESS – Science and Technology Publications, Lda.

users for high compliance, persuasive design princi-
ples that are characterized by visually highlighting re-
gional products with short delivery routes or collec-
tive orders, as well as AI-supported fitting tools and
chat bots that automatically measure clothing sizes
and point out environmentally friendly delivery op-
tions, customers are encouraged to shop more con-
sciously – in the sense of a traffic shift, traffic avoid-
ance and traffic optimisation.
Through the active participation of the practical
partners Julius Meinl am Graben, kauftregional and
ZERUM, the innovative add-ons can be tested com-
prehensively and practically for different objectives,
target groups and different product groups in real op-
erations over several months. In addition, the inte-
gration of the innovative logistics service Green to
Home from logistics partner ERIVE makes it possible
to analyze the entire process between online shop op-
erators, online end consumers, and package delivery
service providers. Thus, this holistic approach gen-
erates new and in-depth insights into the acceptance,
suitability and impact of innovative interventions in
online shops.
Non-fitting garments are also a known factor to
strongly drive returns (Kristensen et al., 2013; Singh,
2015). To obtain precise body measurements, we de-
veloped a Fitting Tool in cooperation with partner
ZERUM. The Fitting Tool is an Android app that runs
on a small subset of mobile phones with active depth
sensing cameras. Due to the ability of such cameras
to exactly measure distances it was possible to rapidly
develop a prototype app to obtain body measurements
directly from depth images, using a pretrained body
pose keypoint detector.
In this paper we focus on reducing returns, both
by characterizing rules and by obtaining precise body
measurements using the Fitting Tool. We initially de-
scribe our results on using understandable machine
learning to analyze reasons for returns. In this project,
only ZERUM tracked and expressed concerns with
high returns, so we focus on its returns data. The anal-
ysis follows (Seewald et al., 2019) and also uses the
modified rule learning algorithm presented there.
Concerning the Fitting Tool, we first present an
algorithm to exactly measure body sizes from depth
camera images and body pose estimates and evaluate
its accuracy on a small set of persons. We then use
a subset of these measurements to determine T-shirt
sizes using a standard size table as well as machine
learning algorithms.
2 RELATED RESEARCH
Zalando Corporate (2023) introduced a new feature in
their app that measures body shape by one front and
one side photo of a person in tight-fitting clothes. It
is based on technology by company Fision which was
acquired by Zalando in 2020. Processing is locally
on the smartphone and photos are deleted afterwards.
The exact measurements are then used to search for
fitting clothes. Currently, only women’s tops – includ-
ing dresses – can be searched for. Contrary to our ap-
proach, their approachs works on any smartphone and
does not require special sensors. However, no quan-
tative data on the precision of the obtained measure-
ments were reported and the integrated search is likely
optimized to deal with the expected inaccurate mea-
surements. The requirement for tight-fitting clothes is
something that our system also needs as depth cam-
eras cannot see through clothes.
Singh (2015) analyzed reasons for returns within
Indian online market Flipkart, where mainly wom-
ens’ garments are sold directly by the manufacturers.
Apart from a detailed analysis of returns reasons they
also provided a minimal set of measurements for size
tables to reduce returns.
1
Simply changing the shown
size tables for nine manufacturers according to his
recommendations reduced returns dramatically: An
average reduction of absolute returns rate of 9% was
reported with a maximum of 46% – so manufacturers
saw their returns rate at best almost halved. They also
provided an analysis of returns reasons due to prod-
uct quality issues which were also a major cause for
returns within this online market, albeit less relevant
for our project.
Kristensen et al. (2013) present TrueFit, a sys-
tem to determine precise body measurements which
can reduce returns by up to 30%. However it re-
quires much effort by potential customers. TrueFit
works by combining extensive information provided
by customers on their height, age, weight as well as a
set of previously bought fitting clothes with manufac-
turer, model type and given size to determine best fit.
While it therefore tries to compensate both customer
and manufacturer bias, in its present form it ignores
body size temporal drift (i.e. changes in body size
over time).
Toktay (2003) analyzed different models to pre-
dict returns via synthetic data. They differentiated be-
tween modelling via periodical data where only the
number of sold and returned products is known (i.e.
1
Minimal set of measurements: breast width, waist cir-
cumference, shoulder circumference, sleeve diameter at
3
4
height; provide at least UK, US and EU-Sizes and at least
S,M,L,XL,XXL for simple sizes.
Climate-Friendly Online Shopping Within the Green eCommerce Project: A Fitting Tool to Determine T-Shirt Sizes Using Active Depth
Sensing
921

where it is not possible to identify products and de-
termine exactly which products were returned), and
modelling via individual data on product level (i.e.
where such a identification is feasible). For the sec-
ond case – which corresponds to our data – they pro-
posed an Expectation Maximization model. No ex-
plicit modelling of the reasons for returns took place.
3 CHARACTERIZATION OF
RETURNS
ZERUM provided a list of 2,543 articles ordered of
which 325 had been returned. We combined the fol-
lowing data on products into one dataset:
• Order Information: Data and time of order and
payment, total amount paid, taxes by category,
customer, shipping and billing address.
• Product Information: Label, size, material,
price per item, description, manufacturer name.
Due to the small amount of data we used a random
sample of one third of the data (678 samples) biased
towards a higher proportion of returns (203 of the
325 returns) for training and two thirds (1,865 sam-
ples with 122 returns) for testing. Initial experiments
led us to remove features that are redundant, those
with unique and almost unique id values, and the field
payment state which partially leaks the returns status
and thus yields unrealistically high predictive perfor-
mance.
The fields material, size, description, label, billing
address, shipping address and customer were free text
fields containing multiple words. We initially consid-
ered creating combined or separate word vectors for
them, however performance as measured by balanced
F
1
was always worse.
We characterized returns by the modified version
(described by Seewald et al. (2019)) of the well-
known rule learning algorithm, JRip, which is an
Open Source implementation of RIPPER (Cohen,
1995) within the data mining suite WEKA (Frank
et al., 2005). We chose JRip for its ability to produce
small concise rule sets that are easy to interpret.
We obtained a rule set with only three rules that
gives a precision of 0.247, recall of 0.385 and a bal-
anced F
1
measure of 0.301 on the test set – unfortu-
nately not much better than random guessing. Fur-
thermore, the obtained rules did not make empiricial
sense so we do not describe them in detail. We also
tested three other algorithms from the WEKA suite:
SMO, a support vector machine classifier with lin-
ear kernel; Logistic Regression; and J48 which is a
reimplementation of C4.5; but obtained comparable
F
1
measures of 0.270, 0.263 and 0.307 respectively.
Deep learning algorithms were not considered due to
the smallness of the data set, and also because under-
standability of the models was a primary requirement.
We therefore proposed to ZERUM to provide bet-
ter size information in the webshop as it is well known
this leads to smaller returns rates (Kristensen et al.,
2013; Singh, 2015), and since we also found in earlier
work (Wernbacher et al., 2019) that a combination of
detailed size tables with persuasive design to empha-
size size tables by color and layout (phase II) reduced
the returns rate by 10.4%.
4 FITTING TOOL
As it is well known that incorrect size information
can lead to returns, and that adding manufacturer size
tables to a website can reduce returns significantly
(Kristensen et al., 2013; Singh, 2015) by allowing
customers to more easily determine whether a clothes
item will fit them, we developed a Fitting Tool app to
measure body size automatically and thus apply both
insights at once.
4.1 Hardware
Active depth cameras (Seewald and Pfeiffer, 2022)
were an obvious choice for this task, since they al-
low precise measurements without requiring large
amounts of training data that we would not have been
able to produce within the scope of this project.
First, to prevent having to use manufacturer-
specific interfaces to access integrated depth cameras
– which normally need a rooted device and would
thus never to able to run on the vast majority of mo-
bile phones – we chose Google ARcore as frame-
work and selected several phones from its compatibil-
ity list
2
which supported Time-of-Flight (ToF) hard-
ware depth sensors. We focussed on ToF as it is the
state-of-the-art for active depth sensing and in fact al-
most all currently available depth cameras use ToF as
sensing technology.
Due to view angle and since depth data was only
available from a certain minimum distance, the Fit-
ting Tool app needed two persons to operate it: one
person – the one to be measured – in front of the mo-
bile phone and one person behind it.
2
See https://developers.google.com/ar/devices?hl=en
ICAART 2024 - 16th International Conference on Agents and Artificial Intelligence
922

Figure 1: Left: Color image with overlaid OpenPose-
estimated body keypoints. Right: Depth image with over-
laid estimated body shape due to tracking. Both images
were manually cropped to improve visual alignment.
4.2 Body Pose Keypoint Detection
For detection of human pose keypoints, we chose the
Tensorflow Lite model of OpenPose (Cao et al., 2019)
since it was easy to integrate into an Android app that
uses Google ARcore and also relatively fast (about
0.6s to analyze one 640x480 image). For its body
pose detection, OpenPose only analyzed the color im-
age, so it was also necessary to create a spatial map-
ping from color to depth image. Google ARcore pro-
vides such a mapping, however it was insufficiently
accurate
3
, so it was necessary to extend it with a
general planar homography correction (Chum et al.,
2005). This correction reduced the residual error to
2.41 ± 1.15 pixels on a 640x360 depth image (i.e.
0.32% when compared with the diagonal) which was
deemed acceptable.
4.3 Measurement Module
The distance between body keypoints cannot be di-
rectly used to estimate body size measurements, since
the position of body keypoints always has some jitter
so their relative position versus the body border is by
no means fixed, and human bodies are never perfectly
flat.
We therefore implemented a 2D tracking/mea-
surement algorithm, MarkPose – shown in Alg. 1
– that starts at various body keypoints estimated by
OpenPose (already translated to depth image coor-
dinates) and tracks along lines derived from rela-
tive keypoint positions until the depth increases suf-
ficiently to ascertain the tracked point is outside
3
86.65 ± 5.61 pixels difference for eight manually
tagged points, however most of the difference seems to have
been a scale factor and a translation due to different aspect
ratios and sizes between depth and camera image.
the body. Each 2D point in the depth image can
be easily converted to 3D by utilizing the ARcore-
provided f
x
, f
y
,c
x
,c
y
parameters
4
, which was used
to measure the length of corresponding tracked lines
based on 3D points, and doubling this value to obtain
circumference. The tracking algorithm main func-
tion computeMeasurement is shown in Alg. 1 and
needs the parameters sP (starting point from body 2D
keypoints already converted to depth image coordi-
nates), min/max/stepAl pha (range and steps for lo-
cal search), depthDi f f (for body border recognition),
and depthImage (the depth image to be processed,
represented as two-dimensional image with millime-
ter distance values for each pixel). For comput-
ing SHOULDER, use sP = Neck, minAl pha = 0.0,
maxAl pha = 0.1, stepAl pha = 0.1 and depthDi f f =
75. For computing WAIST, use sP =
LHip+RHip
2
,
minAl pha = −0.25, maxAl pha = 0.25, stepAl pha =
0.025 and depthDi f f = 125.
We also tracked neck, left and right wrist, and left
and right elbow in a similar manner but did not use it
later for T-Shirt size estimation, so they are not shown
here. Fig. 1 shows a sample color and depth image
with all tracked keypoints and distances, including the
ones not used for T-Shirt size estimation.
This algorithm yielded measurements for a sin-
gle depth frame in around 2s, already including
OpenPose processing. To improve data quality, we
recorded 15 frames in sequence (taking about 0.5s)
and then analyzed all frames, reporting the arithmetic
mean over all measured values, resulting in a total
processing time of about 30s. We also tested report-
ing the median value which performed slightly better.
These values were later used for T-Shirt size estima-
tion.
To estimate the proposed system’s error, we manu-
ally determined SHOULDER and WAIST measures
from five people (three men, two women) using a
band measure (unit: centimeters), and compared them
with the median values averaged over 15 frames from
each person analyzed by our system. SHOULDER
had an error of 4.1% ± 2.34 versus the true value,
and WAIST had an error of 4.7% ± 4.38 versus the
true value.
4.4 T-Shirt Size Estimation
Initially we used a fixed size table for SHOULDER
and WAIST, see Table 1. For T-Shirt size estimation
we chose the smallest size where both measured val-
ues – SHOULDER and WAIST – were below the
corresponding values according to the size table.
4
See function get3D() in Alg. 1
Climate-Friendly Online Shopping Within the Green eCommerce Project: A Fitting Tool to Determine T-Shirt Sizes Using Active Depth
Sensing
923

Algorithm 1: Tracking algorithm MarkPose with associated helper functions. The main function is computeMeasurement.
Function getDepth(p,depthImage)
/* Returns depth in millimeters at 2D position p = (p
x
, p
y
) from depth image. */
return depthImage
p
x
,p
y
end
Function get3D(p,depthImage)
/* c
x
,c
y
, f
x
, f
y
are provided by the Google ARcore API. All units are converted
from millimeters to meters here. */
z
′
←
getDepth(p,depthImage)
1,000
;
x
′
← z
′
p
x
−c
x
f
x
;
y
′
← z
′
p
y
−c
y
f
y
;
p3D ←
x
′
y
′
z
′
;
return p3D;
end
Function getDist(s3D,e3D)
/* Standard vector distance between two 3D points */
return |s3D −e3D|;
end
Function computeMeasurement(sP,minAlpha,maxAlpha,stepAlpha,depthDiff,depthImage)
l ← Neck −
LHip+RHip
2
;
l
′
← l
0 −1
1 0
1
|l|
;
maxDist ← 0;
for α ← minAl pha; α ≤ maxAl pha; α ← α + stepAl pha do
sP
′
← sP + α ∗ l;
initialDepth ← getDepth(sP, depthImage);
sLe f t ← sP
′
; stepLe f t ← 0;
while getDepth(sLe f t,depthImage) < initialDepth + depthDi f f do
sLe f t ← sLe ft + l
′
; stepLe f t ← stepLe f t + 1;
end
sRight ← sP
′
; stepRight ← 0;
while getDepth(sRight,depthImage) < initialDepth +depthDi f f do
sRight ← sRight − l
′
; stepRight ← stepRight + 1;
end
if stepLe ft > 0 and stepRight > 0 and
min(stepLe f t,stepRight)
max(stepLe f t,stepRight)
≥ 0.5 then
s ← sRight; dist ← 0; s3D ← get3D(s, depthImage);
while s ̸= sLe f t do
s ← s + l
′
; e3D ← get3D(s,depthImage);
localDist ← getDist(s3D,e3D);
dist ← dist + localDist; s3D ← e3D;
end
if dist > maxDist then maxDist ← dist;
end
end
return maxDist ∗ 2;
end
ICAART 2024 - 16th International Conference on Agents and Artificial Intelligence
924
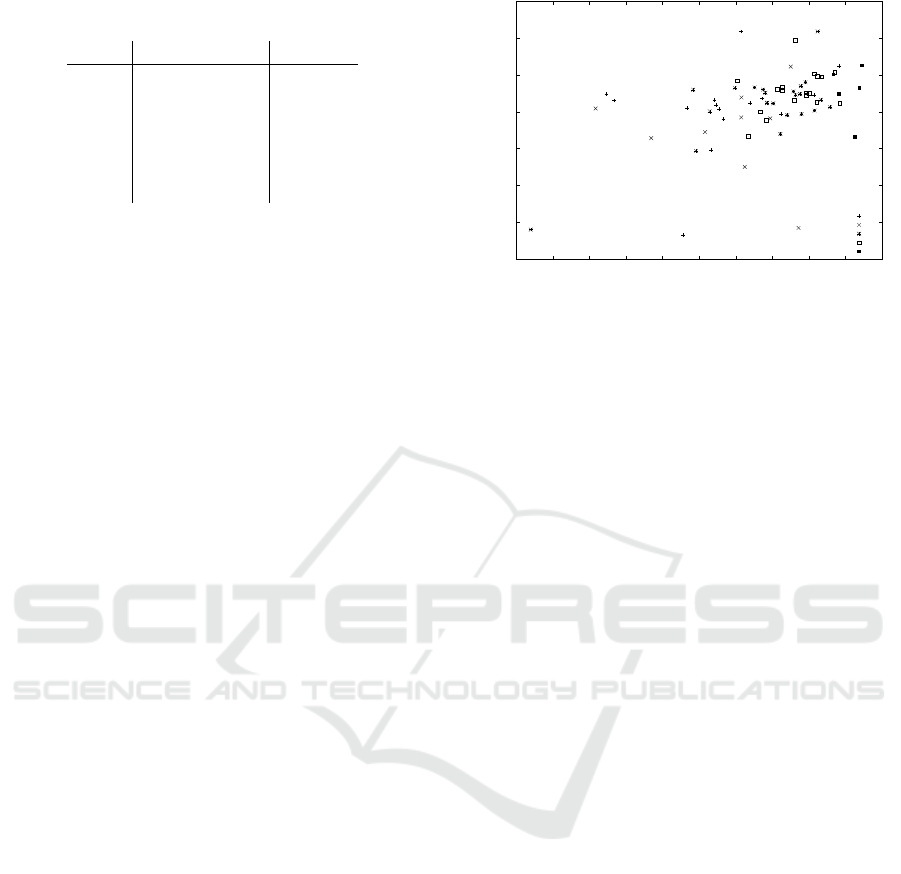
Table 1: Fixed size table that was initially used for T-shirt
size estimation. All units in cm.
Size SHOULDER WAIST
XS 45.0 65.0
S 48.0 67.0
M 51.0 69.0
L 54.0 71.0
XL 57.0 73.0
XXL 60.0 75.0
At the time of writing this paper, we had obtained
data set with 73 different persons with known (self-
reported) T-Shirt sizes. On this dataset, using the
fixed size table from Table 1, an accuracy of only
21.91% was obtained.
To improve on this, we reformulated this task as
a machine learning problem, mapping the measured
body sizes SHOULDER and WAIST (as arithmetic
mean over the measured 15 frames) to the known T-
shirt size. To enhance the data set, we added ad-
ditional features, namely the median of each mea-
surement (computed over the 15 analyzed frames)
and also included standard deviation for each mean,
plus the number of samples that could be processed
(i.e. which were not excluded by tracking errors). In
this way we obtained a model with three rules and
an leave-one-out cross-validation accuracy of 43.66%
which is much better but still not satisfactory.
(shoulderMedian <= 0.94) => class=XS
(20.0/9.0)
(waistMedian <= 0.76) => class=S (6.0/2.0)
=> class=XL (45.0/41.0)
Currently, we are awaiting new data to test this model.
However it should be noted that the new model only
predicts XS, S and XL – three of six classes – and
no other sizes, contrary to the size table-derived map-
ping.
Undetected tracking errors may explain the un-
satisfactory performance observed above. However a
manual analysis of 50 randomly chosen depth images
indicated that for 80% both measurements SHOUL-
DER and WAIST were correct; 14% had a tracking
error for SHOULDER (it was too short) and 6% had
a tracking error for WAIST (it was too long, in most
cases because hands were too near to the waist and
were measured together with it). Assuming these er-
rors are randomly distributed, the expected error after
averaging 15 frames is negligible.
Surprisingly, the qualitative evaluation reported
by the measured people themselves via question-
naire directly after the measurement was much better.
33.33% of people reported the measurement as ok,
27.78% as partially ok and 38.89% as incorrect. So
about 61.11% of the people considered the reported T-
0
0.2
0.4
0.6
0.8
1
1.2
1.4
0.3 0.4 0.5 0.6 0.7 0.8 0.9 1 1.1 1.2 1.3
WAIST (in meters)
SHOULDER (in meters)
XS
S
M
L
XL
Figure 2: T-Shirt sizes reported by users versus SHOUL-
DER and WAIST measured sizes. Both SHOULDER and
WAIST measures are the arithmetic mean of at most 15 lo-
cal measurements from the same person, each computed
from one of the 15 consecutively recorded depth images.
More details see text.
shirt size to be ok or partially ok which is three times
better than would be expected from above quantitative
estimate when using the standard size table and still
about 50% better than the machine learning model
from above.
Manufacturer bias may explain this discrepancy
as people may consider more than one size to fit, de-
pending on manufacturer and model. To test this hy-
pothesis, a visualization of actual measurements ver-
sus user-reported T-shirt sizes was created. Fig. 2
shows a plot of SHOULDER versus WAIST with
the reported sizes as differently shaped points, us-
ing arithmetic mean to average measurements of the
15 recorded depth images from each person. Fig. 3
shows the same data but uses median instead of
mean for averaging. It can be seen at first glance
that no clear definition of sizes depending on either
SHOULDER or WAIST – or both – can be obtained.
The most likely explanation is therefore that different
manufacturers define T-Shirt sizes differently (per-
haps even for different models), so these are not uni-
versally comparable. In fact one tester mentioned that
he often buys T-shirts in two different sizes from dif-
ferent manufacturers but all of them fit.
5 CONCLUSION
We have introduced the Green eCommerce project,
which is concerned with reducing returns and en-
couraging customers to shop more environmental-
consciously.
In the preliminary part of this paper, we have char-
acterized reasons for returns using compact rule lists
as in earlier work. However, the obtained rules were
Climate-Friendly Online Shopping Within the Green eCommerce Project: A Fitting Tool to Determine T-Shirt Sizes Using Active Depth
Sensing
925

0
0.2
0.4
0.6
0.8
1
1.2
1.4
0.4 0.5 0.6 0.7 0.8 0.9 1 1.1 1.2 1.3
WAIST (in meters)
SHOULDER (in meters)
XS
S
M
L
XL
Figure 3: T-Shirt sizes reported by users versus SHOUL-
DER and WAIST measured sizes. Both SHOULDER and
WAIST measures are median values of at most 15 local
measurements from the same person, each computed from
one of the 15 consecutively recorded depth images. More
details see text.
not suitably precise which is most likely due to the
much smaller dataset available here, and could not be
translated into actionable items. We therefore sug-
gested actions known to reduce returns from earlier
work.
In the main part of this paper we have described
the Fitting Tool app, to exactly measure body param-
eters using an active depth camera. We found that
direct body measurements (in cm) were quite pre-
cise, however T-Shirt sizes could only be predicted
at a much lower accuracy from this data either by a
fixed size table or a machine learning model. How-
ever, feedback by users indicated that the perceived
performance of the system is about 1.5-3 times higher.
This may be explained by manufacturer and/or model
bias, leading to non-comparable T-Shirt sizes be-
tween manufacturers or models and also making peo-
ple more likely to consider more than one predicted
size as fitting. Manufacturer bias of this kind was also
found in earlier work by Seewald et al. (2019).
5.1 Future Work
The main issue with the proposed Fitting app is that T-
shirt sizes can only be predicted at low accuracy due
to manufacturer bias. We aim to resolve this by us-
ing manufacturer-dependent size tables – either em-
bedded into the app itself and additionally chosen by
the user, or embedded into the webshop while restrict-
ing the app to search for fitting garments by using the
more precise body measurements instead of the es-
timated T-shirt size. The latter would have the ad-
ditional advantage to allow normal webshop users to
also search by exact measurements rather than by in-
accurate size brackets.
We also plan to re-evaluate the accuracy of the
proposed body size measurement algorithm on a
larger data set of test persons with known body sizes.
A sufficiently large data set may even make it possible
to apply deep-learning training methods to this task,
possibly even end-to-end learning body sizes from
depth images, while a more moderately sized dataset
could be used to automatically tune the parameters of
the tracking algorithm.
One limitation of the present work is the rather
small number of mobile phones with active depth
cameras for which raw depth data is available and suf-
ficiently accurate. We will continue to watch out for
suitable mobile phones and plan to port the app on
those mobile phones that seem suitable.
Another limitation is that currently two people are
needed to use the Fitting app. We plan on evaluat-
ing whether leaning the mobile phone against the wall
is a feasible option (similar to (Zalando Corporate,
2023)), making the app also usable for just one per-
son.
ACKNOWLEDGEMENTS
This project was funded by the Austrian Research
Promotion Agency (FFG) and by the Austrian Fed-
eral Ministry for Transport, Innovation and Technol-
ogy (BMVIT) within the Mobility for the Future (Mo-
bilit
¨
at der Zukunft (MdZ)) research program as a
project for the 2021 call on M-Era as project Green
eCommerce. We would like to especially thank Sigi
and Simon G. for testing the Fitting Tool app, invalu-
able feedback and ensuring that we received useful
data to improve on this research prototype.
REFERENCES
BMK (2020). PoviMob. Potentiale virtueller Mobilit
¨
at
– Rahmen und Maßnahmen f
¨
ur eine bestm
¨
ogliche
Verkn
¨
upfung virtueller und physischer Mobilit
¨
at. Bun-
desministerium f
¨
ur Klimaschutz, Umwelt, Energie, Mo-
bilit
¨
at, Innovation und Technologie (BMK), Vienna, Aus-
tria.
BMVIT (2015). eComTraf - Auswirkungen von E-
Commerce auf das Gesamtverkehrssystem. Bundesmin-
isterium f
¨
ur Verkehr, Innovation und Technologie, Wien.
Cao, Z., Hidalgo Martinez, G., Simon, T., Wei, S., and
Sheikh, Y. A. (2019). Openpose: Realtime multi-person
2d pose estimation using part affinity fields. IEEE Trans-
actions on Pattern Analysis and Machine Intelligence.
Chum, O., Pajdla, T., and Sturm, P. (2005). The geomet-
ric error for homographies. Computer Vision and Image
Understanding, 97(1):86–102.
ICAART 2024 - 16th International Conference on Agents and Artificial Intelligence
926

Cohen, W. (1995). Fast effective rule induction. In Pro-
ceedings of the Twelfth International Conference on Ma-
chine Learning, San Francisco, CA, 1995, pages 115–
123. Morgan Kaufmann.
DCTI (2015). Klimafreundlich einkaufen – eine ver-
gleichende Betrachtung von Onlinehandel und sta-
tion
¨
arem Einzelhandel. Deutsches CleanTech Institut,
Bonn. https://www.onlinehaendler-news.de/online-
handel/haendler/19828-online-handel-klimafreundlich
(accessed 4th January 2024).
Frank, E., Hall, M. A., Holmes, G., Kirkby, R., Pfahringer,
B., and Witten, I. H. (2005). Weka: A machine learning
workbench for data mining., pages 1305–1314. Springer,
Berlin.
Holtmann, U. and Klitzsch, C. (2021). Talk about
it - Nachhaltigkeit als PR-Thema. EHI Retail In-
stitute, K
¨
oln. https://www.ehi.org/produkt/whitepaper-
talk-about-it-nachhaltigkeit-als-pr-thema/.
Knabl, W., K
¨
ob, M., Meszaros, G., Prenger, C.,
Rischanek, U., Segal, D., and Weigl, A. (2021).
Bundesweite eCommerce Studie
¨
Osterreich. Handelsver-
band. https://www.handelsverband.at/publikationen/
studien/ecommerce-studie-oesterreich/ ecommerce-
studie-oesterreich-2021.
Kolf, F. (2021). Neue Studie: E-Commerce hat eine bessere
Klimabilanz als station
¨
arer Handel. Handelsblatt,
13:2021. https://www.handelsblatt.com/unternehmen/
nachhaltigkeit/einzelhandel-neue-studie-e-commerce-
hat-eine-bessere-klimabilanz-als-stationaerer-
handel/27082114.html (accessed 4th January 2024).
Kristensen, K., Borum, N., Christensen, L., et al. (2013).
Towards a next generation universally accessible online
shopping-for-apparel system. In Human-Computer In-
teraction: Users and Contexts of Use, Volume 8006 of
the series Lecture Notes in Computer Science, pp. 418-
427. Springer.
Seewald, A. K. and Pfeiffer, A. (2022). Magic Mirror: I
and My Avatar - A Versatile Augmented Reality Installa-
tion Controlled by Hand Gestures. In Proceedings of the
14th International Conference on Agents and Artificial
Intelligence (ICAART 2022), volume 3, pages 300–307.
Seewald, A. K., Wernbacher, T., Pfeiffer, A., Denk, N.,
Platzer, M., Berger, M., and Winter, T. (2019). Towards
minimizing e-commerce returns for clothing. In Pro-
ceedings of the 11th International Conference on Agents
and Artificial Intelligence (ICAART 2019), volume 2,
pages 801–808.
Sievering, O. (2020). The environmental impact of shop-
ping via the internet. In Central and Eastern European
eDem and eGov Days, pages 33–42.
Singh, K. (2015). Reducing Customer Returns in an Online
Marketplace. Dept. of Fashion Technology, National In-
stitute of Fashion Technology, Mumbai, India.
Toktay, L. (2003). Forecasting product returns. In Guide Jr.,
D. and Van Wassenhove, L., editors, Business Apects of
Closed-Loop Supply Chains, International Management
Series, volume 2. Carnegie Bosch Institute.
Wernbacher, T., Platzer, M., Seewald, A. K., Winter, T.,
Wimmer, S., and Pfeiffer, A. (2023). Green eCommerce.
In IEEE 9th International Conference on Computing, En-
gineering und Design (ICCED 2023), pages 1–5. IEEE.
In print.
Wernbacher, T., Seewald, A., Denk, N., Pfeiffer, A., Platzer,
M., and Winter, T. (2019). Think! first: Inducing be-
havioural change through gamification, persuasive de-
sign principles and machine learning. In European Con-
ference on Games Based Learning, pages 793–XXIV.
Academic Conferences International Limited.
Zalando Corporate (2023). Zalando launches size recom-
mendations based on customers’ own body measure-
ments. https://corporate.zalando.com/en/technology/
zalando-launches-size-recommendations-based-
customers-own-body-measurements. (accessed 15th
November 2023).
Climate-Friendly Online Shopping Within the Green eCommerce Project: A Fitting Tool to Determine T-Shirt Sizes Using Active Depth
Sensing
927
