Vision Transformer Interpretability via Prediction of Image Reflected
Relevance Among Tokens
Kento Sago
a
and Kazuhiro Hotta
b
Meijo University, Nagoya, Japan
Keywords:
Explainable AI, Vision Transformer, Transformer Attribution.
Abstract:
The Vision Transformer (ViT) has a complex structure. To use it effectively in a place of critical decision-
making, it is necessary to visualize an area that affects the model’s predictions so that people can understand. In
this paper, we propose a new visualization method based on Transformer Attribution which is widely used for
visualizing the area for ViT’s predictions. This method estimates the influences of each token on predictions
by considering the predictions of images reflected relevance among tokens, and produce saliency maps. Our
method increased the accuracy by about 1.28%, 1.61% for deletion and insertion and about 3.01%, 0.94% for
average drop and average increase on ILSVRC2012 validation data in comparison with conventional methods.
1 INTRODUCTION
The Vision Transformer (ViT) (Dosovitskiy et al.,
2021) is effective for tasks such as image classifica-
tion(Wang et al., 2021; Liu et al., 2022) and object
detection (Carion et al., 2020; Caron et al., 2021; Liu
et al., 2023), semantic segmentation (Zheng et al.,
2021; Xie et al., 2021). ViT has a complex structure,
and in order to use it effectively in a place of critical
decision-making, it is necessary to visualize an area
that affects model’s prediction so that people can un-
derstand (Zhou et al., 2016; Selvaraju et al., 2017;
Petsiuk et al., 2018; Wang et al., 2020). Visualization
of an area that affects model’s prediction allows us
to understand the trend in predictions, and allows the
model for the improvement of performance. There-
fore, we considered that interpreting the model is the
important task.
In this paper, we pay attention to Transformer At-
tribution (Chefer et al., 2021) widely used to interpret
the ViTs. Although this method visualizes the im-
portant area by the relevance scores calculated from a
Hadamard product of Attention scores and gradients
of the model, the relevance scores tend to be locally
larger in objects that occupy the most of the image,
and only parts of them are highlighted while the rests
are not highlighted as shown in Figure 1.
In Transformer Attribution, it did not leverage the
a
https://orcid.org/0009-0005-0935-0845
b
https://orcid.org/0000-0002-5675-8713
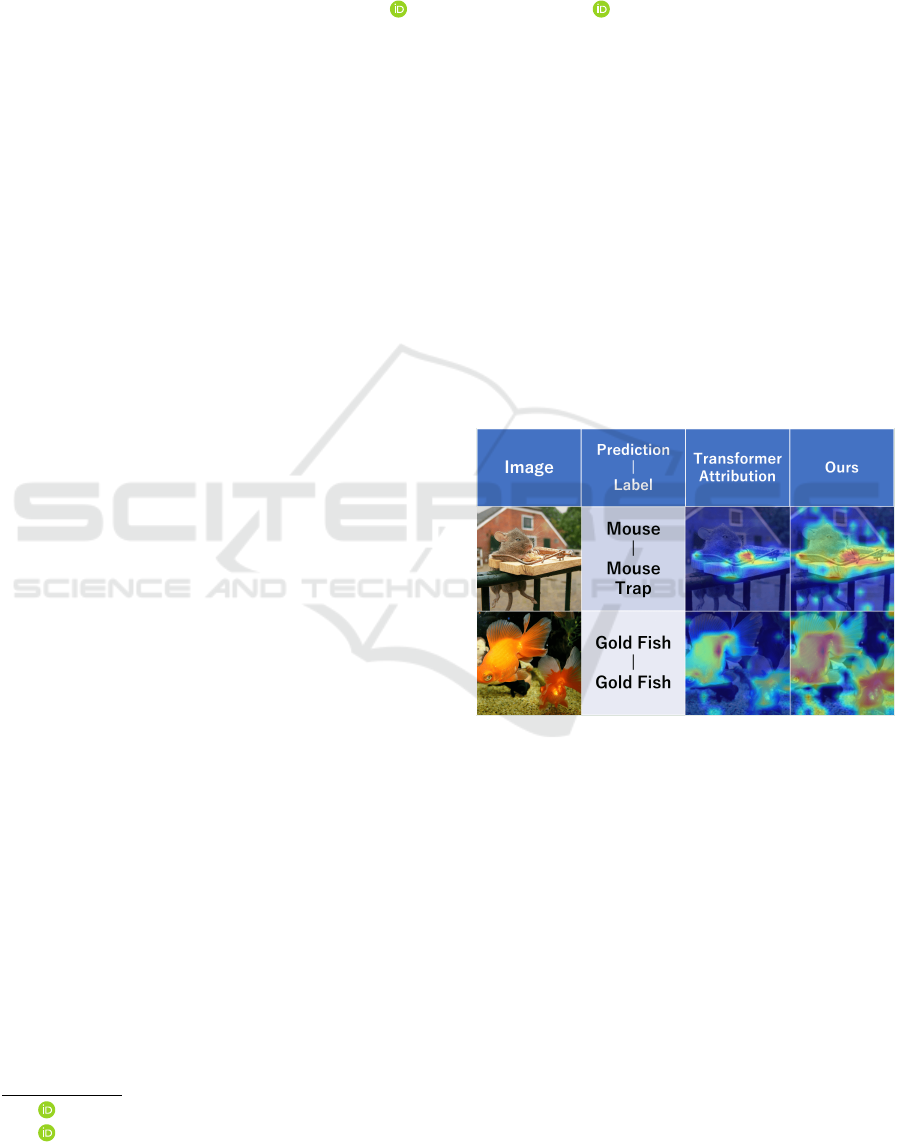
Figure 1: Visualization results by our proposed method and
Transformer Attribution. Our method highlighted the pre-
dicted class object better than the Transformer Attribution.
relevance among image tokens. On the other hand,
our method focused on leveraging that abandoned rel-
evance. Specifically, the proposed method again pre-
dicts multiple images calculated from a Hadamard
products of relevance scores produced from Trans-
former Attribution and input images with the model,
and the method calculates a saliency map from the
model’s outputs.
In the qualitative experiments, we used validation
set in the ILSVRC2012 dataset. We evaluated our
method by four measures; the insertion and deletion,
average drop, and average increase. Our method in-
creased the accuracy by about 1.28%, 1.61% for dele-
tion and insertion and about 3.01%, 0.94% for av-
100
Sago, K. and Hotta, K.
Vision Transformer Interpretability via Prediction of Image Reflected Relevance Among Tokens.
DOI: 10.5220/0012419200003654
Paper published under CC license (CC BY-NC-ND 4.0)
In Proceedings of the 13th International Conference on Pattern Recognition Applications and Methods (ICPRAM 2024), pages 100-106
ISBN: 978-989-758-684-2; ISSN: 2184-4313
Proceedings Copyright © 2024 by SCITEPRESS – Science and Technology Publications, Lda.
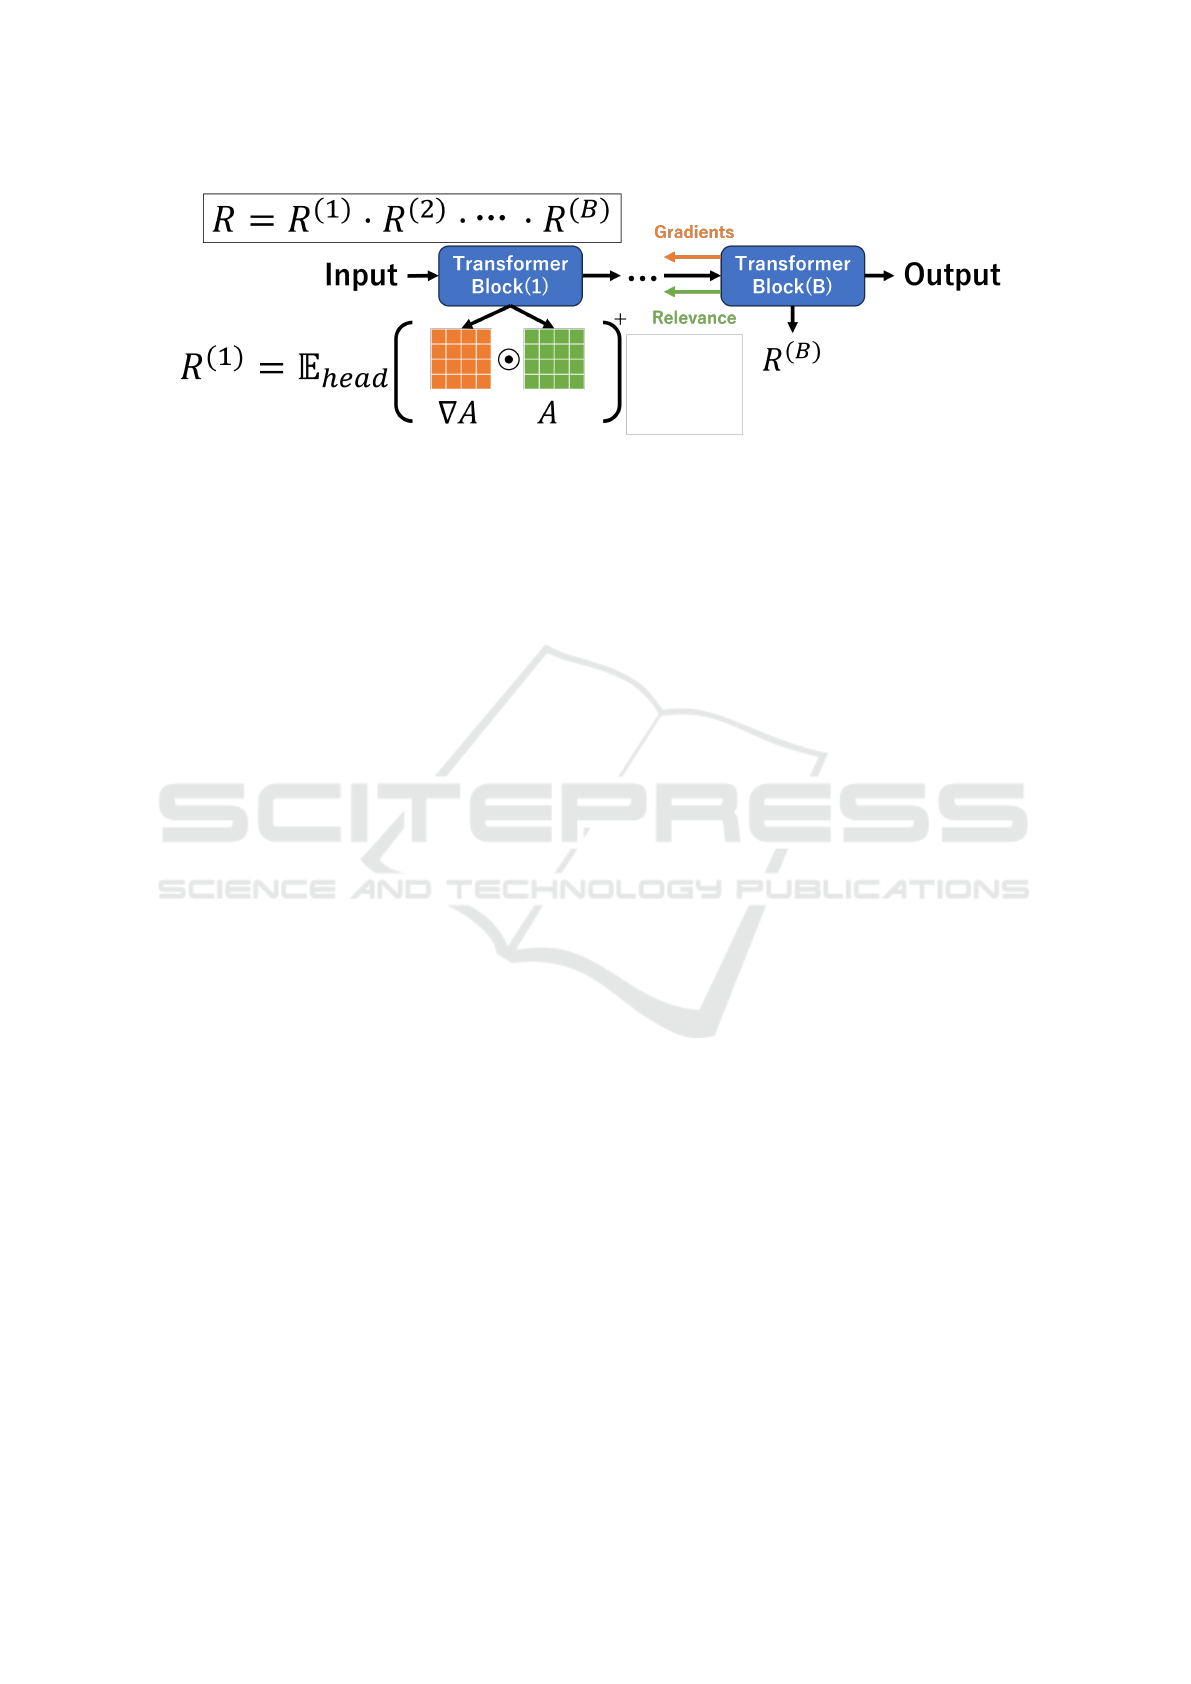
Figure 2: Overview of Transformer Attribution. Gradients and relevances are propagated through the network, and calculated
a matrix product of them to produce the final relevancy scores.
erage drop and average increase in comparison with
Transformer Attribution.
This paper is organized as follows. First, we de-
scribe related works in Section 2. We explain about
the proposed method in Section 3. We explain about
our experimental results and discussion in Section 4.
Finally, we describe conclusions and future works in
Section 5.
2 RELATED WORKS
2.1 ViTs Interpretability
The Grad-CAM(Selvaraju et al., 2017), a method for
interpreting Convolutional Neural Networks (CNNs),
computes saliency maps from the deepest feature
maps and gradients of the model. Furthermore, vari-
ous methods were proposed to interpret CNNs (Chat-
topadhay et al., 2018; Ramaswamy et al., 2020; Jiang
et al., 2021), and some of those methods can also in-
terpret ViTs. Subsequently, a method utilizing the At-
tention Score (Abnar and Zuidema, 2020) was pro-
posed to interpret ViT because it is considered that
the attention scores indicate the areas that affects the
ViT predictions.
However, there was a challenge to need effectively
combine scores from different layers. For example, if
we simply average the attention scores for each to-
ken, the signal is often attenuated. Attention Rollout
(Abnar and Zuidema, 2020) that computes the matrix
product of the attention scores of all layers was pro-
posed to remedy this problem. This method showed
an improvement over using a single attention layer,
however, often highlighted irrelevant tokens. Further-
more Transformer Attribution(Chefer et al., 2021) us-
ing gradient is widely used to interpret the ViT. In this
paper, Transformer Attribution is used as a baseline
method.
2.2 Transformer Attribution
In Transformer Attribution shown in Figure 2, first,
we feed an input image into ViT, and the gradients
are computed from the output value through all Trans-
former blocks to the input image. In order to calculate
a relevance score R ∈ R
N×N
, the method calculates
a Hadamard product of each transformer block’s at-
tention score A ∈ R
N×N
that represented by the green
matrix in the Figure, and gradients ∇A ∈ R
N×N
that
represented by the orange matrix in the Figure, and
averages those products across all heads. Note that
N represents the number of the token fed into the
Transformer block. Only the positive values should
contribute to the prediction. Moreover, it calculates
the relevance scores from a matrix products of these
products. The component (i, j) of R is the magnitude
of the influence of the pair of the i −1-th token and
the j −1-th token on the prediction, and this is called
”relevance”. Furthermore, the component (0, 0) of
R is the relevance of the class token and itself. The
method visualizes the areas that affect the predictions
by producing the saliency map from the relevance of
the class token and all other image tokens because it
is considered that the class token has a high capacity
for the interpretability. However, the relevance scores
tend to be locally larger, in objects that occupy the
most of the image, and only parts of them are high-
lighted while the rests are not highlighted as shown in
Figure 1.
3 PROPOSED METHOD
In the proposed method shown in Figure 3, first, the
relevance score obtained by Transformer Attribution.
In Figure 3, the blue column in the relevance score in-
dicates the relevance among class token and image to-
kens, while the orange matrix indicates the relevance
score among image tokens. For the orange matrix R ∈
Vision Transformer Interpretability via Prediction of Image Reflected Relevance Among Tokens
101
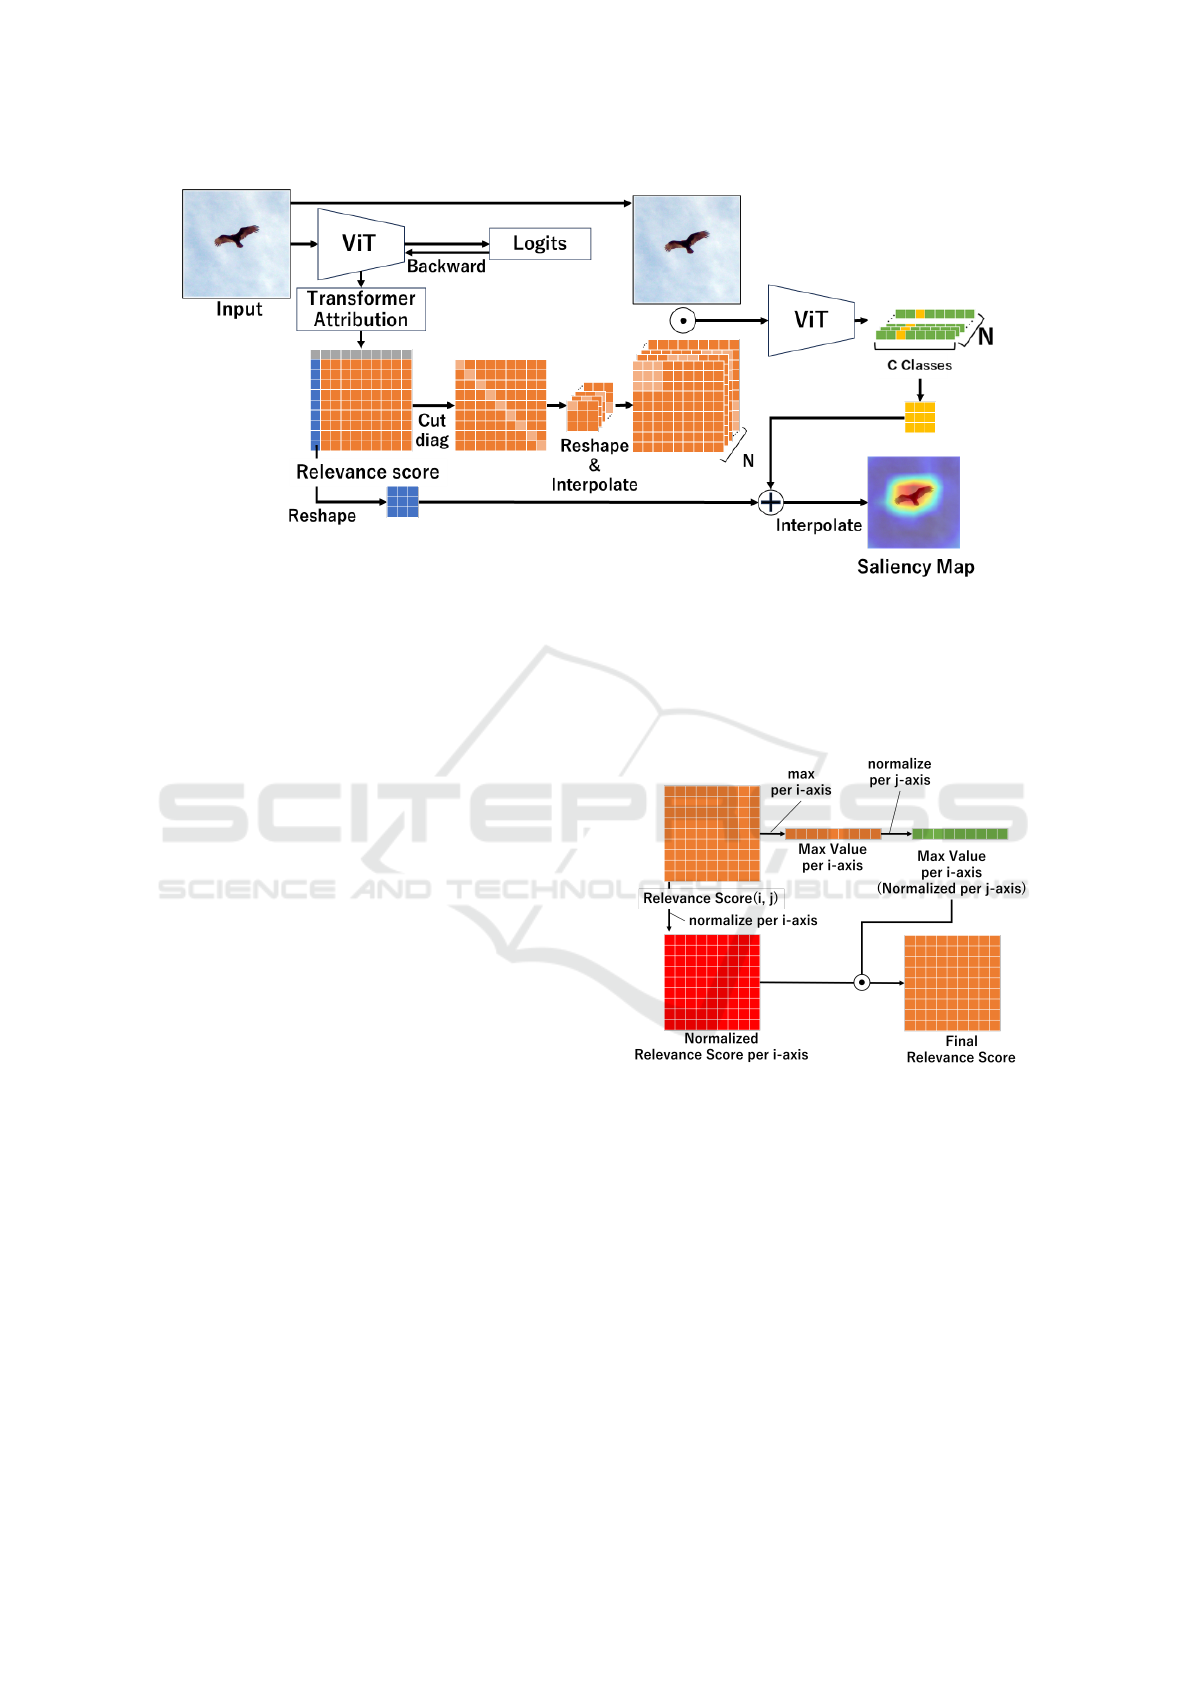
Figure 3: Overview of our proposed method. The orange matrix is the relevance score between image tokens obtained by
Transformer Attribution, and we cut the diagonal components of those relevance scores. Moreover, we reshape each column
to a matrix and interpolate it to the same size as the input image. The image by Hadamard product between the input image
and those relevance score is fed into ViT, and we obtain the logits hw ×C (Green and Yellow vectors in the Figure) from
ViT. We add the value corresponding to the predicted class of the logits (Yellow vector in the Figure) to the relevance among
class token and image tokens (Blue vector in the Figure), and the saliency map is obtained by interpolating the sum result to
a matrix to the same size as the input image.
R
(N−1)×(N−1)
and identity matrix I ∈ R
(N−1)×(N−1)
,
Hadamard product ⊙, the proposed method corrects
the magnitude of the relevance score as
R
′
= R ⊙(1 −I), (1)
R
′′
= R
′
+ max
i
R
′
(i, j)
×I. (2)
When we normalize relevance scores to reflect
them into the input image, the diagonal components
has a larger value than the other components. Thus,
if it is normalized as is, the diagonal components will
have a value close to 1 and the other components will
have a value close to 0, and the only relevance among
each token and itself will be reflected into the input
image. We consider that it is better suited to mea-
sure the influence each token on the prediction if not
only the relevance to itself but also the relevance to
itself and others is reflected into the image, so we re-
placed the diagonal component with the maximum of
the other components and then normalized them.
When the relevance scores are simply normalized
by the maximum and minimum values of the total rel-
evance scores, if the maximum value is much larger
than the other values, the relevance scores of some
columns after normalization may be almost the same
value, and it may be more difficult to understand
the magnitude relationship of the column. We con-
sider that it would be easier to understand which to-
kens are highly relevance to a particular token if the
relevance scores between the columns could be nor-
malized without changing the magnitude relationship
Figure 4: Normalization of relevance score.
within the columns. Therefore, we normalized the rel-
evance scores as shown in Figure 4.
In Figure 4, we calculate the maximum relevance
score R
(i, j)
along the i-axis, and normalize those max-
imum values along j-axis (Green vector in the Figure).
Moreover, we normalize the relevance score along
the i-axis (Red matrix in the Figure), and we calcu-
late the Hadamard product of those relevance score
represented as the red matrix and the maximum rel-
evance score represented as the green vector. There-
fore, we considered that the relevance scores between
the columns could be normalized without changing
the magnitude relationship within the columns, and it
would be easier to understand which tokens are highly
ICPRAM 2024 - 13th International Conference on Pattern Recognition Applications and Methods
102

Figure 5: The example of images reflected the relevance
scores.
relevance to a particular token.
For the input image X ∈ R
1×3×H×W
, we obtain
N −1 images that reflect the relevance among the im-
age tokens as
X
′
= X ⊙interp(mat(R
′′
)), (3)
X
′
= X ⊙interp(reshape(R
′′
)), (4)
where reshape(·) represents the process to convert
relevance of all tokens to each token from a vector to a
matrix, as in R
(N−1)×(N−1)
→R
(N−1)×1×
√
N−1×
√
N−1
,
and interp(·) represents the operation of nearest
neighbor interpolation to the same size as the input
image, so the first image of X
′
is the image that re-
flects the relevance of all the tokens to the first token.
After that, the predictions L ∈ R
(N−1)×C
is output by
classifying the image reflected the relevance among
the tokens into C classes. L represents a magnitude of
the influence of each token on the prediction, and in-
dicate the important areas that affect the predictions.
Thus, we calculate the saliency map by bilinear inter-
polation of the value l ∈ R
(N−1)
corresponding to the
predicted class of L. We also consider that class to-
kens and other tokens have different areas of gazing,
and we add the relevance score obtained by Trans-
former Attribution to l.
From an example of the images reflected the rel-
evance scores shown in Figure 5, if the relevance of
other tokens to one’s own token is high, the image
will reflect not only one’s own tokens but also tokens
that are highly relevant to one’s own tokens, and we
considered to assist in subsequent classifications. Our
method estimates from the prediction of the image
whether the relevance scores obtained by Transformer
Attribution correctly indicate the areas that affect the
prediction. If the relevance score for an object in the
predicted class has even a small value, the predic-
tion of the image is considered to by larger, and it is
expected to improve the problem of the Transformer
Attribution, where only parts of them are highlighted
while the rests are not highlighted, in objects that oc-
cupy the most of the image.
4 EXPERIMENTAL SETTINGS
4.1 Dataset
In the following experiments, we evaluated our pro-
posed method with all images in the validation set of
the ILSVRC 2012 (Deng et al., 2009) that consists of
50,000 images from 1,000 classes.
4.2 Baseline
In the following experiments, we used pretrained ViT-
B/16, as in (Chefer et al., 2021). We also used ViT-
B/32 pretrained with Contrastive Language-Image
Pretraining(CLIP)(Radford et al., 2021) as in (Chen
et al., 2022). CLIP published by OpenAI is consists
of an image encoder and a text encode, and be widely
used in zero-shot classification by training on very
large data sets.
In the comparison experiment, Grad-CAM com-
putes the saliency map from the gradients and at-
tention scores of the classtoken in the last Trans-
former Block as in (Chefer et al., 2021). Furthermore,
Attention Rollout, Transformer Attribution, and our
method compute the saliency map from the gradients
and attention scores of the all Transformer Block as
in (Chefer et al., 2021).
4.3 Evaluation Metrics
We evaluated our method with deletion and insertion,
average drop, average increase widely used in evalu-
ation metrics for interpretability.
The Deletion measures a decrease in the probabil-
ity of the predicted class when important pixels are
deleted, where the importance is obtained from the
saliency map. The Deletion is the area of the proba-
bility curve with the number of deleted pixels, so the
lower is the better. The Insertion measures a increase
in the probability of the predicted class when impor-
tant pixels are inserted, where the importance is ob-
tained from the saliency map. The Insertion is the
area of the probability curve with the number of in-
serted pixels, so the higher is the better.
Average Drop is computed as follows, and the
lower is the better.
AverageDrop =
N
∑
i=1
max(0,Y
c
i
−O
c
i
)
N
. (5)
Vision Transformer Interpretability via Prediction of Image Reflected Relevance Among Tokens
103
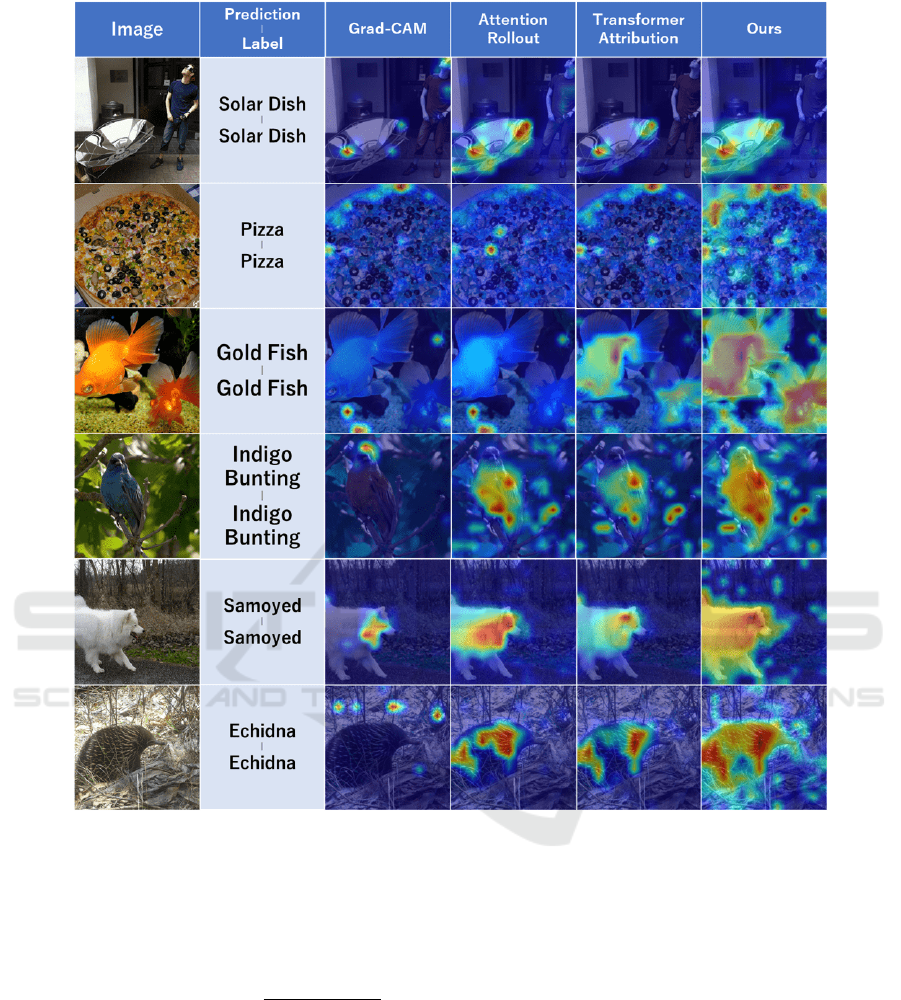
Figure 6: Visualization results by the proposed method, Grad-CAM, Attention Rollout, and Transformer Attribution. Our
method highlighted the predicted class object better than the others.
Average Increase is computed as follows, and the
higher is the better.
AverageIncrease =
N
∑
i=1
Sign(Y
c
i
< O
c
i
)
N
(6)
where Y
c
i
is the predicted probability of the classc in
the imagei among N, and O
c
i
is the predicted proba-
bility of the classc in the imagei inserted only the top
50% of pixels in the saliency map, Sign(·) is the func-
tion that returns 1 if true and 0 if false.
5 EXPERIMENTAL RESULTS
5.1 ViT Results
Table 1 shows the Deletion, Insertion, Average drop,
and Average increase by our method, Grad-CAM, At-
tention Rollout, and Transformer Attribution. Our
method has the best in all metrics. Especially, in the
comparison with Transformer Attribution, Deletion,
Insertion, Average Drop, and Average Increase was
improved by about 1.28%, 1.61%, 3.01%, and 0.94%.
Figure 6 show qualitative comparison results of
the saliency maps. The first column shows the input
image. The second column shows the model’s predic-
ICPRAM 2024 - 13th International Conference on Pattern Recognition Applications and Methods
104
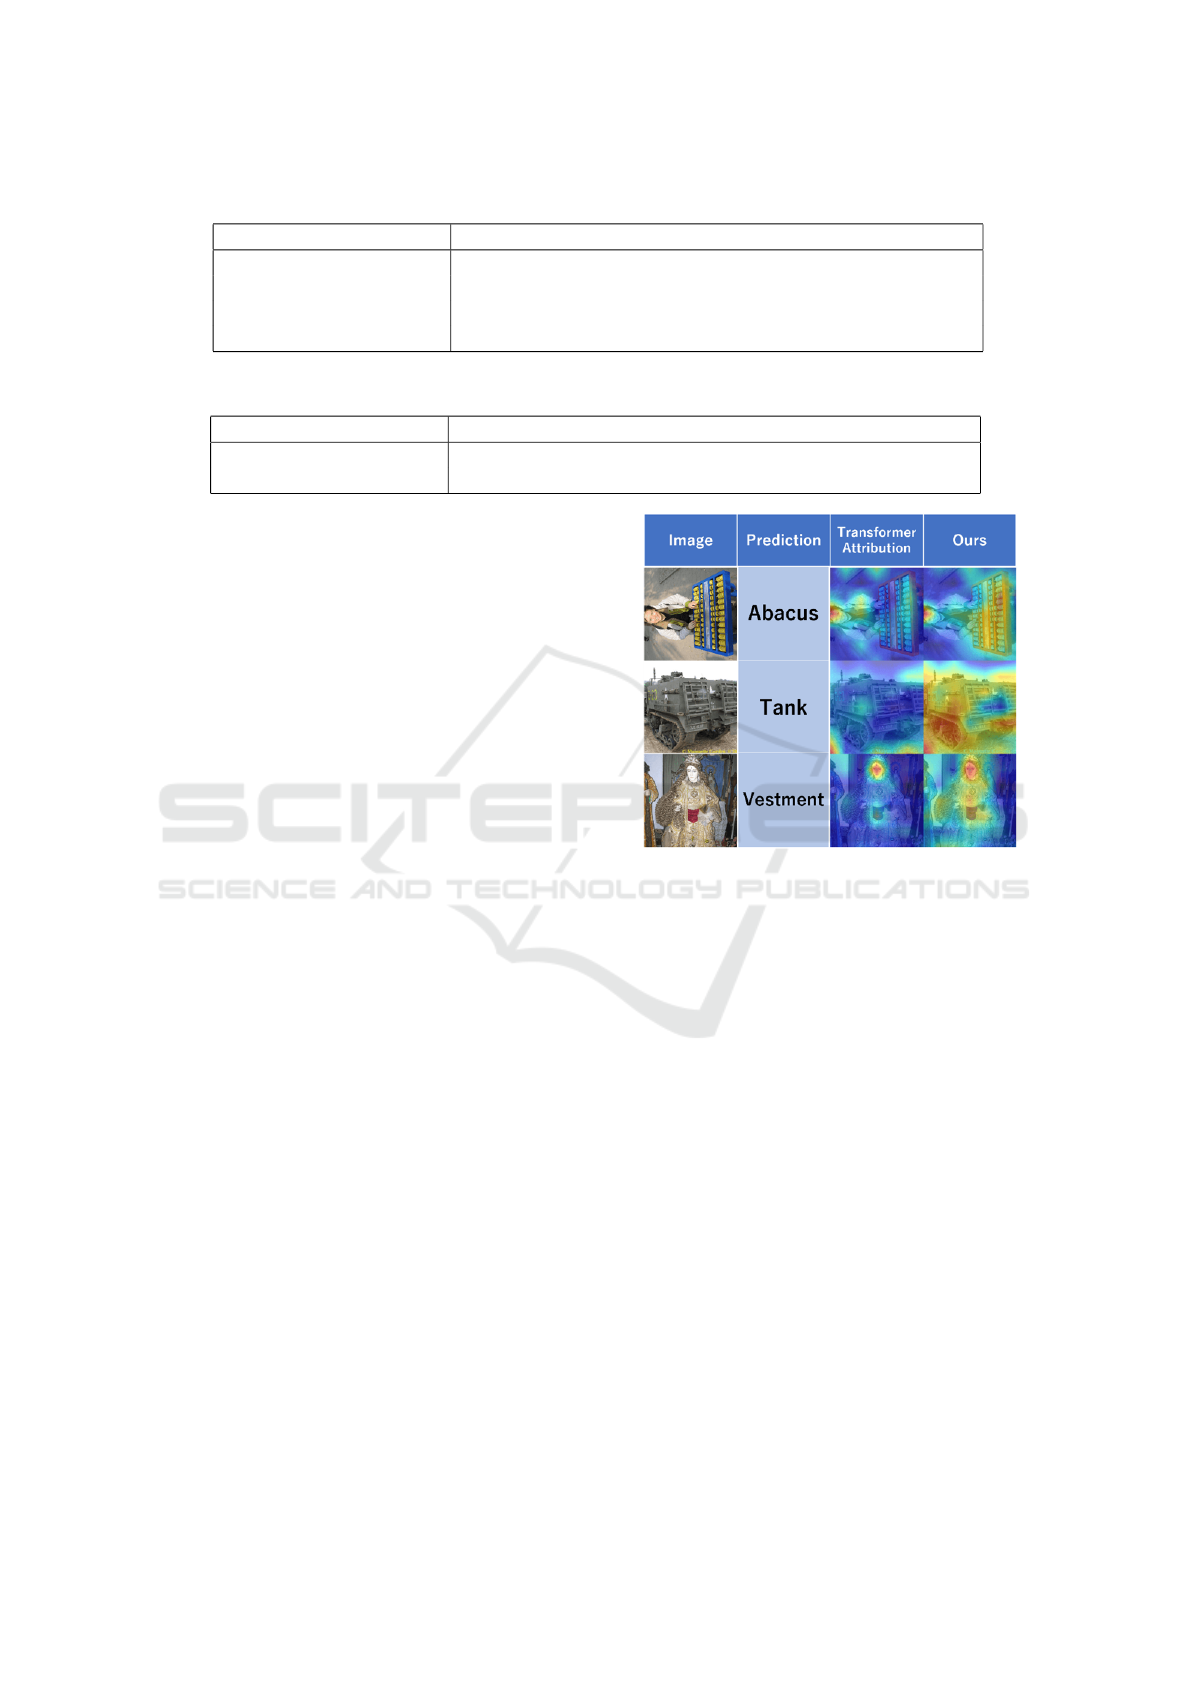
Table 1: Comparison of the proposed method and baseline on the ILSVRC2012 validation dataset.
Method Deletion Insertion Average Drop Average Increase
Grad-CAM 26.48 34.89 62.53 9.52
Attention Rollout 16.80 44.70 45.18 14.80
Transformer Attribution 15.49 46.64 40.86 18.68
Ours 14.21 48.25 37.85 19.62
Table 2: Comparison of the proposed method and baseline for Clip-ViT on the ILSVRC2012 validation set.
Method Deletion Insertion Average Drop Average Increase
Transformer Attribution 11.07 31.21 50.51 15.87
Ours 10.19 32.55 48.41 16.92
tion and ground truth label for the input image, and
the first row is a false prediction case. Figure 6 shows
qualitative comparison results of the saliency maps.
The first column shows the input image, and the sec-
ond column shows the model’s prediction and ground
truth label for the input image.
In comparison with our method and other meth-
ods, the images predicted to be a Solar Dish and Pizza
show more highlighted in our method. This is be-
cause that the relevance scores among the tokens cor-
responding to the object are large, and the model can
predicts correctly the images reflected those relevance
scores. Except for the Gold Dish image, Grad-CAM,
Attention Rollout, and Transformer Attribution high-
lighted only one part of the object, and we can inter-
pret as if the rest of the object does not contribute to
the prediction. We considered that this phenomenon
occur because the relevance scores tend to be locally
larger. In contrast, our method further highlights one
part of the object while highlighting the whole of the
object, and we can interpret as if the whole of the ob-
ject contributes to the prediction.
In the case of Gold Dish, Indigo Bunting,
Samoyed, and Echidna, our method highlighted the
background such as branches, trees, and sand. One of
the factors is that the relevance scores between the
background and object have a value. If the model
can predicts correctly the images reflected the rele-
vance scores that have the relation between object and
background, the saliency map contains noise on back-
ground.
Our method is not perfect but Table 1 and Figure
6 demonstrated that our method is superior to Grad-
CAM, Attention Rollout, and Transformer Attribu-
tion in various indicators.
5.2 CLIP-ViT Results
Table 2 shows the Deletion, Insertion, Average drop,
and Average increase by our method and Transformer
Figure 7: Visualization results by our proposed method and
Transformer Attribution for CLIP-ViT.
Attribution for CLIP-ViT. In comparison with Trans-
former Attribution, our method improved the accu-
racy by approximately 0.88%, 1.34%, 2.1%, and
1.05% respectivelly.
Figure 8 shows qualitative comparison results for
the CLIP-ViT obtained by our method and Trans-
former Attribution. In the proposed method, the im-
age predicted to be ”Tank” is highlighted the caterpil-
lar portion. The images predicted to be ”Abacus” and
”Vestment” are more highlighted the object portion in
comparison with Transformer Attribution.
6 CONCLUSIONS
In this paper, we improved the Transformer Attribu-
tion which is a method for interpreting the Vision
Transformer. We calculate saliency maps by estimat-
ing whether the relevance score calculated from the
predictions of images reflecting the relevance score
correctly indicates the important areas affected the
ViT’s prediction. Transformer Attribution has a prob-
Vision Transformer Interpretability via Prediction of Image Reflected Relevance Among Tokens
105

lem that it fails to highlight objects of the predic-
tion class, however, the proposed method improved
the problem. Quantitative and qualitative evalua-
tions demonstrated the effectiveness of the proposed
method.
ACKNOWLEDGEMENTS
This research is partially supported by JSPS KAK-
ENHI Grant Number 22H04735 and 21K11971.
REFERENCES
Abnar, S. and Zuidema, W. (2020). Quantifying
attention flow in transformers. arXiv preprint
arXiv:2005.00928.
Carion, N., Massa, F., Synnaeve, G., Usunier, N., Kirillov,
A., and Zagoruyko, S. (2020). End-to-end object de-
tection with transformers. In European Conference on
Computer Vision, pages 213–229. Springer.
Caron, M., Touvron, H., Misra, I., J
´
egou, H., Mairal, J., Bo-
janowski, P., and Joulin, A. (2021). Emerging prop-
erties in self-supervised vision transformers. In Pro-
ceedings of the IEEE/CVF International Conference
on Computer Vision, pages 9650–9660.
Chattopadhay, A., Sarkar, A., Howlader, P., and Balasub-
ramanian, V. N. (2018). Grad-cam++: Generalized
gradient-based visual explanations for deep convolu-
tional networks. In 2018 IEEE Winter Conference
on Applications of Computer Vision, pages 839–847.
IEEE.
Chefer, H. et al. (2021). Transformer interpretability be-
yond attention visualization. In IEEE/CVF Confer-
ence on Computer Vision and Pattern Recognition,
pages 782–791.
Chen, P., Li, Q., Biaz, S., Bui, T., and Nguyen, A. (2022).
gscorecam: What objects is clip looking at? In Pro-
ceedings of the Asian Conference on Computer Vision,
pages 1959–1975.
Deng, J., Dong, W., Socher, R., Li, L.-J., Li, K., and Fei-
Fei, L. (2009). Imagenet: A large-scale hierarchical
image database. In IEEE Conference on Computer
Vision and Pattern Recognition, pages 248–255.
Dosovitskiy, A. et al. (2021). An image is worth 16x16
words: Transformers for image recognition at scale.
In International Conference on Learning Representa-
tions.
Jiang, P.-T., Zhang, C.-B., Hou, Q., Cheng, M.-M., and Wei,
Y. (2021). Layercam: Exploring hierarchical class ac-
tivation maps for localization. IEEE Transactions on
Image Processing, 30:5875–5888.
Liu, S., Zeng, Z., Ren, T., Li, F., Zhang, H., Yang, J.,
Li, C., Yang, J., Su, H., Zhu, J., et al. (2023).
Grounding dino: Marrying dino with grounded pre-
training for open-set object detection. arXiv preprint
arXiv:2303.05499.
Liu, Z., Hu, H., Lin, Y., Yao, Z., Xie, Z., Wei, Y., Ning,
J., Cao, Y., Zhang, Z., Dong, L., et al. (2022). Swin
transformer v2: Scaling up capacity and resolution.
In Proceedings of the IEEE/CVF Conference on Com-
puter Vision and Pattern Recognition, pages 12009–
12019.
Petsiuk, V., Das, A., and Saenko, K. (2018). Rise: Ran-
domized input sampling for explanation of black-box
models. arXiv preprint arXiv:1806.07421.
Radford, A. et al. (2021). Learning transferable visual mod-
els from natural language supervision. In Interna-
tional Conference on Machine Learning, pages 8748–
8763.
Ramaswamy, H. G. et al. (2020). Ablation-cam: Vi-
sual explanations for deep convolutional network
via gradient-free localization. In Proceedings of
the IEEE/CVF Winter Conference on Applications of
Computer Vision, pages 983–991.
Selvaraju, R. R., Cogswell, M., Das, A., Vedantam, R.,
Parikh, D., and Batra, D. (2017). Grad-cam: Visual
explanations from deep networks via gradient-based
localization. In Proceedings of the IEEE International
Conference on Computer Vision, pages 618–626.
Wang, H., Wang, Z., Du, M., Yang, F., Zhang, Z., Ding, S.,
Mardziel, P., and Hu, X. (2020). Score-cam: Score-
weighted visual explanations for convolutional neu-
ral networks. In Proceedings of the IEEE/CVF Con-
ference on Computer Vision and Pattern Recognition
Workshops, pages 24–25.
Wang, W., Xie, E., Li, X., Fan, D.-P., Song, K., Liang, D.,
Lu, T., Luo, P., and Shao, L. (2021). Pyramid vi-
sion transformer: A versatile backbone for dense pre-
diction without convolutions. In Proceedings of the
IEEE/CVF International Conference on Computer Vi-
sion, pages 568–578.
Xie, E., Wang, W., Yu, Z., Anandkumar, A., Alvarez, J. M.,
and Luo, P. (2021). Segformer: Simple and efficient
design for semantic segmentation with transformers.
Advances in Neural Information Processing Systems,
34:12077–12090.
Zheng, S., Lu, J., Zhao, H., Zhu, X., Luo, Z., Wang, Y., Fu,
Y., Feng, J., Xiang, T., Torr, P. H., et al. (2021). Re-
thinking semantic segmentation from a sequence-to-
sequence perspective with transformers. In Proceed-
ings of the IEEE/CVF Conference on Computer Vision
and Pattern Recognition, pages 6881–6890.
Zhou, B., Khosla, A., Lapedriza, A., Oliva, A., and Tor-
ralba, A. (2016). Learning deep features for discrim-
inative localization. In Proceedings of the IEEE Con-
ference on Computer Vision and Pattern Recognition,
pages 2921–2929.
ICPRAM 2024 - 13th International Conference on Pattern Recognition Applications and Methods
106
