
On Spectrogram Analysis in a Multiple Classifier Fusion Framework for
Power Grid Classification Using Electric Network Frequency
Georgios Tzolopoulos
a
, Christos Korgialas
b
and Constantine Kotropoulos
c
Department of Informatics, Aristotle University of Thessaloniki, Thessaloniki 54124, Greece
Keywords:
Electric Network Frequency (ENF), Power Grid Classification, Spectrogram Analysis, Data Augmentation,
Neural Architecture Search (NAS), Fusion Framework.
Abstract:
The Electric Network Frequency (ENF) serves as a unique signature inherent to power distribution systems.
Here, a novel approach for power grid classification is developed, leveraging ENF. Spectrograms are gener-
ated from audio and power recordings across different grids, revealing distinctive ENF patterns that aid in grid
classification through a fusion of classifiers. Four traditional machine learning classifiers plus a Convolutional
Neural Network (CNN), optimized using Neural Architecture Search, are developed for One-vs-All classifi-
cation. This process generates numerous predictions per sample, which are then compiled and used to train
a shallow multi-label neural network specifically designed to model the fusion process, ultimately leading to
the conclusive class prediction for each sample. Experimental findings reveal that both validation and testing
accuracy outperform those of current state-of-the-art classifiers, underlining the effectiveness and robustness
of the proposed methodology.
1 INTRODUCTION
The Electric Network Frequency (ENF) (Grigoras,
2005) serves as a “fingerprint”, potentially embed-
ded in multimedia content, such as audio record-
ings, that are captured in proximity to the power
mains (Cooper, 2009). ENF fluctuates instanta-
neously around its nominal value of 60 Hz in the
United States (US)/Canada or 50 Hz in the rest of
the world. These small fluctuations in frequency hold
great importance, providing invaluable insights into
forensic applications (Grigoras, 2007), (Ngharamike
et al., 2023a). Such applications extend to device
identification (Hajj-Ahmad et al., 2016), (Bykhovsky,
2020), (Ngharamike et al., 2023b), and verifying
the timestamp of multimedia recordings (Hua et al.,
2014), (Garg et al., 2013b), (Vatansever et al., 2022).
A notable application of ENF is the ability to
pinpoint the location of a recording at both inter-
grid and intra-grid localization levels. Inter-grid lo-
calization capitalizes on the distinctive ENF signa-
tures of different power grids, facilitating the deter-
mination of a recording’s broader geographical re-
a
https://orcid.org/0009-0000-0405-889X
b
https://orcid.org/0000-0001-5475-0518
c
https://orcid.org/0000-0001-9939-7930
gion or grid of origin. Meanwhile, intra-grid localiza-
tion focuses on the finer distinctions within a single
power grid. Despite the inherently high similarity of
ENF variations recorded concurrently at different lo-
cations within the same grid, discernible differences
have been observed, rooted in city-specific power
consumption changes and the time lags required for
load-related variations to disseminate across the grid
(Garg et al., 2013a), (Elmesalawy and Eissa, 2014).
Such discrepancies can also emerge from systemic
disruptions like power line switching or generator dis-
connections. For instance, a localized load change
might influence the ENF specifically in its vicinity,
while a substantial system change, like a generator
disconnection, has ramifications for the entire grid.
This shift, intriguingly, propagates across the East-
ern US grid at a staggering rate of roughly 500 miles
per second (Tsai et al., 2007). To classify audio
recordings captured in different power grids glob-
ally, the complexities of inter-grid characteristics have
prompted experts to develop various strategies. No-
tably, events such as the 2016 Signal Processing Cup
(Wu et al., 2016) have showcased these methods, ad-
vancing ENF-based forensics and reinforcing the au-
thenticity of multimedia recordings.
Here, inter-grid classification is tackled from the
perspective of the fusion of multiple machine learn-
Tzolopoulos, G., Korgialas, C. and Kotropoulos, C.
On Spectrogram Analysis in a Multiple Classifier Fusion Framework for Power Grid Classification Using Electric Network Frequency.
DOI: 10.5220/0012418400003654
Paper published under CC license (CC BY-NC-ND 4.0)
In Proceedings of the 13th International Conference on Pattern Recognition Applications and Methods (ICPRAM 2024), pages 91-99
ISBN: 978-989-758-684-2; ISSN: 2184-4313
Proceedings Copyright © 2024 by SCITEPRESS – Science and Technology Publications, Lda.
91

ing classifiers, including Logistic Regression, Naive
Bayes (NB), Random Forest (RF), and Multilayer
Perceptron (MLP), with an optimized Convolutional
Neural Network (CNN) using Neural Architecture
Search (NAS). To delve deeper, these classifiers are
trained on the spectrograms derived from audio and
power recordings captured in various grids. The val-
idation accuracy achieved through a One-vs-All clas-
sification signifies the effectiveness of the proposed
framework against the state-of-the-art methods for
power grid classification. In a nutshell, by leveraging
the strengths of multiple classifiers, the fusion model
provides robustness against overfitting and results in
improved generalization to unseen data, further en-
hancing the reliability of the proposed model.
The main contributions of the paper are as follows:
• A fusion model is developed that combines five
machine learning classifiers, including an opti-
mized CNN by means of NAS.
• Data augmentation is applied to the audio and
power recordings, which are then transformed
into spectrograms, focusing on the nominal fre-
quency of 50 or 60 Hz.
• One-vs-All classification is utilized. Testing accu-
racy was calculated to evaluate the effectiveness
of the proposed framework.
Related work is surveyed in Section 2, while in
Section 3 the proposed methodology is analyzed. In
Section 4, experimental results are presented and dis-
cussed. In Section 5, conclusions and insights to fu-
ture work are offered.
2 RELATED WORK
2.1 Power Grid Location Estimation
The fluctuating ENF is a potential tool for geolocation
and power grid identification, leveraging its distinct
imprints on multimedia recordings. Building upon the
principles of ENF signal applications, (Hajj-Ahmad
et al., 2013) enhanced grid identification with ad-
vanced machine learning techniques and an in-depth
analysis of ENF variations. Subsequently, (Hajj-
Ahmad et al., 2015) developed a multiclass machine
learning model that leveraged statistical ENF varia-
tions to accurately determine the power grid locations
of multimedia recordings, even in the absence of si-
multaneous power reference. Experiments conducted
in (Garg et al., 2013a) demonstrated that analyzing
ENF fluctuation similarities, which correlate with ge-
ographic distance, can estimate multimedia recording
locations with a high accuracy. In (Garg et al., 2021),
the potential of embedded ENF traces in multimedia
recordings was evaluated to determine a recording’s
specific location within a power grid, showcasing that
the correlation of high-pass filtered ENF signals de-
creases with greater geographic distance, thereby en-
abling the creation of trilateration-based localization
techniques. Machine learning algorithms were uti-
lized in (
ˇ
Sari
´
c et al., 2016), particularly the RF, to
classify ENF signals from various power grids, en-
hancing detection accuracy by introducing signal fea-
tures. In (Sarkar et al., 2019), a location-stamp au-
thentication method was introduced, employing ENF
sequences from digital recordings to verify the spe-
cific location of recordings, substantiated by apply-
ing a multiclass Support Vector Machine (SVM) clas-
sification model. Distribution-level ENF data from
the FNET/GridEye system were leveraged in (Yao
et al., 2017), introducing a hybrid method combining
wavelet-based signature extraction with neural net-
work learning to trace the location origins of ENF
signals accurately. In (Kim and Yoon, 2020), an ap-
proach to pinpoint a multimedia file’s playback loca-
tion was presented by analyzing ENF signals from on-
line streaming videos using a secondary interpolation,
which enhances the resolution of ENF signals by ap-
plying quadratic interpolation to the results of a Short-
Time Fourier Transform (STFT) and Autoregressive
Integrated Moving Average (ARIMA) modeling by-
passing the need for an additional interpolation step.
2.2 Ensemble Learning for Audio
Spectrogram Classification
Ensemble learning, by combining multiple machine
learning models, has shown great potential in audio
spectrogram classification (Mienye and Sun, 2022).
In (Jiang et al., 2019), 16 ensemble methodologies
were employed to analyze audio recordings, with a
particular focus on various spectrogram decomposi-
tion techniques. The accuracy of acoustic scene clas-
sification was significantly enhanced by combining
CNNs and ensemble classifiers using late fusion, as
demonstrated in (Alamir, 2021), surpassing the per-
formance of individual models. In (Le et al., 2019),
machine learning methodologies and ensemble classi-
fication techniques were applied to differentiate var-
ious types of baby cries from spectrogram images,
achieving high accuracy. In (Nanni et al., 2020),
an ensemble method was created for automated au-
dio classification by fusing different features from au-
dio recordings, improving accuracy over existing ap-
proaches, and marking a significant advancement in
CNN-based animal audio classification. The effec-
tiveness of the self-paced ensemble learning scheme,
ICPRAM 2024 - 13th International Conference on Pattern Recognition Applications and Methods
92
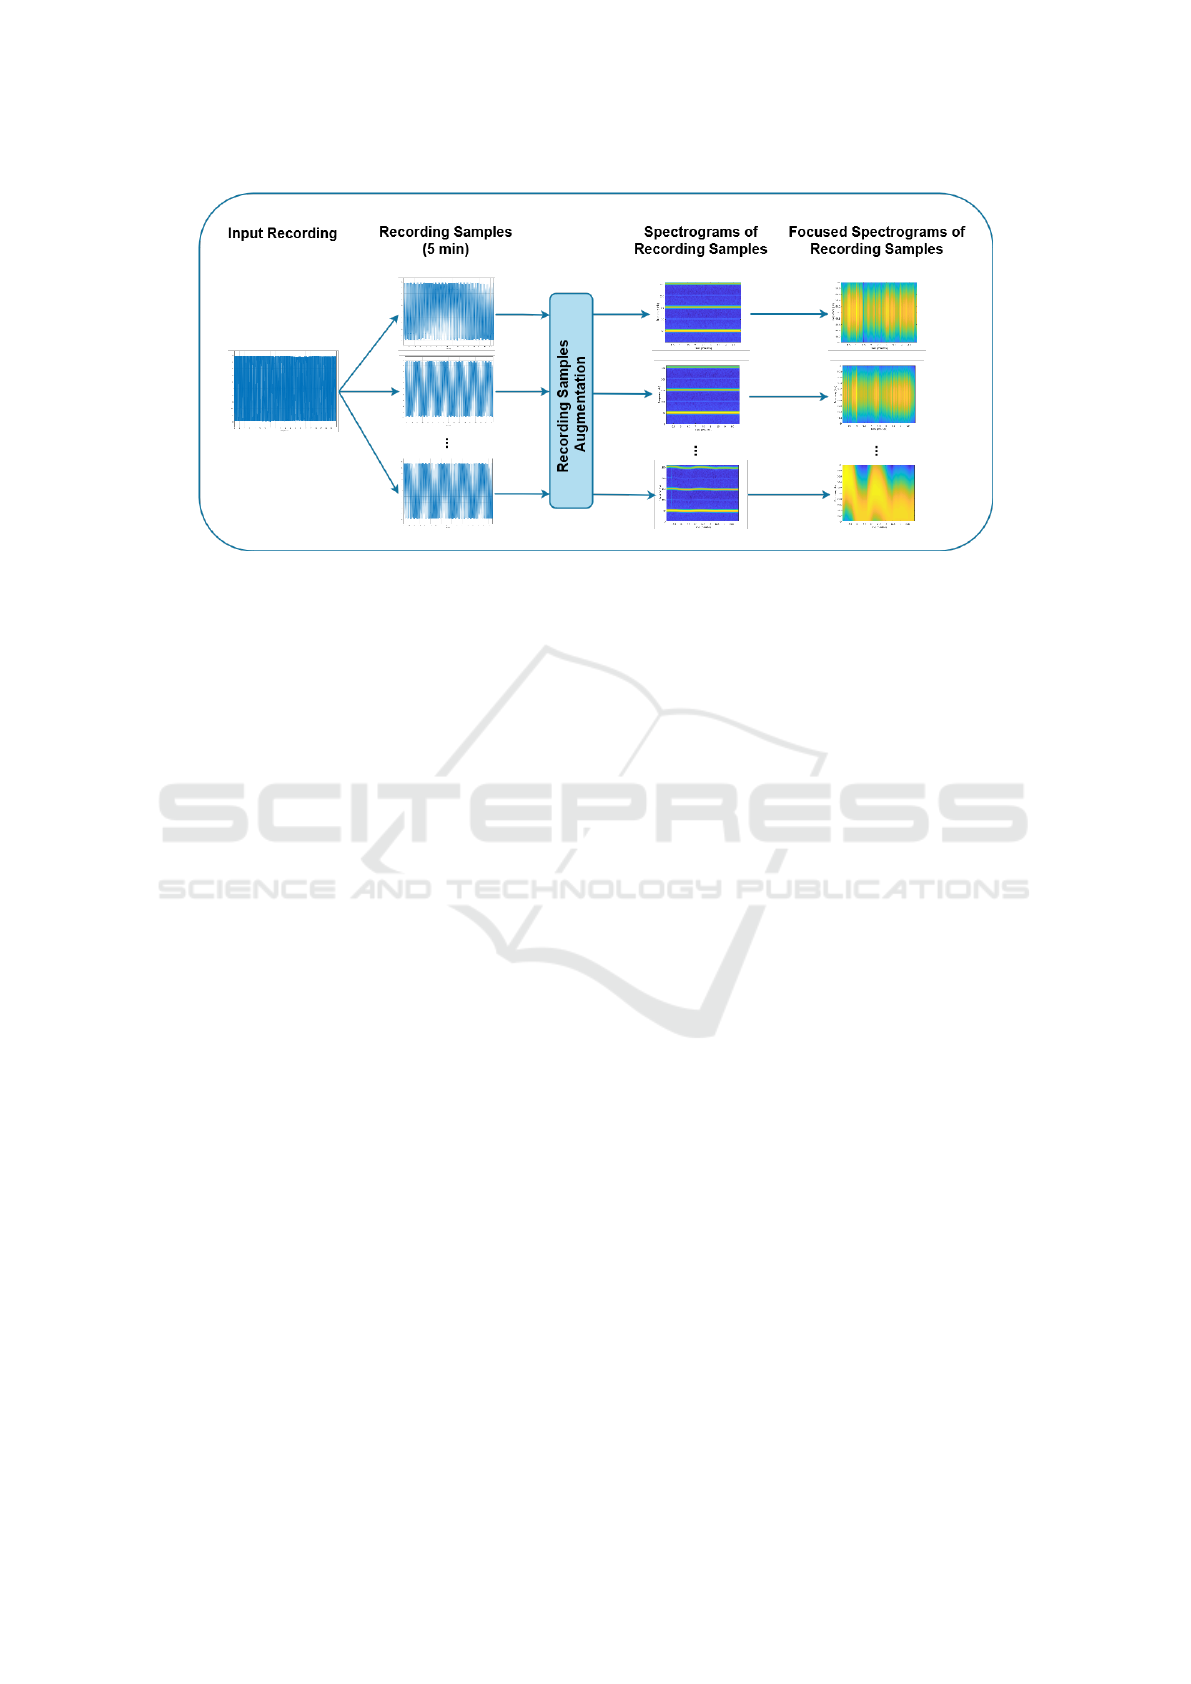
Figure 1: Flowchart illustrating the preprocessing steps of the audio and power recordings.
where models iteratively learn from each other, was
significantly demonstrated in (Ristea and Ionescu,
2021), outperforming baseline ensemble models in
three audio tasks.
3 METHODOLOGY
In this Section, the composition of the dataset, as
well as the preprocessing steps applied, are out-
lined. Moreover, the proposed fusion framework is
described.
3.1 Data Description and Preprocessing
Here, the dataset from the 2016 Signal Processing
(SP) Cup (Hajj-Ahmad, 2016) is used. The dataset
comprises recordings from nine distinct power grids,
each labeled from A
A
A to I
I
I. Recordings from grids A
A
A,
C
C
C, and I
I
I include a 60 Hz ENF signal, while the re-
maining grids feature a 50 Hz nominal ENF. More-
over, audio recordings are included from a variety of
settings, and power recordings are obtained through
a special circuit, with durations varying from 30 to
60 minutes. The power recordings contain inherently
stronger ENF traces, whereas audio recordings ex-
hibit a higher degree of noise, rendering ENF uti-
lization a more challenging endeavor. For testing
purposes, 100 additional 10-minute long recordings,
comprising 40 audio and 60 power recordings, are
provided. The audio recordings are obtained by plac-
ing microphones near power devices to capture their
characteristic hum. Some of these recordings belong
to grids not included in the original nine ones and are
thus to be classified as “None” (N
N
N).
Figure 1 summarizes the preprocessing steps ap-
plied to the audio and power recordings from the
power grids labeled A
A
A to I
I
I. The figure depicts the
transformation of raw audio data into a form suitable
for the detailed analysis of ENF signals. Each record-
ing is initially segmented into 5-minute samples, pro-
viding a uniform length for all samples. These sam-
ples are then augmented with white noise, specifi-
cally around the frequency band centered on 50 to 60
Hz with a ± 1 Hz tolerance. Subsequently, the aug-
mented audio samples are transformed into spectro-
grams, with the yellow lines denoting the presence of
the ENF signals at either 50 or 60 Hz, as well as their
higher harmonics. The final preprocessing step in-
volves focusing the spectrogram on the nominal value
of ENF (i.e., 50 or 60 Hz), depending on the grid in
question. The focused spectrograms will be utilized
as inputs to the five classifiers in the fusion frame-
work during both training and testing phases (see Sec-
tion 3.3).
3.2 Overview of Classifiers
Here, the five classifiers integrated into the fusion
model are described. A Logistic Regression model
with an ℓ
2
penalty and a regularization constant of 1.0
is chosen for its effectiveness in binary classification.
A Naive Bayes classifier is employed, adjusted with
a smoothing factor of 10
−9
to improve performance
on sparse data. An MLP featuring two hidden lay-
ers, the first with 100 neurons and the second with
50 neurons, is included. An RF classifier is incorpo-
rated, consisting of 100 trees allowed to be fully de-
veloped for data division, with feature selection con-
ducted automatically. Most of the parameters utilized
in the classifiers are sourced from the scikit-learn
library (Pedregosa et al., 2011).
On Spectrogram Analysis in a Multiple Classifier Fusion Framework for Power Grid Classification Using Electric Network Frequency
93
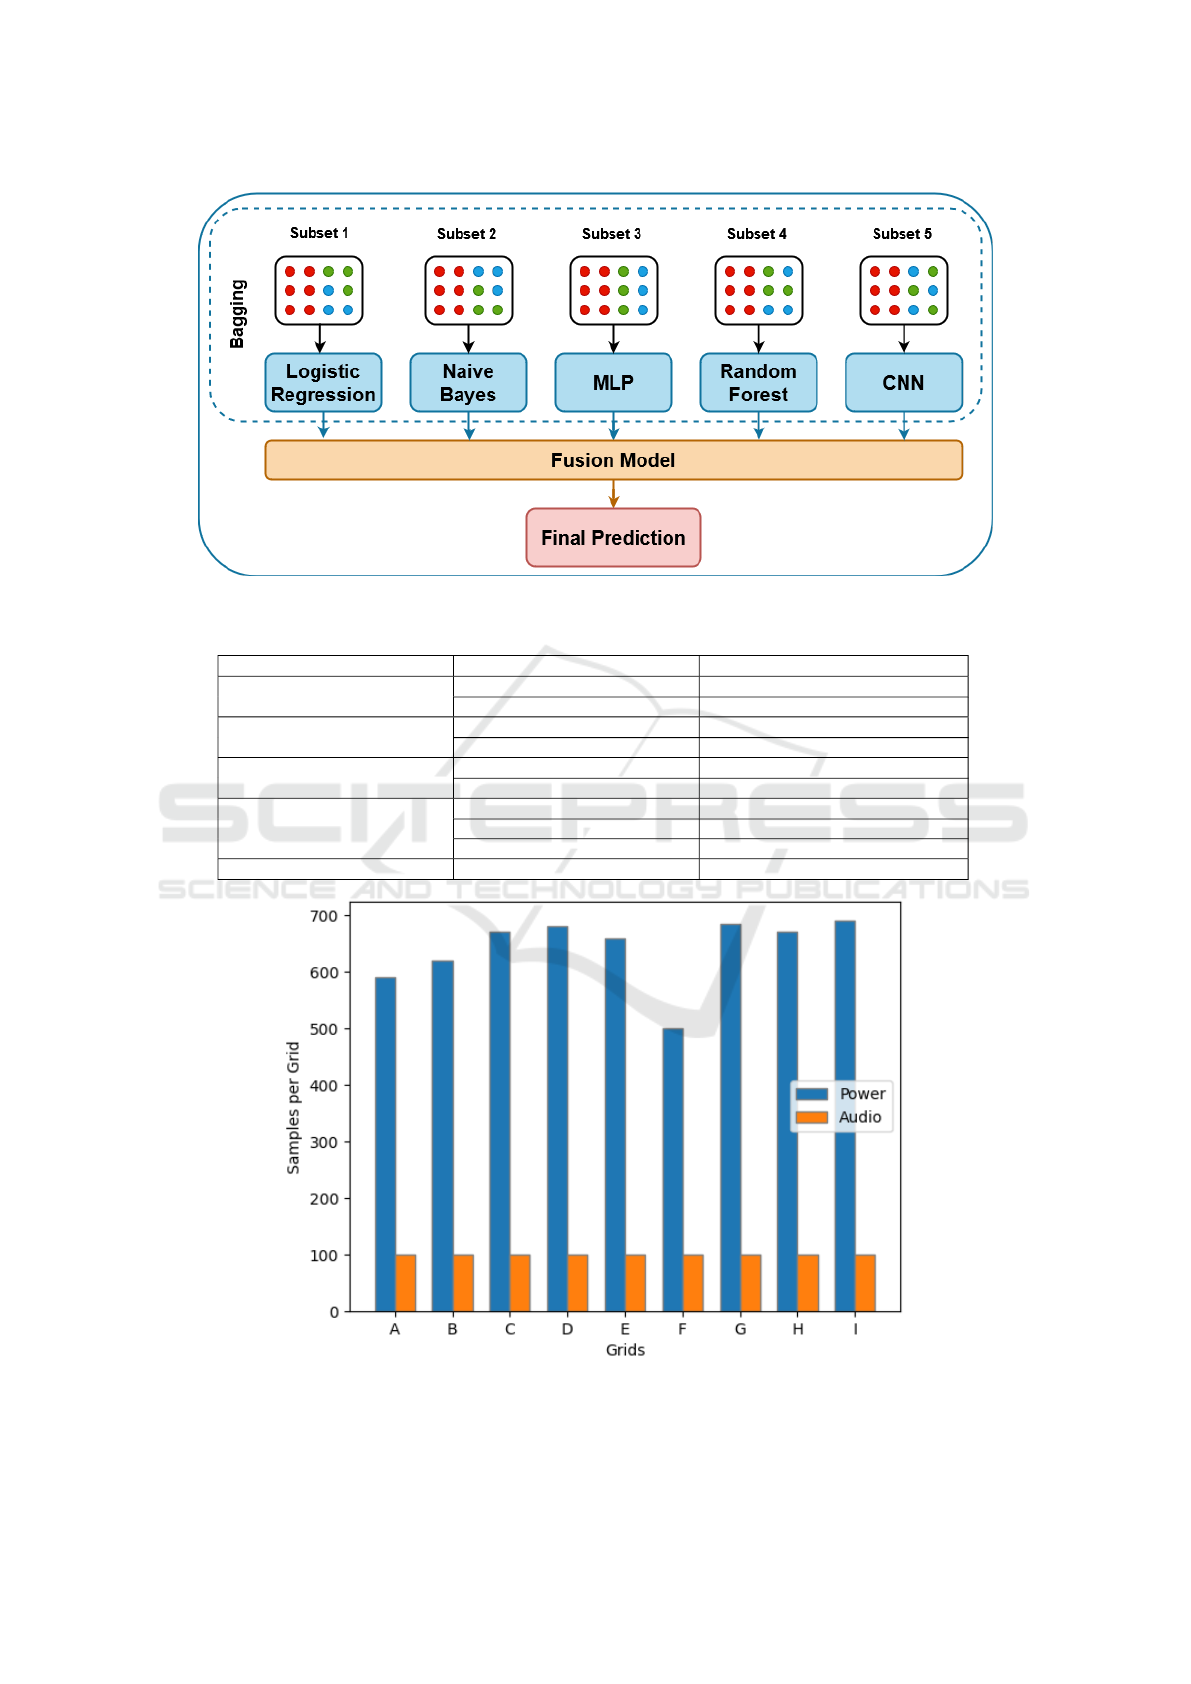
Figure 2: Flowchart of the proposed fusion framework for power grid classification.
Table 1: Architecture of the optimized CNN.
Layer Output
Layer 1
Conv2D 72,540 ×32
MaxPool 18,135 ×32
Layer 2
Conv2D 16,907 ×64
MaxPool 4,074 ×64
Layer 3
Conv2D 3,467 ×128
MaxPool 864 ×128
Layer 4
Flatten 110,592
Dense 101
Dropout 101
Layer 5 Dense 1
Figure 3: Number of audio and power recording frames in each grid.
ICPRAM 2024 - 13th International Conference on Pattern Recognition Applications and Methods
94

In Table 1, the optimized CNN architecture is
presented, employing the NAS approach (see Sec-
tion 4.1). The CNN’s architecture progresses through
sequential layers, starting with two-dimensional con-
volutions and max-pooling operations, which gradu-
ally reduce the spatial dimensions of the input spec-
trograms while increasing their depth to encapsulate
more complex features. As the architecture advances,
these refined two-dimensional feature maps are trans-
formed into a one-dimensional vector through a flat-
tening process. This vector is then processed by suc-
cessive dense layers designed to interpret the features
abstracted from the ENF spectrograms. A dropout
layer is included to mitigate overfitting by randomly
omitting a proportion of the input units during the
training phase. The output layer, a single dense unit,
is pivotal for the implementation of the ‘One-vs-All’
classification strategy, allowing the model to predict
the probability that a given ENF spectrogram belongs
to one of nine classes (A
A
A to I
I
I) by comparing it against
all others, thus enabling the determination of the most
likely class for each instance.
3.3 Fusion Framework
The proposed framework is detailed (see Figure 2),
encompassing the data-splitting process and the fu-
sion model description.
The recordings fall into two independent cate-
gories: audio and power. Furthermore, grids with
ENF at 50 Hz are distinguishable from those with
ENF at 60 Hz. Consequently, the entire dataset
is divided into four distinct sub-datasets: audio50,
audio60, power50, and power60.
While this categorization is known during the
training phase through the provided data description,
testing requires developing methods to identify each
sample’s category. The distinction between audio
and power can be perceived by human hearing, given
that audio recordings exhibit a significantly lower
signal-to-noise ratio (SNR) than power recordings.
This characteristic can be leveraged to automate au-
dio/power identification. Recordings containing ENF
at 50 Hz exhibit higher frequency content in the bands
near 50 Hz and in their harmonics. The same ap-
plies to recordings containing ENF at 60 Hz. Thus, a
method was devised to compare the magnitude of the
Fourier Transform at the first harmonic of the record-
ings for both nominal frequencies, enabling the deter-
mination of the ENF of a recording.
The dataset is divided into four independent sub-
sets in the data-splitting process. This methodol-
ogy applies to all classes, regardless of the number
of resulting classes. The classification framework is
structured around classes G
ENF
REC
= {C
1
,C
2
,. . .,C
n
}
1
,
where n = 3 for class from grids with ENF in 60Hz
and n = 6, otherwise. Let C
i
consist of data sam-
ples x
i, j
, where i indicates the class index and j is
the sample index within that class. These samples are
characterized by having the same nominal ENF and
recording type (REC).
For illustration, let us consider the audio60 sub-
dataset, which contains audio recordings from grids
A
A
A, C
C
C, and I
I
I. The classification challenge then narrows
down to G
60
audio
. Consequently, the training dataset is
defined as X = {x
i, j
| x
i, j
∈ C
i
,∀ i ∈ {1, 2,... , n}} for
n = 3, with each x
i, j
representing a data sample in
class C
i
, for n = 3. The corresponding label set is
Y = {y
i, j
| y
i, j
∈ C
i
,∀ i ∈ {1,2, . ..,n}}, where y
i, j
is
the label associated with sample x
i, j
.
For audio recordings, samples are uniformly dis-
tributed across classes (see Figure 3). However, this
uniformity does not hold for power recordings. Such
uneven distribution could potentially lead to overfit-
ting in favor of a class with more samples while train-
ing a multi-label model. To mitigate this, a One-vs-
All strategy with |G| models is devised, where |G|
stands for the cardinality, indicating the total number
of distinct classes in G. Each model, denoted as M
i
,
is designed to separate samples of class C
i
from sam-
ples of classes {C
j
| i ̸= j}. During the training of
M
i
, all training samples of class C
i
are utilized, along
with an equal number of samples from each class C
j
,
i ̸= j, maintaining collinearity with the number of
samples in C
i
. This results in balanced training sets
for each model, posing a binary classification prob-
lem for each.
No individual classifier among those described in
Section 3.2 yields adequate accuracy, as seen in Ta-
ble 2. The same One-vs-All strategy is applied to
each classifier. To introduce diversity, the bagging
technique is employed (Breiman, 1996), utilizing dif-
ferent data subsets corresponding to classes C
j
, where
i ̸= j, for training M
i
for every classifier. Figure 2 il-
lustrates that each classifier is trained using a separate
data subset. This approach utilizes all available data,
enhancing the generality of the final model.
For the final class prediction of a sample, a fusion
of decisions (depicted by the orange box in Figure 2)
from the individual models is necessary. This process
combines the strengths of all classifiers, contributing
to creating a robust final model that summarizes the
knowledge encoded in the models. Each sample un-
der analysis generates a substantial number of 5× |G|
predictions. This number arises from combining five
distinct classifiers, each contributing |G| predictions.
1
For ease of notation, the term G
ENF
REC
will be referred to
as G.
On Spectrogram Analysis in a Multiple Classifier Fusion Framework for Power Grid Classification Using Electric Network Frequency
95

Table 2: Comparison of average validation accuracies (%) for five classifiers and the fusion model.
Type Classifier A
A
A B
B
B C
C
C D
D
D E
E
E F
F
F G
G
G H
H
H I
I
I
Audio
Naive Bayes 72.4 67.5 78.8 75 75 95 80 52.5 87.5
Logistic Regression 100 95 85 95.5 100 95 92.5 82.5 100
RandomForest 95 92.5 87.5 97.5 100 100 97.5 85 97.5
MLP 97.5 85 85 47.5 95 95 85 87.5 100
CNN 98.3 95 94.7 100 99.3 100 99.1 92.8 99.3
Fusion Model 100 97.4 98.1 100 100 100 98.2 95.6 100
Power
Naive Bayes 79.7 81.9 85.63 89.9 84.8 88 90.63 61.9 79.6
Logistic Regression 98.8 99.25 97.4 97.3 97 98.5 91.6 98.5 100
RandomForest 100 100 99.3 100 100 100 97.8 99.6 99.6
MLP 100 100 98.9 98.9 95 100 98.2 98.9 100
CNN 99 100 100 100 99.3 100 98.1 100 100
Fusion Model 100 100 99.7 100 100 100 98.4 100 100
Table 3: Fusion framework accuracy (%) in the testing set.
Type A
A
A B
B
B C
C
C D
D
D E
E
E F
F
F G
G
G H
H
H I
I
I N
N
N Overall
Audio 100 100 100 100 100 100 100 75 100 25 90
Power 100 100 100 100 100 100 100 100 100 100 100
All 100 100 100 100 100 100 100 90 100 70 96
The framework also addresses the challenge posed
by different durations of training and testing samples.
While training samples are of 5-minute length, testing
samples are twice as long, requiring them to be split
into two separate 5-minute segments. Consequently,
this splitting leads to a total of 2 × 5 × |G| predic-
tions for each testing sample, encompassing predic-
tions for each segment by each classifier across all
models. These estimations describe the assessment of
a sample from various perspectives, as indicated by
different classifiers.
Fusing all the predictions is necessary to distill
meaningful insights from this diverse information.
The fusion process extracts the final prediction for the
grid of the recording. Thus, all the predictions for one
sample are then compiled into vectors of size 10×|G|,
which are instrumental in training a specialized shal-
low multi-label neural network. The neural network
features a single hidden layer with 50 neurons. This
neural network makes the final class prediction. Fur-
thermore, the framework includes a strategy for han-
dling records from unknown networks, employing a
threshold of 0.8 to determine the network’s confi-
dence level. If this threshold is not met, the sample
is labeled with N
N
N, indicating an unknown grid origin.
4 EXPERIMENTAL EVALUATION
The experimental evaluation of the fusion frame-
work
2
is detailed, encompassing the description of the
training and testing phases. The framework’s perfor-
mance is also assessed against state-of-the-art meth-
ods, employing the 2016 SP Cup dataset.
4.1 Model Training and Testing
The training process initiates with the partitioning
of the training dataset, allocating 80% for training
the five individual classifiers, as described in Sec-
tion 3.2, and reserving the remaining for training the
fusion model, elaborated in Section 3.3. Within these
datasets, 20% is set aside for model validation. Each
training set is distinct, following the data bagging
method in the context of the five classifiers.
For CNN training (see Table 1) to attain the high-
est classification performance, a NAS is conducted
using the Optuna library (Akiba et al., 2019). The
search involves adjusting hyperparameters, like the
number of dense units, learning rate, and optimizer
values. In the optimization process, the learning rate
and the parameters for the Adaptive Moment Estima-
tion (Adam) optimizer (Kingma and Ba, 2014) were
subject to fine-tuning. Initially, the learning rate was
set within a range from 10
−4
to 10
−2
, and the β values
for the Adam optimizer varied between 0.9 to 0.999
2
https://github.com/GeorgeJoLo/ENFusion
ICPRAM 2024 - 13th International Conference on Pattern Recognition Applications and Methods
96

Table 4: Performance comparison of various classification methods on the 2016 SP Cup dataset.
Method Accuracy
SVM, One-vs-One 86%
(Triantafyllopoulos et al., 2016)
Multiclass SVM 77%
(Ohib et al., 2017)
Random Forrest, SVM, and AdaBoost 88%
(El Helou et al., 2016)
Binary SVM 87%
(Despotovi
´
c et al., 2016)
Multi-Harmonic Histogram Comparison 88%
(Chow et al., 2016)
Multiclass SVM 88%
(Zhou et al., 2016)
Fusion Framework (Here) 96%
and 0.99 to 0.999, respectively. After optimization
with the Optuna library, the ideal settings were estab-
lished as a learning rate of 7.2 ×10
−4
, with β
1
at 0.98,
influencing the exponential decay rate for the first mo-
ment estimates, and β
2
at 0.99, impacting the second-
moment estimates in the Adam optimizer. This con-
figuration helps in balancing the influence of past and
current gradients for efficient optimization. Addition-
ally, the effectiveness of the CNN was further en-
hanced by integrating extra convolutional and dropout
layers, significantly improving its performance and
generalization capabilities.
The training procedure for each model, including
fusion, is iterated 20 times, and the average valida-
tion accuracy is summarized in Table 2. The table
provides insights into the performance of these clas-
sifiers across both audio and power data classification
tasks.
Across the audio classification task, it is evident
that the fusion model achieves the best classification
accuracy in 8 out of the 9 classes. However, for the
class of the grid G
G
G, the optimized CNN outperforms
the proposed fusion framework. On the other hand,
when power data are employed, the fusion model
demonstrates its prowess by achieving the best clas-
sification accuracy in 8 classes.
In this context, each classifier achieves commend-
able accuracy individually. Nevertheless, within the
fusion model, a comprehensive solution emerges,
showcasing a collective synergy that consistently out-
performs the performance of the classifiers when em-
ployed separately. These results underscore the fusion
model’s adaptability in addressing a range of classifi-
cation challenges by leveraging the strengths of the
five classifiers.
The efficacy of the proposed fusion framework is
assessed based on the accuracy attained across the
100 testing samples, as detailed in Table 3. No-
tably, the framework accurately predicts all samples
for power recordings since the overall accuracy for
them is 100%. Among the forty audio samples, four
are misclassified, resulting in a measured accuracy of
90% for the audio recordings, which inherently pose
a greater difficulty in recognition due to the weaker
ENF traces. Additionally, except for one error in class
H
H
H, associated with the lowest fusion model accuracy
rate for audio, misclassifications occur for grids out-
side the known A
A
A-I
I
I, that should have been classified
as N
N
N. In summary, the proposed fusion framework
achieves an overall accuracy of 96% across the entire
testing set.
4.2 Discussion
In Table 4, various classification methods are devel-
oped, which focus on power grid classification us-
ing the 2016 SP Cup data incorporating the state-of-
the-art methods that exhibit varying levels of perfor-
mance in power grid classification. Commonly shared
among these methods is the application of statistical
analysis techniques, including utilizing statistical mo-
ments and incorporating wavelet features and window
On Spectrogram Analysis in a Multiple Classifier Fusion Framework for Power Grid Classification Using Electric Network Frequency
97

feature extraction methods during the processing of
the extracted ENF signal.
The proposed fusion framework achieves a 96%
accuracy, outperforming the competitors listed in Ta-
ble 4. The accuracies presented in Table 4 are de-
rived from the evaluations using the test set as in Ta-
ble 3. This achievement is not only a testament to the
framework’s capabilities for data preprocessing anal-
ysis but also encompasses steps like audio augmen-
tation and spectrogram generation. Moreover, utiliz-
ing the focused spectrogram within the fusion of clas-
sifiers adds an extra layer of robustness, indicating
the model’s competence in addressing the challenges
posed by power grid classification.
The proposed fusion framework demonstrates
limited proficiency in recognizing records from grids
not included in the training dataset. Table 3 illustrates
this constraint, wherein among the ten samples ex-
pected to belong to class N
N
N, three are inaccurately
classified into other classes. These samples should
perform ENF signals similar to already known girds.
This observation highlights a significant challenge in
grid identification, underscoring the subtle nature of
ENF differences among distinct grids. Additionally,
identifying samples originating from unknown grids
necessitates a dedicated study, indicating an avenue
for further exploration and refinement in future re-
search endeavors.
5 CONCLUSIONS
In this paper, a novel fusion framework for power grid
classification has been proposed. The fusion frame-
work, which integrates a CNN optimized via NAS
with four traditional machine learning classifiers, has
significantly advanced this field. The unique strategy
of data augmentation and transformation of audio and
power samples into spectrograms has been effectively
utilized, focusing on the nominal frequencies to en-
hance the robustness and accuracy of the model. Fur-
thermore, employing a One-vs-All classification strat-
egy has been instrumental in achieving superior accu-
racy rates in both training and testing phases, outper-
forming the state-of-the-art methods. This approach
has amplified the model’s effectiveness in distinguish-
ing between different grids and contributed to its ro-
bustness against overfitting. Future research could
focus on collecting and integrating data from addi-
tional power grids, thereby expanding the dataset and
offering a more thorough evaluation of the proposed
methodology’s efficacy.
ACKNOWLEDGEMENTS
This research was supported by the Hellenic Foun-
dation for Research and Innovation (H.F.R.I.) under
the “2nd Call for H.F.R.I Research Projects to support
Faculty Members & Researchers” (Project Number:
3888).
REFERENCES
Akiba, T., Sano, S., Yanase, T., Ohta, T., and Koyama, M.
(2019). Optuna: A next-generation hyperparameter
optimization framework. In Proceedings of the 25th
ACM International Conference on Knowledge Discov-
ery & Data Mining, pages 2623–2631.
Alamir, M. A. (2021). A novel acoustic scene classifica-
tion model using the late fusion of convolutional neu-
ral networks and different ensemble classifiers. Ap-
plied Acoustics, 175:107829.
Breiman, L. (1996). Bagging predictors. Machine Learn-
ing, 24:123–140.
Bykhovsky, D. (2020). Recording device identification by
ENF harmonics power analysis. Forensic Science In-
ternational, 307:110100.
Chow, C., Dykes, G., Moore, A., Qu, X., Sowell, S., Wei,
S., Zhu, F., Vondersaar, B., and Chan, S. H. (2016).
Multi-harmonic histogram comparison. Technical re-
port, Purdue University. Signal Processing Cup.
Cooper, A. J. (2009). An automated approach to the electric
network frequency (ENF) criterion: Theory and prac-
tice. International Journal of Speech, Language & the
Law, 16(2):193–218.
Despotovi
´
c, D., Kne
ˇ
zevi
´
c, M.,
ˇ
Sari
´
c,
ˇ
Z., Zrni
´
c, T.,
ˇ
Zuni
´
c,
A., Deli
´
c, T., and N., J. (2016). Exploring power
signatures for location forensics of media recordings.
Technical report, University of Novi Sad, Serbia. Sig-
nal Processing Cup.
El Helou, M., Turkmani, A. W., Chanouha, R., and Char-
baji, S. (2016). A novel ENF extraction approach
for region-of-recording identification of media record-
ings. In Proceedings of the Computer Science & In-
formation Technology, page 97–108. CSCP.
Elmesalawy, M. M. and Eissa, M. M. (2014). New foren-
sic ENF reference database for media recording au-
thentication based on harmony search technique using
GIS and wide area frequency measurements. IEEE
Transactions on Information Forensics and Security,
9(4):633–644.
Garg, R., Hajj-Ahmad, A., and Wu, M. (2013a). Geo-
location estimation from electrical network frequency
signals. In Proceedings of the 2013 IEEE Interna-
tional Conference on Acoustics, Speech and Signal
Processing, pages 2862–2866. IEEE.
Garg, R., Hajj-Ahmad, A., and Wu, M. (2021). Feasibil-
ity study on intra-grid location estimation using power
ENF signals. arXiv preprint arXiv:2105.00668.
Garg, R., Varna, A. L., Hajj-Ahmad, A., and Wu,
M. (2013b). “Seeing” ENF: Power-signature-based
ICPRAM 2024 - 13th International Conference on Pattern Recognition Applications and Methods
98

timestamp for digital multimedia via optical sensing
and signal processing. IEEE Transactions on Infor-
mation Forensics and Security, 8(9):1417–1432.
Grigoras, C. (2005). Digital audio recording analysis–the
electric network frequency criterion. International
Journal of Speech Language and the Law, 12(1):63–
76.
Grigoras, C. (2007). Applications of ENF criterion in
forensic audio, video, computer and telecommunica-
tion analysis. Forensic Science International, 167(2-
3):136–145.
Hajj-Ahmad, A. (2016). ENF power frequency data for lo-
cation forensics. https://dx.doi.org/10.21227/H2159S.
Signal Processing Cup.
Hajj-Ahmad, A., Berkovich, A., and Wu, M. (2016). Ex-
ploiting power signatures for camera forensics. IEEE
Signal Processing Letters, 23(5):713–717.
Hajj-Ahmad, A., Garg, R., and Wu, M. (2013). ENF based
location classification of sensor recordings. In Pro-
ceedings of the 2013 IEEE International Workshop on
Information Forensics and Security, pages 138–143.
IEEE.
Hajj-Ahmad, A., Garg, R., and Wu, M. (2015). ENF-based
region-of-recording identification for media signals.
IEEE Transactions on Information Forensics and Se-
curity, 10(6):1125–1136.
Hua, G., Goh, J., and Thing, V. L. (2014). A dynamic
matching algorithm for audio timestamp identification
using the ENF criterion. IEEE Transactions on Infor-
mation Forensics and Security, 9(7):1045–1055.
Jiang, S., Shi, C., and Li, H. (2019). Acoustic scene classi-
fication using ensembles of convolutional neural net-
works and spectrogram decompositions. In Mandel,
M., Salamon, J., and Ellis, D. P. W., editors, Proceed-
ings of the 2019 Challenge on Detection and Classi-
fication of Acoustic Scenes and Events, pages 45–49.
New York University, NY, USA.
Kim, S. and Yoon, J. W. (2020). Location tracking tech-
nique for regional ENF classification using ARIMA.
In Proceedings of the 2020 International Conference
on Information and Communication Technology Con-
vergence, pages 1321–1324. IEEE.
Kingma, D. P. and Ba, J. (2014). Adam: A
method for stochastic optimization. arXiv preprint
arXiv:1412.6980.
Le, L., Kabir, A. N. M., Ji, C., Basodi, S., and Pan, Y.
(2019). Using transfer learning, svm, and ensem-
ble classification to classify baby cries based on their
spectrogram images. In Proceedings of the 2019 IEEE
16th International Conference on Mobile Ad Hoc and
Sensor Systems Workshops, pages 106–110. IEEE.
Mienye, I. D. and Sun, Y. (2022). A survey of ensem-
ble learning: Concepts, algorithms, applications, and
prospects. IEEE Access, 10:99129–99149.
Nanni, L., Costa, Y. M. G., Aguiar, R. L., Mangolin,
R. B., Brahnam, S., and Silla, C. N. (2020). Ensem-
ble of convolutional neural networks to improve ani-
mal audio classification. EURASIP Journal on Audio,
Speech, and Music Processing, 2020(1):1–14.
Ngharamike, E., Ang, K. L.-M., Seng, J. K. P., and Wang,
M. (2023a). ENF based digital multimedia forensics:
Survey, application, challenges and future work. IEEE
Access, 11:101241–101272.
Ngharamike, E., Ang, L.-M., Seng, K. P., and Wang, M.
(2023b). Exploiting the rolling shutter read-out time
for ENF-based camera identification. Applied Sci-
ences, 13(8):5039.
Ohib, R., Arnob, S. Y., Arefin, R., Amin, M., and Reza, T.
(2017). ENF based grid classification system: Identi-
fying the region of origin of digital recordings. Crite-
rion, 3(4):5.
Pedregosa, F., Varoquaux, G., Gramfort, A., Michel, V.,
Thirion, B., Grisel, O., Blondel, M., Prettenhofer, P.,
Weiss, R., Dubourg, V., et al. (2011). Scikit-learn:
Machine learning in Python. The Journal of Machine
Learning Research, 12:2825–2830.
Ristea, N. C. and Ionescu, R. T. (2021). Self-paced ensem-
ble learning for speech and audio classification. arXiv
preprint arXiv:2103.11988.
ˇ
Sari
´
c,
ˇ
Z.,
ˇ
Zuni
´
c, A., Zrni
´
c, T., Kne
ˇ
zevi
´
c, M., Despo-
tovi
´
c, D., and Deli
´
c, T. (2016). Improving location
of recording classification using electric network fre-
quency (ENF) analysis. In Proceedings of the 2016
IEEE International Symposium on Intelligent Systems
and Informatics, pages 51–56. IEEE.
Sarkar, M., Chowdhury, D., Shahnaz, C., and Fattah, S. A.
(2019). Application of electrical network frequency
of digital recordings for location-stamp verification.
Applied Sciences, 9(15):3135.
Triantafyllopoulos, A., Foliadis, A., Roustas, G., Krillis,
I., Athanasiou, F., Papaioannou, M., and Skodras, A.
(2016). Exploring power signatures for location foren-
sics of media recordings. Technical report, University
of Patras, Greece. Signal Processing Cup.
Tsai, S.-J., Zhang, L., Phadke, A. G., Liu, Y., Ingram,
M. R., Bell, S. C., Grant, I. S., Bradshaw, D. T.,
Lubkeman, D., and Tang, L. (2007). Frequency sen-
sitivity and electromechanical propagation simulation
study in large power systems. IEEE Transactions on
Circuits and Systems I: Regular Papers, 54(8):1819–
1828.
Vatansever, S., Dirik, A. E., and Memon, N. (2022). ENF
based robust media time-stamping. IEEE Signal Pro-
cessing Letters, 29:1963–1967.
Wu, M., Hajj-Ahmad, A., Kirchner, M., Ren, Y., Zhang, C.,
and Campisi, P. (2016). Location signatures that you
don’t see: Highlights from the IEEE signal processing
cup 2016 student competition. IEEE Signal Process-
ing Magazine, 33(5):149–156.
Yao, W., Zhao, J., Till, M. J., You, S., Liu, Y., Cui, Y.,
and Liu, Y. (2017). Source location identification of
distribution-level electric network frequency signals at
multiple geographic scales. IEEE Access, 5:11166–
11175.
Zhou, H., Duanmu, H., Li, J., Ma, Y., Shi, J., Tan, Z., Wang,
X., Xiang, L., Yin, H., and Li, W. (2016). Geographic
location estimation from ENF signals with high ac-
curacy. Technical report, University of Science and
Technology of China. Signal Processing Cup.
On Spectrogram Analysis in a Multiple Classifier Fusion Framework for Power Grid Classification Using Electric Network Frequency
99
