
Experimental Flow Studies in PDMS Intracranial Aneurysms
Manufactured by Two Different Techniques
Andrews Souza
1,2,3 a
, Inês Afonso
1,3 b
, Violeta Carvalho
1,2,4,5 c
, Diana F. Rodrigues
1
,
Senhorinha Teixeira
4d
, João Eduardo Ribeiro
3e
, José Eduardo Socha Pereira
6f
,
Reinaldo Rodrigues de Souza
1,6 g
, Rui Lima
1,7 h
and Ana Sofia Moita
6i
1
MEtRICs, Mechanical Engineering Department, University of Minho, Campus de Azurém, 4800-058 Guimarães, Portugal
2
Center for MicroElectromechanical Systems (CMEMS-UMinho), University of Minho,
Campus de Azurém, 4800-058 Guimarães, Portugal
3
Campus de Santa Apolónia, CIMO—Instituto Politécncio de Bragança, 5300-253 Bragança, Portugal
4
ALGORITMI/LASI Center, University of Minho, Campus de Azurém, 4800‐058 Guimarães, Portugal
5
LABBELS—Associate Laboratory, Braga/Guimarães, Portugal
6
IN+, Center for Innovation, Technology and Policy Research, Instituto Superior Técnico, Universidade de Lisboa,
Av. Rovisco Pais, 1049-001, Lisboa, Portugal
7
CEFT, Faculdade de Engenharia da Universidade do Porto (FEUP), Rua Roberto Frias, 4200-465, Porto, Portugal
8
ALiCE - Associate Laboratory in Chemical Engineering, Faculty of Engineering, University of Porto,
Rua Dr. Roberto Frias, 4200-465 Porto, Portugal
st@dps.uminho.pt, jribeiro@ipb.pt, sochapereira@tecnico.ulisboa.pt, reinaldo.souza@tecnico.ulisboa.pt,
rl@dem.uminho.pt, anamoita@tecnico.ulisboa.pt
Keywords: Intracranial Aneurism Biomodels, PDMS, In vitro Flow Test, Biofluids, Additive Manufacturing, Polysmooth.
Abstract: The aim of this study was to investigate the flow within intracranial aneurysms, which are localized dilations
of the cerebral arteries that pose a risk of rupture and strokes. The experimental analysis was conducted on
scaled-down biomodels of a cerebral aneurysm to better understand its flow patterns. To carry out the
experimental phase, the biomodels were manufactured using rapid prototyping and lost core casting
techniques. The biomodels were assessed for optical transparency and dimensions, confirming their suitability
for flow visualization tests. The findings revealed that within the recirculation zones of the aneurysm, the
flow velocities were notably lower when compared to the entry and exit points. As the flow rate increased,
the recirculation focus gradually approached the aneurysm wall. Furthermore, the geometry of the aneurysm
played an important role in influencing the flow behavior. These insights are crucial, as they are linked to
some extent with the risk of intracranial aneurysm rupture, which may entail severe consequences. This study
enriches our understanding of the aneurysm flow dynamics and contributes to the development of the inherent
preventative and treatment measures.
1 INTRODUCTION
Intracranial aneurysms are localized dilations of the
arteries in the brain (Rodriguez-Régent et al., 2014).
a
https://orcid.org/0000-0003-2414-073X
b
https://orcid.org/0000-0001-6416-2867
c
https://orcid.org/0000-0002-9447-4746
d
https://orcid.org/0000-0002-7464-3944
e
https://orcid.org/0000-0001-6300-148X
f
https://orcid.org/0000-0001-7244-8611
g
https://orcid.org/0000-0001-5250-820X
h
https://orcid.org/0000-0003-3428-637X
i
https://orcid.org/0000-0001-9801-7617
These dilations can weaken the blood vessel wall and
increase the risk of rupture, becoming a significant
cause of cerebrovascular accidents. They usually
develop in the major arteries of the cerebral
152
Souza, A., Afonso, I., Carvalho, V., Rodrigues, D., Teixeira, S., Ribeiro, J., Pereira, J., Rodrigues de Souza, R., Lima, R. and Moita, A.
Experimental Flow Studies in PDMS Intracranial Aneurysms Manufactured by Two Different Techniques.
DOI: 10.5220/0012417600003657
Paper published under CC license (CC BY-NC-ND 4.0)
In Proceedings of the 17th International Joint Conference on Biomedical Engineering Systems and Technologies (BIOSTEC 2024) - Volume 1, pages 152-158
ISBN: 978-989-758-688-0; ISSN: 2184-4305
Proceedings Copyright © 2024 by SCITEPRESS – Science and Technology Publications, Lda.

circulation, particularly in specific locations within
the so-called "Willis polygon" (Lasheras, 2007).
Some studies have identified that the anterior cerebral
artery is involved in around 40% of cases of
intracranial aneurysm rupture (Inagawa 2010; Ye et
al. 2017).
These aneurysms can be classified into two main
groups based on their geometry and location:
fusiform and saccular, with saccular aneurysms being
the most common type, representing approximately
90% of cases (Lasheras 2007). Blood flow within
aneurysms depends on various factors, including the
size, shape of the aneurysm, and the geometry of the
originating artery (Ye et al. 2017).
To study these aneurysms, there are experimental
and numerical approaches. Experimental approaches
typically involve creating in vitro models that
simulate blood flow and artery deformation. Studies
show that the initial models were made of glass
(Ferguson, 1972), and later, silicone models emerged
(Steiger et al. 1988). Currently, they have been
produced using PDMS (Souza et al., 2020). In this
regard, various techniques have been applied to these
models, such as Magnetic Resonance, Doppler Laser,
Digital Image Correlation, PTV (Particle Tracking
Velocimetry), and PIV (Particle Image Velocimetry)
(Steiger et al. 1988; Roloff et al. 2013; Souza,
2020b). It should be noted that the most used
experimental technique to validate numerical
simulations is the PIV technique.
Manufacturing technology has evolved, using
materials like PDMS (polydimethylsiloxane) to
create aneurysm models. PDMS is chosen due to its
hyper elasticity, biocompatibility, and cost-
effectiveness (Miranda, 2022).
The manufacturing and subsequent experimental
studies of representative biomodels of a cerebral
aneurysm, with mechanical properties close to those
of arteries, are of utmost importance to understand the
phenomena responsible for the growth and rupture of
intracranial aneurysms (Souza et al., 2020; Rodrigues
et al. 2016). Therefore, the current work has the
primary objective of studying the blood flow in a
representative biomodel of a cerebral aneurysm,
specifically focusing on the fabrication of semi-rigid
optimized biomodels suitable for experimental flow
visualization.
In this regard, and considering the manufacturing
processes studied, IA (Intracranial Aneurism)
biomodels were manufactured. The first biomodel
was made using a manufacturing process described in
more detailed at Souza et al., 2020. Briefly, the
manufacture of the aneurysm lumen involves a
combination of additive manufacturing methods and
a lost core casting process using glycerin-based soap.
The second one was manufactured using the FDM
(Fused Deposition Modelling) technique and the
material used was polysmooth. This material allows
surface treatment with isopropyl alcohol to smooth
out the roughness from the printing process. At the
end of both processes, the lumens obtained are
positioned in an acrylic box where the PDMS were
casted by gravity and cured for 48 hours at room
temperature. The results of this work have shown that
the biomodels of beeswax and glycerine-based soap
were the most suitable in vitro models to perform
direct flow visualizations of particulate blood
analogue fluids. The authors proposed an effective
manufacturing method from real flow biomodels, at
the millimeter scale and suitable for hemodynamic
studies.
2 MATERIALS AND METHODS
2.1 Experimental Setup
For the experimental flow visualization tests, a set
interconnected equipment was essential. Two key
components worth mentioning include the high-speed
video device, which primarily featured a Photron
FASTCAM high-speed camera, complemented by
visualization software for post-processing and
analysis. In addition, an inverted microscope model
IX71 from Olympus™ was also used, together with a
N-Achroplan 2.5x/0.07 objective. Figure 1 illustrates
the primary equipment employed in this study,
including the high-speed camera, inverted
microscope, syringe pump, PDMS biomodel, and
acquisition system.
Figure 1: Schematic representation of the experimental
setup.
Experimental Flow Studies in PDMS Intracranial Aneurysms Manufactured by Two Different Techniques
153

2.2 Evaluation of the Optical
Transparency of the Biomodel
When studying biomodels, certain limitations must
be considered. One of these restrictions pertains to
optical properties, specifically the requirement that
the material used for the external biomodel must be
transparent, and its refractive index should closely
match that of the fluid used in experiments. This
alignment of refractive indexes is crucial to facilitate
experimental flow visualization tests on the PDMS
biomodels.
In cases where there is a significant disparity
between the refractive index of the fluid and that of
the PDMS, distortions may appear near the walls.
However, this distortion can be mitigated or
eliminated when the refractive index of the fluid
closely matches that of the biomodel material (Souza
et al., 2020).
It is important to bear this update issue in mind, as
it may subsequently have a negative influence on the
visualization of particles when carrying out the
experimental tests.
Thus, in the present study, with the aim of
evaluating the optical transparency of the biomodel,
two fluids with different physical properties were
considered, so that it was possible to make a
comparison and perceive the differences between
them. Therefore, one of the used fluids, which has a
refractive index very similar to that of PDMS, was a
mixture of liquid glycerin and distilled water, that is,
61 grams of liquid glycerin were diluted in distilled
water (61% w/w). The second used fluid was only
water.
It is important to mention that the application of
this technique, to evaluate the optical transparency of
the biomodel under study, was based on the work of
Hopkins et al., 2000.
The physical properties of the materials used in
the present study are summarized in Table 1:
Physical properties of the employed materials to
evaluate the optical transparency of biomodels..
It should be noted that these properties were
considered as explained in (Souza et al., 2020).
Table 1: Physical properties of the employed materials to
evaluate the optical transparency of biomodels.
Material Refractive
Index
Viscosity
(Pa. s)
Density
(k
g
/m
3
)
Wate
r
1.333 9.20 x10
-4
997
Glycerin
mixture
1.412 1.29 x10
-2
1153
PDMS 1.412 -
2.3 Flow Visualization Experimental
Testing
In the initial step, the PDMS biomodel was secured
under the microscope. Subsequently, a syringe pump
system, utilizing a Terumo™ 50 mL syringe, was
employed to deliver the working fluid at a fixed flow
rate. This fluid was pumped not only through the
channels connecting the syringe to the biomodel but
also within the biomodel itself.
The fluid used in this flow visualization
experiment was a mixture of liquid glycerin and 61%
distilled water (w/w). Additionally, 0.06% PMMA
(polymethylmethacrylate) particles with a 60 μm
diameter were suspended in this fluid. It's worth
noting that the selection of this fluid was based on
previous work conducted by Campo-Deaño et al.
(2013) and Pinho et al. (2017). Table 1 presents the
physical properties of the fluid under investigation,
including density, refractive index, and viscosity with
the suspended particles.
The primary objectives of this experimental test
were to evaluate, depending on the considered flow
rates, the occurrence of fluid recirculation, observed
by tracking particle trajectories. Additionally, the
study aimed to measure velocities in different zones
of the biomodel. It's important to mention that the in-
vitro study was conducted exclusively on the two
biomodels produced using additive manufacturing
molds.
For the case of the biomodel in which the inlet and
outlet channels have an angle of 180° between them,
six different flow rates were evaluated, i.e., 5 mL/min
(⇒ Re (Reynolds Number)=1.95), 6.8 mL/min (⇒
Re=2.65), 10 mL/min (⇒ Re=3.90), 20 mL/min (⇒
Re=7.80), 50 mL/min (⇒ Re =19.49) and still 100
mL/min (⇒ Re=38.99).
In turn, for the case of the biomodel in which the
inlet and outlet channels have an angle of 60° to each
other, only the flow rates of 8 mL/min (⇒ Re=3.12),
15 mL/min (⇒ Re=5.85), 30 mL/min (⇒ Re=11.70)
and 50 mL/min (⇒ Re=19.49) were inferred. It is
noteworthy to refer that, for this second biomodel, the
study started with a flow rate of 8 mL/min, because
during the experimental test, this was the flow rate
from which the phenomenon of recirculation began to
be verified.
2.4 Evaluation of the Geometric
Structure of the Molds and
Biomodels
One of the requirements regarding the manufacture of
biomodels is that their geometries must correspond to
BIODEVICES 2024 - 17th International Conference on Biomedical Electronics and Devices
154
the original STL (Standard Tessellation Language)
model. In this sense, and with the aim of verifying this
issue, images were acquired, both of the biomodels
and of the aneurysms (molds) that originated the
biomodels, using the inverted microscope used in the
experimental tests. It should be emphasized that both
the aneurysms and the biomodels measured were only
those that showed a 50% reduction. Once the images
were obtained, there were carried out measurements
in the different locations, using the ImageJ software.
It's important to note that dimensions were
evaluated for all three biomodels produced and
studied in this work. This includes the two biomodels
with polysmooth lost nuclei (featuring different
geometries) and the biomodel with the glycerin-based
soap core, although no experimental tests were
conducted on the latter.
The dimensions of both the resin aneurysm and
the polysmooth aneurysms with different geometries
were assessed. It's worth highlighting that for the
polysmooth aneurysms, measurements were taken
both before and after the application of the superficial
treatment.
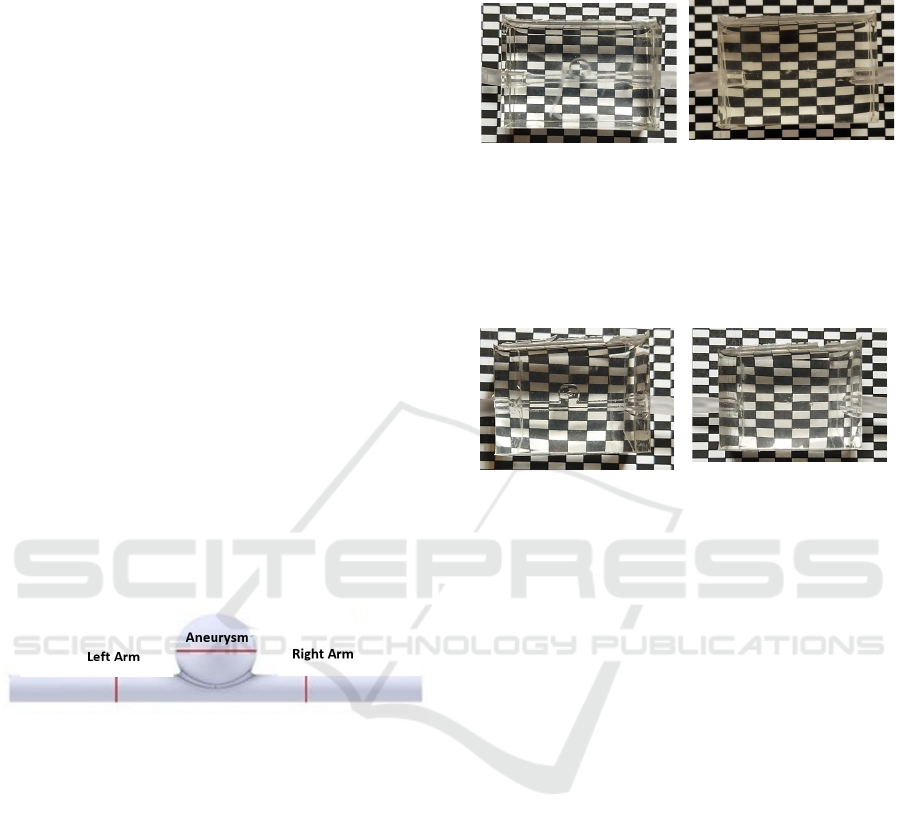
To evaluate the geometric structure,
measurements were taken at three specific locations.
These measurements were conducted around the
aneurysm and in each of its arms, as illustrated in
Figure 2.
Figure 2: Schematic representation of the locations of the
biomodel in which there were taken measurements to
evaluate the geometric structure.
3 RESULTS
3.1 Results for the Evaluation of the
Optical Transparency of the
Biomodel
For the experimental work, a sheet with a rectangular
structure was used in which each black or white
rectangles had 2.4 x 3.9 mm of dimensions and under
which the biomodel was placed. Thus, this structure
aimed to allow the evaluation of the issue of optical
distortion, caused by solid-liquid interaction.
Figure 3 presents the results for the biomodel
using a polysmooth mold. Image (a) shows the
biomodel when water was injected, while image (b)
depicts the situation in with a glycerin-based solution.
(a) (b)
Figure 3: Evaluation of the optical transparency of the
biomodel. In this evaluation, the inlet and outlet channels
have a 180° angle to each other, and a glycerin-based soap
mold was used. Panel (a) represents the case with water as
the fluid, while panel (b) shows the case with a glycerin-
based solution.
(a) (b)
Figure 4: Evaluation of the optical transparency of the
biomodel, in which the inlet and outlet channels have an
angle of 180° to each other, and where the mold used
consisted of polysmooth, for the situation in which the fluid
used was water (a) and for the case where the fluid was a
glycerin-based solution (b).
To begin with, Figure 4 displays the results
obtained for the biomodel using a glycerin-based soap
mold. Image (a) corresponds to the biomodel with
water injection, and image (b) depicts the situation
with a glycerin-based solution.
One can see that, when water is used as the
injected fluid (with a lower refractive index than
PDMS), the mold walls are visible. In contrast, when
a glycerin-based solution is used (with a matching
refractive index to PDMS), the mold walls become
invisible.
Additionally, it is worth noting that when water is
used, there is some slight distortion and curvature of
the rectangle structure, which is visible in all three
biomodels. This effect is more pronounced in the case
of the biomodel using a glycerin-based soap mold (as
shown in Figure 3).
3.2 Qualitative Analysis of Flow
Behaviour
The recorded images, using the Photron FASTCAM
visualization software, were subsequently processed
Experimental Flow Studies in PDMS Intracranial Aneurysms Manufactured by Two Different Techniques
155
using the ImageJ software. In particular, the particle
trajectories were obtained using the Z Project plugin,
and velocities using the MTrackJ plugin.
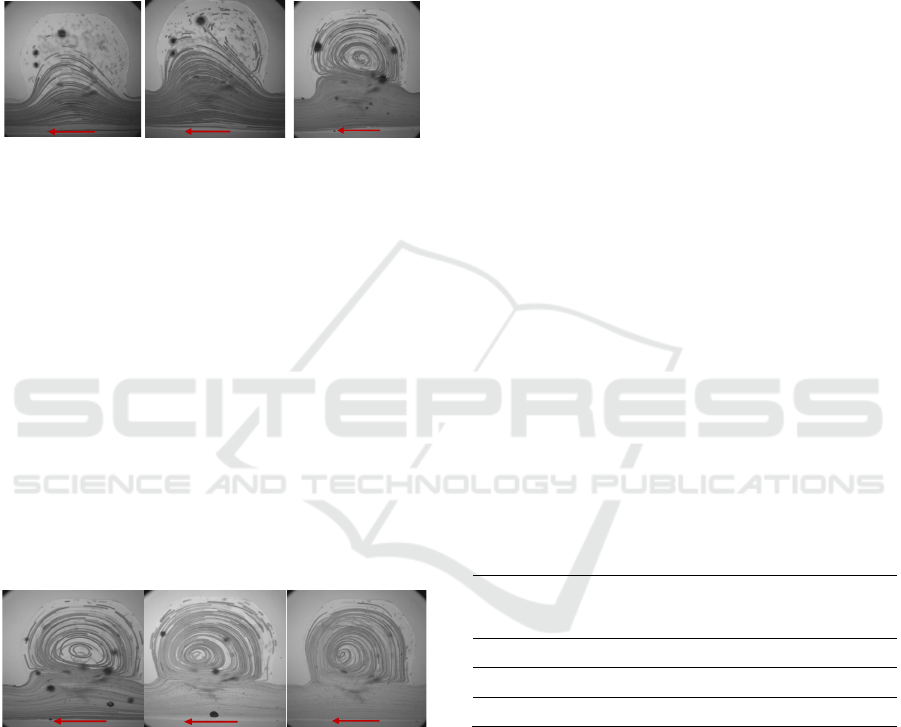
Firstly, the case of the biomodel in which the inlet
and outlet channels have an angle of 180° between
them. Thus, the trajectories of the PMMA particles,
for a flow rate of 5 mL/min, 6.8 mL/min and 10
mL/min, resulting from the image processing, are
shown in Figure 5.
(a) (b) (c)
Figure 5: Trajectories of the PMMA particles, for a flow
rate of 5 mL/min (Re=1.95), (a); 6.8 mL/min (Re=2.65), (b)
and 10 mL/min (Re=3.90), (c). The arrow inserted in each
image translates the direction of fluid circulation.
From observation of the previous figure, one can
see that for a flow rate of 5 mL/min, (a), the
phenomenon of fluid recirculation has not yet
occurred.
In turn, for a flow rate of 6.8 mL/min, (b), the
respective phenomenon is already beginning to be
observed, although it is still reduced and only occurs
in an area located inside the aneurysm. It should also
be noted that this recirculation zone occurs on the
fluid inlet side. On the other hand, for a flow rate of
10 mL/min, (c), it is visible that the recirculation
phenomenon is already perfectly developed and
covers almost the entire interior of the aneurysm.
(a) (b) (c)
Figure 6: PMMA particle trajectories, for a flow rate of 20
mL/min (Re=7.80), (a4); 50 mL/min (Re=19.49), (a5) and
100 mL/min (Re=38.99), (a6). The arrow introduced in
each image reflects the direction of fluid circulation.
After studying the trajectories of the PMMA
particles for the three flow rates discussed previously,
we now proceeded to study the flow rates of 20
mL/min, 50 mL/min and 100mL/min. Therefore, the
particle trajectories for the aforementioned flow rates,
and resulting from image processing, are shown in
Figure 6.
By analyzing the previous figure, it is possible to
observe that as the flow rate increases, the intensity
of recirculation also increases. Additionally, it is
noteworthy that the region of the aneurysm occupied
by the recirculation phenomenon expands with the
higher flow rates. For example, in the case of flow
rates of 50 mL/min (b) and 100 mL/min (c), virtually
all aneurysms exhibit recirculation. Furthermore, it is
evident that with the increase in flow rate, the
recirculation focus moves closer and closer to the
aneurysm wall.
3.3 Results of the Geometric
Assessment of Molds and
Biomodels
Firstly, the dimensions of the mold which originated
the final biomodel, in PDMS were evaluated. Two
measurements were taken at each location and,
subsequently, the average was calculated.
After obtaining the average values, these were
then compared with the dimensions of the original
STL model. This comparison was made by
calculating the relative percentage error between
both.
Therefore, in the following Table 2, there is a
comparison made between the measurements
obtained in ImageJ and the dimensions of the model
in the STL file, for the resin mold.
Table 2: Comparison between the measurements obtained
in ImageJ and the dimensions of the model in the STL file,
by calculating the relative percentage error, for the resin
mold.
Name Length-
ImageJ
(mm)
Length-
Inventor
(mm)
Relative
Error (%)
Aneurysm 4.934 5.00 1.33%
Left Arm 1.883 1.85 1.78%
Right Arm 1.809 1.85 2.22%
Analyzing the percentage errors obtained for the
resin mold, it is possible to verify the existence of
reduced errors in the order of 2%. The small value of
these errors ends up proving, in a certain way, the
good surface finish of the parts obtained by the
MSLA (Masked Stereo Lithography Apparatus)
additive manufacturing technique.
In a second phase, the dimensions of the final
biomodel in PDMS was evaluated.
This means that there were also taken two
dimensions at each location of the studied biomodel
and, subsequently, these values were averaged. After
BIODEVICES 2024 - 17th International Conference on Biomedical Electronics and Devices
156

obtaining the average values, it was then compared
with the dimensions of the original STL model. Once
again, this comparison was made by calculating the
relative percentage error between both.
Thus, Table 3 shows a comparison made between
the measurements obtained in the ImageJ software
and the dimensions of the model in the STL file, for
the biomodel in which the lost nucleus was made of
glycerin-based soap.
Table 3: Comparison between the measurements obtained
in the ImageJ software and the dimensions of the STL file
model, by calculating the percentage error, for the PDMS
biomodel (in which the missing nucleus was made of
glycerin-based soap).
Name Length-
ImageJ
(mm)
Length-
Inventor
(mm)
Relative
Error (%)
Aneurysm 5.204 5.00 4.07%
Left Arm 1.946 1.85 5.20%
Right Arm 1.885 1.85 1.86%
4 CONCLUSIONS
The main objective of this study was to investigate
the flow in an idealized semi-rigid biomodel
representing an intracranial aneurysm. The flow
visualization tests identified areas within the
aneurysm where fluid recirculation occurred.
Notably, the central region of the aneurysm, where
recirculation occurred, exhibited lower velocities
compared to the inlet and outlet speeds. With an
increase in the flow rate, the disparity between the
velocity inside the aneurysm and the inlet and outlet
velocities became more pronounced, indicating an
expanded recirculation area within the aneurysm.
Furthermore, an increase in the flow rate resulted in
the recirculation focus moving closer to the aneurysm
wall. It is highly recommended to conduct further
studies concerning the aim of this paper, namely there
should be performed numerical analysis for
validating the experimental results for the two studied
geometries. It is suggested to conduct numeric
simulations in steady state and transient regime to
infer if there are discrepancies between the velocity
values determined experimentally and numerically.
Apart from the validation of results, further numeric
simulations will produce a more profitable use of the
velocity and pressure profiles in terms of the
prediction of aneurism geometries that are at high risk
of rupture.
ACKNOWLEDGEMENTS
Authors acknowledge the projects
EXPL/EME-EME/0732/2021, 2022.06207.PTDC
(https://doi.org/10.54499/2022.06207.PTDC) and
2022.03151.PTDC (https://doi.org/10.54499/2022.
03151.PTDC) for the financial support, through
national funds (OE), within the scope of the Scientific
Research and Technological Development Projects
(IC&DT) program in all scientific domains (PTDC),
PORTUGAL 2020 Partnership Agreement, European
Regional Development Fund (FEDER), via the
Foundation for Science and Technology, I.P.
(FCT, I.P) and the R&D Units projects
(UIDB/00690/2020 and UIDP/00690/2020) (CIMO),
SusTEC (LA/P/0007/2020), UIDB/04077/2020,
UIDP/04077/2020, UIDB/04436/2020,
UIDB/00532/2020, LA/P/0045/2020 (ALiCE). and
LA/P/0083/2020 IN + - IST-ID. Andrews Souza
acknowledges FCT for the Ph.D. scholarship
2021.07961.BD and José Pereira acknowledges FCT
for the Ph.D. scholarship Ref. 2021.05830.BD.
REFERENCES
Campo-Deaño, L.; Dullens, R.; Aarts, D.; Pinho, F.;
Oliveira, M. (2013). Viscoelasticity of Blood and
Viscoelastic Blood Analogues for Use in
Polydymethylsiloxane in Vitro Models of the
Circulatory System. Biomicrofluidics, 7, 34102,
doi:10.1063/1.4804649.
Ferguson G. G. (1972). Physical factors in the initiation,
growth, and rupture of human intracranial saccular
aneurysms. Journal of neurosurgery, 37(6), 666–677.
https://doi.org/10.3171/jns.1972.37.6.0666.
Hopkins, L.M.; Kelly, J.T.; Wexler, A.S.; Prasad, A.K.
(2000). Particle Image Velocimetry Measurements in
Complex Geometries. Exp. Fluids, 29, 91–95,
doi:10.1007/s003480050430.
Inagawa T. (2010). Site of ruptured intracranial saccular
aneurysms in patients in Izumo City, Japan.
Cerebrovascular diseases (Basel, Switzerland), 30(1),
72–84. https://doi.org/10.1159/000314623.
Lasheras, J.C. (2006). The Biomechanics of Arterial
Aneurysms. Annu. Rev. Fluid Mech., 39, 293–319,
doi:10.1146/annurev.fluid.39.050905.110128.
Pinho, D.; Campo-Deaño, L.; Lima, R.; Pinho, F.T. (2017)
In Vitro Particulate Analogue Fluids for Experimental
Studies of Rheological and Hemorheological Behavior
of Glucose-Rich RBC Suspensions. Biomicrofluidics,
11, doi:10.1063/1.4998190.
Rodrigues, R.O.; Pinho, D.; Bento, D.; Lima, R.; Ribeiro,
J. (2016). Wall Expansion Assessment of an
Intracranial Aneurysm Model by a 3D Digital Image
Correlation System. Measurement, 88, 262–270,
Experimental Flow Studies in PDMS Intracranial Aneurysms Manufactured by Two Different Techniques
157

doi:https://doi.org/10.1016/j.measurement.2016.03.04
5.
Rodriguez-Régent, C.; Edjlali-Goujon, M.; Trystram, D.;
Boulouis, G.; Ben Hassen, W.; Godon-Hardy, S.; Nataf,
F.; Machet, A.; Legrand, L.; Ladoux, A.; et al. (2014)
Non-Invasive Diagnosis of Intracranial Aneurysms.
Diagn. Interv. Imaging, 95, 1163–1174,
doi:https://doi.org/10.1016/j.diii.2014.10.005.
Roloff, C.; Bordás, R.; Nickl, R.; Mátrai, Z.; Szaszák, N.;
Szilárd, S.; Thévenin, D. (2013). Investigation of the
Velocity Field in a Full-Scale Model of a Cerebral
Aneurysm. Int. J. Heat Fluid Flow, 43, 212–219,
doi:https://doi.org/10.1016/j.ijheatfluidflow.2013.06.0
06.
Miranda, I.; Souza, A.; Sousa, P.; Ribeiro, J.; Castanheira,
E.M.S.; Lima, R.; Minas, G. (2022). Properties and
Applications of PDMS for Biomedical Engineering: A
Review"Journal of Functional Biomaterials 13, 1: 2.
doi: https://doi.org/10.3390/jfb13010002
Souza, A.; Souza, M.S.; Pinho, D.; Agujetas, R.; Ferrera,
C.; Lima, R.; Puga, H.; Ribeiro, J. (2020) 3D
Manufacturing of Intracranial Aneurysm Biomodels for
Flow Visualizations: Low Cost Fabrication Processes.
Mech. Res. Commun., 107, 103535, doi:10.1016/
j.mechrescom.2020.103535.
Souza, A. V. A. (2020b). Hemodynamic study in a real
intracranial aneurysm: an in vitro and in silico
approach,” Dissertação de Mestrado, Instituto
Politécnico de Bragança, Bragança/Portugal.
Steiger, H.J.; Liepsch, D.W.; Poll, A.; Reulen, H.J. (1988).
Hemodynamic Stress in Terminal Saccular Aneurysms:
A Laser-Doppler Study. Heart Vessels, 4, 162–169,
doi:10.1007/BF02058429.
Ye, J., Zheng, P., Hassan, M., Jiang, S., & Zheng, J. (2017).
Relationship of the angle between the A1 and A2
segments of the anterior cerebral artery with formation
and rupture of anterior communicating artery
aneurysm. Journal of the neurological sciences, 375,
170–174. https://doi.org/10.1016/j.jns.2017.01.062
BIODEVICES 2024 - 17th International Conference on Biomedical Electronics and Devices
158
