
Integrated Simulation Approach for Dynamic Distributed Evacuation
Guidance Under Fire Spread and Rare but Catastrophic Events
Akira Tsurushima
a
Intelligent Systems Laboratory, SECOM CO., LTD., Japan
Keywords:
Distributed Problem Solving, Multi-Agent Simulation, Average Value at Risk, Crowd Evacuation,
Dynamic Evacuation Guidance.
Abstract:
The dynamics of smoke, fire, and toxic gases inside a building is complex and difficult to predict. Models
have been used to analyze and develop efficient evacuation protocols for fire-spread evacuation situations. In
this study, an integrated model that includes fire spread, evacuation agent, and evacuation guidance signage
models, is developed as an efficient control mechanism for a dynamically distributed evacuation guidance
system. This mechanism is based on Tsurushima’s distributed algorithm, which does not assume any central
control and only requires local information in providing efficient evacuation guidance, thereby minimizing
total evacuation time while directing evacuees away from hazards. The parameters of the mechanism were
calibrated to mitigate the occurrence of low-probability catastrophic events, which is crucial in the develop-
ment of evacuation guidance protocols.
1 INTRODUCTION
A cable car accident occurred on November 11, 2000,
in Kaprun, Austria, which resulted in 155 victims. In
this case, the heater placed at the lower end of the ca-
ble car broke, and the car stopped in the middle of the
tunnel because of brake system failure. Many people
tried to escape the fire and headed toward the top of
the tunnel. All these people died as the toxic gases
generated by the fire had moved upward because of
the chimney effect. However, a German ex-firefighter
knew about the chimney effect and advised some peo-
ple to escape downward. All 12 passengers who es-
caped downward, following his advice, survived the
fire (Fraser-Mitchell and Charters, 2005; Ferscha and
Zia, 2010; Fridolf, 2010).
In this accident, the decision to escape upward or
downward was a decisive factor that made the dif-
ference between life and death. However, choosing
the correct route is difficult because it depends on the
location and movement of the fire and toxic gases,
which can be very complex and difficult to predict.
Effectively guiding crowds to evacuate a building dur-
ing a fire while considering the spread of fire, smoke,
and gas, is critical but challenging.
Numerous studies have been conducted on dy-
a
https://orcid.org/0000-0003-2711-297X
namic evacuation guidance systems to navigate
crowds to efficiently evacuate buildings (Mirahadi
and McCabe, 2020; Zhao et al., 2022). These systems
typically consist of sensors and digital signage. The
sensors collect local safety information, such as tem-
perature and smoke or toxic gas, while the digital sig-
nage indicates the travel direction at specific locations
within the building. Most of these systems generate
efficient evacuation routes in the building using opti-
mization algorithms that can maximize or minimize
certain performance indices, such as minimizing total
evacuation distance or total evacuation time. How-
ever, from a fire evacuation perspective, minimizing
the travel distance or evacuation time is insufficient
because evacuees may be exposed to the smoke or
toxic gases generated by the fire while traveling to the
exit, which may endanger their life or health. Thus,
it is critical that evacuation guidance systems guide
evacuees away from danger and minimize total evac-
uation time (Mirahadi and McCabe, 2020).
The results of a fire can vary unexpectedly, de-
pending on the conditions under which the fire started,
such as the location of its origin, structure and mate-
rials of the building’s interior. Simulations are use-
ful tools for analyzing the variety of outcomes caused
by fires; however, a simulation analysis with a hand-
ful of scenarios is insufficient to cover the wide vari-
ety of possibilities, which can lead to unexpected and
Tsurushima, A.
Integrated Simulation Approach for Dynamic Distributed Evacuation Guidance Under Fire Spread and Rare but Catastrophic Events.
DOI: 10.5220/0012416100003636
Paper published under CC license (CC BY-NC-ND 4.0)
In Proceedings of the 16th International Conference on Agents and Artificial Intelligence (ICAART 2024) - Volume 1, pages 105-116
ISBN: 978-989-758-680-4; ISSN: 2184-433X
Proceedings Copyright © 2024 by SCITEPRESS – Science and Technology Publications, Lda.
105

catastrophic outcomes not considered in these scenar-
ios. Thus, a systematic method for analyzing rare but
catastrophic events (RBCE) is critical in designing ef-
fective disaster evacuation protocols.
In this study, we propose a dynamic evacua-
tion guidance method that efficiently guides evac-
uees to exits while considering exposure to smoke
or toxic gases that dynamically spread during evac-
uation. This method is based on Tsurushima’s dis-
tributed evacuation guidance algorithm that is re-
silient to disaster environments because it has no sin-
gle point of failure, such as a centralized server, and
requires only local information (Tsurushima, 2024).
The contributions of this study are as follows:
1. The simulations on fire spread, agent-based evac-
uation, and distributed dynamic evacuation guid-
ance are integrated into a single coherent plat-
form;
2. Tsurushima’s distributed algorithm is applied to
fire evacuation guidance;
3. A parametric calibration method is introduced
into the algorithm to avoid the occurrence of
RBCE.
To address the problem of minimizing evacuation
time while ensuring that evacuees avoid harmful ex-
posure, this study uses two objective functions and
assumes that all components function as intended.
2 RELATED WORK
The dynamics of fire and smoke spreading in a build-
ing are complex and difficult to predict. Compu-
tational fluid dynamics and large eddy simulation
models developed to reproduce these complex phe-
nomena are based on the computationally expensive
Navier-Stokes equations. These models, combined
with evacuation simulation models, can accurately re-
produce fire dynamics and smoke in a building, which
is useful for analyzing the safety of evacuees in case
of fire. Using this combination, Jasztal et al. evalu-
ated the Warsaw Modlin Airport to determine whether
evacuees could safely exit the building within the al-
lotted time (Jasztal et al., 2022). Liao et al. evaluated
the safety of the underground space of Guangzhou
International Financial City and suggested improve-
ments for safety (Liao et al., 2023). Coskun et al.
assessed the health of evacuees from the Sakarya
University building using fractional effective dose
(Cos¸kun et al., 2022). These studies used the PyroSim
software for fire-spread simulation and PathFinder for
evacuation simulation. Other researchers have used a
combination of fire spread and evacuation simulations
for more general purposes. Zheng et al. based their
simulations on the floor field model (FFM), to model
human evacuation behavior under fire (Zheng et al.,
2017). Lee et al. also used this combination to model
evacuation decisions based on fire spread (Lee et al.,
2018).
The aforementioned studies used fire spread and
evacuation simulations for analysis purposes. Mira-
hadi et al. used this combination to develop a decision
support system—EvacuSafe—that can provide safe
evacuation. EvacuSafe simulates several fire scenar-
ios to evaluate various evacuation strategies and se-
lects the best evacuation strategy when an emergency
is identified. This strategy is then sent to the active dy-
namic signage system, to provide efficient evacuation
guidance to evacuees (Mirahadi and McCabe, 2020).
In this study, fire-spread and evacuation agent
models were used to simulate crowd evacuation under
fire conditions. Our evacuation agents follow only the
evacuation signs and never intentionally flee from the
fire. Dynamic signs are incorporated into the model to
advise evacuees of specific evacuation directions. An
efficient control mechanism is investigated for evacu-
ation signs to safely guide evacuees to the exits, us-
ing an integrated simulation model that includes fire-
spread, evacuation agent, and evacuation signs mod-
els.
3 PROBLEM
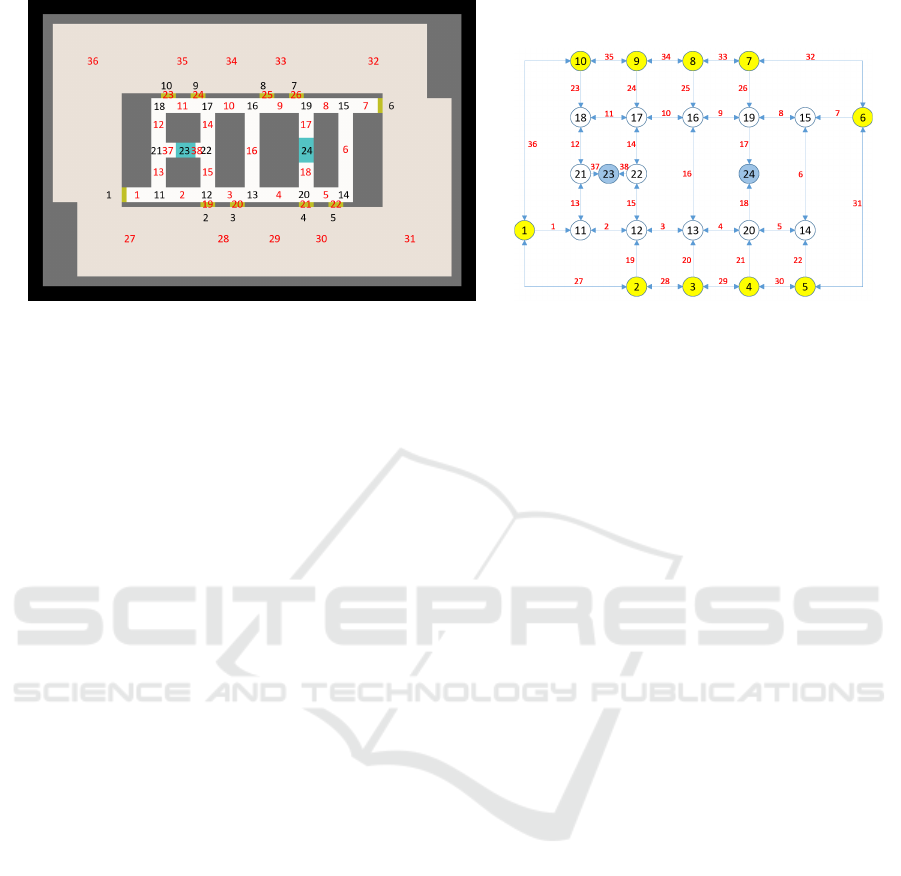
Fig. 1 (A) illustrates the evacuation environment
(Tsurushima, 2024) filled with cells (x,y) ∈ C iden-
tified by the coordinates (x, y) ∈ Z
1
× Z
2
where Z
1
=
−40,... ,40, Z
2
= −25, .. ., 25 represent the positions
in the environment used in this study. The environ-
ment is divided into two parts: the central core (dark
gray square region) and the surrounding space (light
brown region) outside the central core, which is typi-
cal of high-rise buildings. The central core consists
of two exits 23 and 24 (blue), aisles (white), and
corners (white with numbers). Doors connecting the
surrounding space and aisles in the central core are
shown in yellow in the figure, indicating evacuees in
the surrounding space to move to the aisles and ex-
its. Evacuation signs that direct evacuees at each lo-
cation are assigned to the doors (1,.. ., 10), corners
(11,. .. ,22), and exits (23 and 24). The aisles and sur-
rounding space are divided into 38 areas C =
S
38
i=1
C
i
and represented by the red numbers: 1 to 18 and 27
to 36, respectively. The former represents the space
between two corners. Note that 19 to 26 represent
small areas occupied by doors, and 37 and 38 repre-
sent small areas between the two corners (21 and 22)
ICAART 2024 - 16th International Conference on Agents and Artificial Intelligence
106
(A) (B)
Figure 1: (A) Example floor plan. (B) Graphical representation of the floor plan.
and exit 23. Although not clearly illustrated, these ar-
eas have sensors to identify the level of danger from
heat, smoke, or toxic gases produced by the fire. The
red numbers represent the values of the sensors asso-
ciated with these areas.
Fig. 1 (B) presents universal evacuation graph
G = (V,E,W ) of Fig. 1 (A) (Tsurushima, 2024). The
nodes (v
i
∈ V ) of the universal evacuation graph rep-
resents doors (v
1
,. .. ,v
10
), corners (v
11
,. .. ,v
22
), two
exits (V
g
= {v
23
,v
24
}), and edges ({v
i
,v
j
} = e
k
∈ E)
represents the areas C
k
between the two adjacent
nodes. I
C
: {1,...,|V |}
2
→ {1,...,38} maps the in-
dices {i, j} to the index k, e.g., I
C
(1,2) = 27. Di-
rected edges also represent the possible directions that
an evacuee at the node can take in the next trip. An-
other interpretation of the universal evacuation graph
is that a node represents the evacuation sign at the lo-
cation, and an edge represents the value of the sen-
sor corresponding to the area, as indicated by the red
number. The direction of an edge, in this interpreta-
tion, is that of the adjacent nodes that the evacuation
sign advises to evacuees at the location as the next di-
rection. For example, at door 1, an evacuee has three
choices: move to door 2, door 10, or corner 11; thus,
the evacuation sign on door 1 displays either 2, 10,
or 11. In universal evacuation graph, an edge weight
(w
(i, j)
∈ W ) represents the hazard level that the corre-
sponding sensor reports as its value w
(i, j)
∈ R+.
Initially, 800 agents A = {a
1
,. .. ,a
800
} are ran-
domly assigned to the cells in the surrounding space,
with one cell accommodating at most one agent. One
of the cells in the surrounding space is also randomly
selected as the fire starting point. The fire propagates
to adjacent cells with some probability and spreads to
the other cells as the simulation progresses. Agents
representing the evacuees begin to evacuate the sur-
rounding spaces through the doors, aisles, and cor-
ners of the exits according to the directions displayed
on the evacuation signs.
Fig. 2 (A) illustrates an instance from a sample
simulation. The small green arrowheads on the doors
and corners illustrate the evacuation signs, and the
direction of an arrowhead depicts the guiding direc-
tion displayed on each sign. The two green circles
illustrate the evacuation signs on the exits, indicating
the positions of the exits. Black (or dark gray) re-
gions in the lower part of the surrounding space rep-
resent the area occupied by the fire, and the white
regions around the fire represent the area of pene-
trating smoke. Fig. 2 (B) illustrates the evacuation
graph
˙
G = (V,
˙
E,
˙
W ) (Tsurushima, 2024), which rep-
resents the evacuation routes suggested by the evac-
uation signs, corresponding to (A). The evacuation
graph consists of two trees with the roots denoting
exits. The blue arrows in (B) depict the route from
the doors to the exits. The evacuation graph in (B)
has no loops, which also indicates that an efficient
evacuation graph
¨
G = (V,
¨
E,
¨
W ) (Tsurushima, 2024).
δ : V → V, i ∈ V, (i,δ(i)) ∈
˙
E denotes the direction
(node) displayed on evacuation sign i, and ∆ : V →
2
V
, j ∈ ∆(i), (i, j) ∈ E denotes the possible directions
that evacuation sign i can display; ∆(i) denotes the set
of nodes adjacent to i.
The problem lies in finding an efficient control
mechanism for evacuation following the suggestions
in the signs for the best direction for evacuees to es-
cape at each location. The control mechanisms were
evaluated based on total evacuation time and total
amount of hazard to which the evacuees were exposed
during the evacuation.
Integrated Simulation Approach for Dynamic Distributed Evacuation Guidance Under Fire Spread and Rare but Catastrophic Events
107
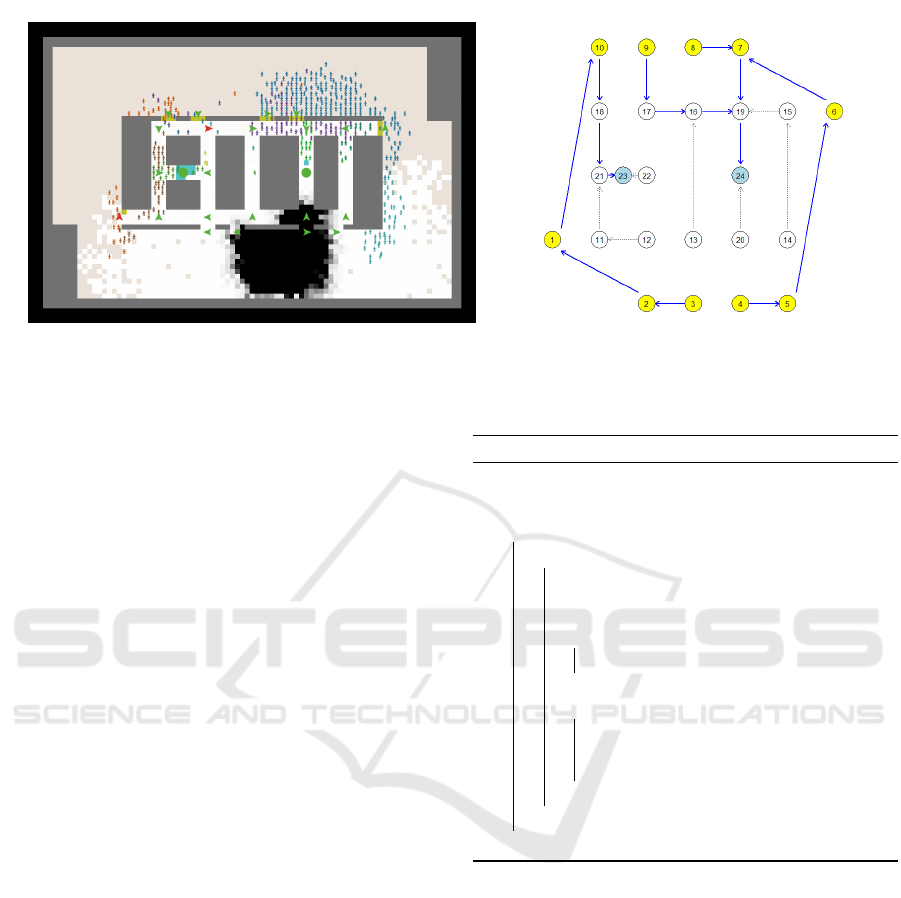
(A) (B)
Figure 2: (A) Sample simulation. (B) The evacuation graph corresponding to (A).
4 TSURUSHIMA’S ALGORITHM
Consider the universal evacuation graph given in Fig.
1(B). Each node in the graph represents a evacuation
sign, which is also a distributed computational pro-
cess in which the system can communicate with its
neighboring nodes. Incorporating Tsurushima’s dis-
tributed algorithm allows the generation of the opti-
mal evacuation direction at the corresponding loca-
tion. In Tsurushima’s algorithm, each node can inde-
pendently calculate the optimal direction at that node
and automatically coordinate all evacuation routes to
form efficient evacuation graph
¨
G = (V,
¨
E,
¨
W ), elim-
inating harmful loops that result in evacuee conges-
tion (Theorem 4 in (Tsurushima, 2024)). The al-
gorithm comprises two procedures: Broadcast dis-
tributes the newest local information throughout the
graph to form a local image of the global graph
b
G =
(V,
b
˙
E,
b
˙
W ) at each node, and UpdateSign computes the
optimal direction at that node based on
b
G.
Tsurushima’s algorithm is a distributed optimiza-
tion algorithm that minimizes the total path weight
(TPW) on an universal evacuation graph. Any ef-
ficient evacuation graph can be represented as a set
of trees. For example,
¨
G = {T
1
,. .. ,T
|v
g
|
}, where
T represents a tree with an element in V
g
as the
root (Lemma 1 in (Tsurushima, 2024)). TPW of
¨
G
is defined as T PW (
¨
G) =
∑
j
T PW (T
j
) and TPW of
T is defined as T PW (T ) =
∑
i∈V \{g}
weight(T (i, g)),
where g ∈ V
g
, and weight(T (i, j)) is the total path
weight from i to j for T . Applying Tsurushima’s al-
gorithm repeatedly and independently at each node,
the system automatically generates a series of effi-
cient evacuation graphs that finally converge to an ef-
ficient evacuation graph with minimum TPW, which
Algorithm 1: Broadcast (Tsurushima, 2024).
Local variable:
b
˙
E,
b
W ,
b
T
1 Function
Broadcast(o, i, δ(o), t, Ω
W
, ϒ
W
):
2 if
b
T [o] < t then
3
b
T [o] ← t;
4
b
˙
E[o] ← δ(o);
5 foreach j ∈ 1, .. ., |Ω
W
| do
6
b
W [Ω
W
[ j]] ← ϒ
W
[ j]
7 end
8 foreach a ∈ ∆(i) do
9 call
Broadcast(o,a, δ(o),t,Ω
W
,ϒ
W
)
on node a
10 end
11 end
12 end
is called the minimum efficient evacuation graph G
∗
,
unless E and W remain unchanged (Theorem 5 in
(Tsurushima, 2024)).
As shown in Algorithm 1, Broadcast updates the
local infomation
b
˙
E and
b
W as new information arrives
from other nodes and distributes this information to
adjacent nodes. UpdateSign searches for the mini-
mum weight path to evacuation exits using breadth-
first search, to determine the evacuation direction, as
shown in Algorithm 2. If the new direction forms
a cycle, the process is delegated to the next node to
break the cycle. For details, see (Tsurushima, 2024).
ICAART 2024 - 16th International Conference on Agents and Artificial Intelligence
108

Algorithm 2: UpdateSign (Tsurushima, 2024).
Local variable:
b
˙
E,
b
W ,δ(i)
1 Function UpdateSign(i):
2 l
∗
ig
← Search(i,
b
W );
3 (i, next) ← l
∗
ig
[1];
4
b
˙
E[i] ← (i,next);
5 if
b
˙
E include a cycle then
6 call UpdateSign(next) on next;
7 await
b
˙
E ← UpdateSign(next) from
next
8 end
9 δ(i) ←
b
˙
E[i];
10 return
b
˙
E
11 end
5 MODEL
To investigate efficient control mechanisms for evac-
uation signs, we developed three models: the fire
spread, evacuation agent, and evacuation sign mod-
els. We combined these three models to form a sin-
gle coherent simulation model to represent our prob-
lem. The simulation runs for a simulation time within
the range of t = 1, .. ., T
max
, the time at which the last
agent evacuated from the environment.
5.1 Fire Spread Model
Many advanced fire spread models have been de-
veloped considering geometric shapes of the build-
ing, materials, density, thermal conditions of indoor
objects, ventilation conditions, and the locations of
fire extinguishers as inputs, to study the dynamics of
fire spreading. Most models calculate the complex
dynamics of fires using computational fluid dynam-
ics and large-eddy simulations based on the Navier-
Stokes equations. These models can produce accurate
results at high computational costs that are sometimes
unaffordable in machine learning or black-box simu-
lations. In this study, we developed a simple pseudo-
fire-spread model to avoid high computational cost.
The model produces a somewhat imprecise but rea-
sonably well-simulated fire-spread dynamics in build-
ings with low computational cost. The model simply
propagates the value h
t
(x,y)
∈ R for a cell (x,y), which
represents the fire hazard level of that cell at time t
to neighboring cells ζ(x,y). With probability p
1
, the
value h
t
(x,y)
is updated as follows:
h
t
(x,y)
= (1 − p
2
) h
t−1
(x,y)
+ p
2
max{h
t
(v,w)∈ζ(x,y)
},
where ζ(x, y) maps (x, y) to a set of adjacent cells. In
Fig. 2 (A), cells with h
(x,y)
≥ 100 are illustrated in
black, with 100 > h
(x,y)
> 0 shown in gray to white,
depending on the values.
A fire origin (x,y) was randomly selected from the
cells in the surrounding space at the beginning of the
simulation (t = 1), and h
0
(x,y)
was set to 100000, p
1
=
0.07, and p
2
= 0.2.
5.2 Evacuation Agent Model
To evaluate the effects of the evacuation signs, a sim-
ple agent model was employed to represent an evac-
uee. Unlike humans, an agent is not intelligent and
makes only random decisions and cannot avoid haz-
ardous situations by itself. Following a evacuation
sign within its field of view, is the only thing that
an agent can do besides a random choice. We as-
sumed a narrow field of view for our agents so that
they would fit the narrow aisles inside the central core,
such as 20
◦
within a distance of 10 cells, according to
the tunnel vision hypothesis (Tsurushima, 2021; Tsu-
rushima, 2022c). The size and shape of an agent’s
field of view is only considered when the agent sees
an evacuation sign. The field of view can be disre-
garded to narrow down the number of alternatives in
random selection.
An agent has a short-term goal, which is a door
if the agent is in the surrounding space or a corner or
exit if it is in the central core. The agent is always fac-
ing and trying to approach this short-term goal. The
short-term goal is updated to a new goal under the
following three scenarios: when the short-term goal
is reached, an evacuation sign is in its field of view, or
the agent is physically pushed into a position where
the short-term goal is invisible to the agent. The short-
term goal is updated to δ(i) if evacuation sign i is in
its field of view, or otherwise randomly selected from
adjacent corners or visible doors. When the simula-
tion starts, the short-term goal is randomly set to a
door that is physically visible from the agent’s posi-
tion without any obstacles.
After the short-term goal is set, the agent moves
by one cell toward the short-term goal at each simu-
lation step unless no other agent occupies the cell. If
the cell is occupied, the agent randomly selects an ad-
jacent unoccupied cell and moves to that cell, which
is equivalent to the agent being physically pushed by
the crowd. If there are no adjacent unoccupied cells,
the agent remains in its original position.
Hazard contamination is assumed if an agent is
exposed to cells with h > 0. Contamination of each
agent accumulates over the simulation time, whereby
the accumulated contamination of agent a is calcu-
Integrated Simulation Approach for Dynamic Distributed Evacuation Guidance Under Fire Spread and Rare but Catastrophic Events
109

lated as: θ
a
=
∑
T
max
t=0
min{100, h
t
}, representing the
total hazard to which the agent is exposed during the
evacuation;
¯
θ =
1
|A|
∑
a∈A
θ
a
denotes the mean con-
tamination of all the agents.
5.3 Evacuation Sign Model
The role of the evacuation signs in the simulation is to
guide the evacuees to achieve an efficient evacuation,
which has two objectives: minimizing the total evacu-
ation time (min T
max
) and mean hazard contamination
(min
¯
θ).
After starting the simulation, an evacuation sign
incorporating Tsurushima’s algorithm starts to exe-
cute Broadcast and UpdateSign repeatedly at differ-
ent times to achieve the two objectives, resulting in
a series of efficient evacuation graphs that lead the
agents to the exits. Theorem 5 in (Tsurushima, 2024)
ensures that the minimum efficient evacuation graph
is achieved if W is static; however, in real evacua-
tion situations, this is unlikely to occur because of the
rapid changes in W . Tsurushima used simulations to
demonstrate that the algorithm can effectively guide
evacuees to exits by dynamically changing W .
Each evacuation sign i knows universal evacua-
tion graph G = (V,E,
b
W (t)) and its neighboring nodes
∆(i), with the current weights of universal evacuation
graph
b
W (t) representing the local image of W that is
delivered and updated by Broadcast . Among other
local variables,
b
˙
E denotes the local image of the evac-
uation graph;
b
T denotes the array containing the re-
ceiving time of the last Broadcast at all the nodes; and
δ(i) is the current guiding direction of i. Suppose that
the evacuation sign 1 in Fig. 2 (A) is where the spread
of Broadcast originates at time 160, executing
Broadcast(1, 1, 10, 160, [2, 10, 11],
[0.2, 0.01, 0.19]),
where 0.2, 0.01, and 0.19 are the edge weights be-
tween node 1 and nodes 2, 10, and 11, respectively;
UpdateSign may be executed at different times,
UpdateSign(1).
Tsurushima’s algorithm was used to minimize the
total evacuation time by reducing the congestion be-
tween each node and the exits (Tsurushima, 2024).
However, guiding evacuees to avoid hazards is diffi-
cult for the algorithm, that is, min
¯
θ, because the haz-
ard to be avoided is usually not located between an
evacuation sign and an exit, but the evacuation sign is
located between the hazard to be avoided and the exit;
this is difficult to handle. The algorithm, particularly
at the beginning of the simulation, provides the short-
est path from each node to the exit because Search
in line 2 of UpdateSign searches for the shortest route
using a breadth-first search, as almost all the elements
in
b
W (t) are zero. The weights of the edges included
in the routes are zero, and the high-weight value on
the hazardous edge is disregarded and excluded from
the evacuation routes, which is not sufficient for evac-
uees to avoid hazards, as they need to move away from
the hazard. The high weights on the hazardous edges
do not affect the results. In the following section, we
propose a method to address this problem, which is
particularly relevant to fire scenarios.
6 METHOD
In this section, we present a method that adapts Tsu-
rushima’s algorithm for fire spread evacuations. This
method depends on the way the node weights W
are computed without modifying the original algo-
rithm. The easiest method of adapting Tsurushima’s
algorithm to our problem would be to use the mean
hazard level of area i as the weight, e.g., w
i
(t) =
1
|C
i
|
∑
(x,y)∈C
i
h
t
(x,y)
. However, this approach does not
suit our purpose because the evacuation signs can-
not lead evacuees away from the fire. Many evacuees
move into the fire to follow the least-cost path during
evacuation.
Fig. 3 illustrates the results of the three simula-
tions, each with 1000 runs for different Ws. The
x-axis represents T
max
, and the y-axis represents
¯
θ.
Fig. 3 (A) presents the results for w
A
i
(t) ∈ W
A
(t) such
that w
A
i
(t) =
1
|C
i
|
2
∑
(x,y)∈C
i
h
t
(x,y)
. We divide the mean
of h
t
(x,y)
by |C
i
| because a large area is preferable to
a small area in providing a safe evacuation space for
evacuees. The figure shows a wide range of outcomes
for both T
max
and
¯
θ. In particular, the values of
¯
θ,
the mean total contamination of the hazard, vary from
0 to 655.5, which can be a serious problem in real-
world situations. The large variance in
¯
θ stems from
the fire start location. If the location is close to the
outer edges of the surrounding space, then evacuees
can evacuate safely and quickly; however, if it is near
the doors or the outer edges of the central core, many
evacuees are trapped in the fire early in the simulation.
Fig. 3(B) shows the results of 1000 simula-
tions with w
B
i
(t) ∈ W
B
(t) such that w
B
i
(t) = w
A
i
(t) +
γ max{ζ(w
i
)}/|C
i
|, where ζ : W
B
(t) → 2
W
B
(t−1)
which maps the weight of the edge i to the previous
weights of the neighboring edges of i, and γ is a scal-
ing factor. For example, in Fig. 1(B), if i = 1, ζ(w
1
)
denotes a set of weights for the edges 2,13, 27, and
36 at time t − 1. The first term represents the cur-
rent value obtained from the sensor, whereas the latter
ICAART 2024 - 16th International Conference on Agents and Artificial Intelligence
110
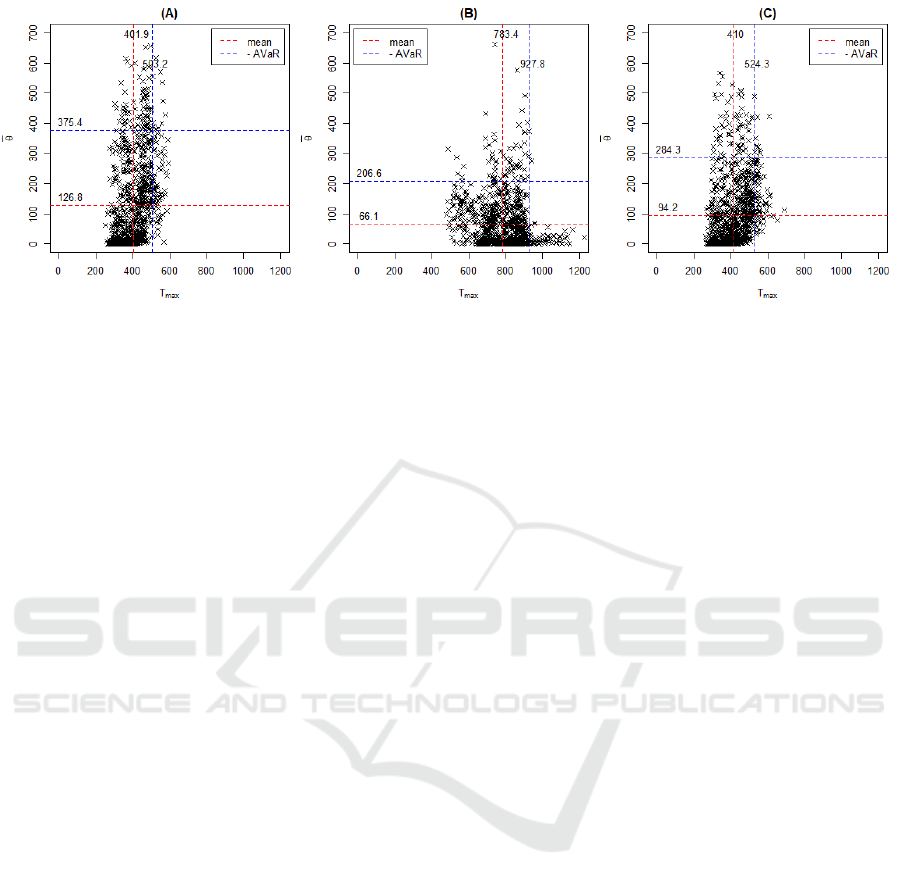
Figure 3: 1000 simulation results with W
A
, W
B
, and W
C
, in (A), (B), and (C), respectively.
denotes the value held in memory inside the evacua-
tion sign. The latter term propagates the weight of an
edge to its neighboring edges with some delay, indi-
cating that the neighboring areas of high-hazard areas
also have certain risks that should be avoided during
evacuations. This term prevents evacuees from being
exposed to high-risk cells in the early phases of the
simulation.
The vertical and horizontal red dashed lines rep-
resent the mean values of T
max
and
¯
θ, respectively.
Fig. 3 (B) shows that the large variance of
¯
θ in (A) is
suppressed by substituting the large variance of T
max
because of the heavy congestion of evacuees caused
by the guidance; the mean value of
¯
θ in (A) decreases
from 126.8 to 66.1 in (B) with the increase in T
max
from 401.9 to 783.4, which leads to another problem,
a long evacuation time.
W
A
(t) and W
B
(t) can be considered two extremes
of W(t); the former is suitable for T
max
but not for
¯
θ,
whereas the latter is suitable for
¯
θ but not for T
max
.
In practice, a compromise between the two extremes
is sometimes preferable, to obtain a moderate solu-
tion. Fig. 3 (C) shows the results of 1000 simulations
with w
C
i
(t) ∈ W
C
(t) compromising the two extreme
weights W
A
(t) and W
B
(t) such that
w
C
i
(t) = λ(t) l
ξ
(w
B
i
(t)) + (1 − λ(t))W
A
i
(t),
where
l
ξ
(x) =
x if x ≥ ξ
0 otherwise,
and
λ(t) = β λ(t − 1).
l
ξ
is a function that truncates a variable less than ξ to
zero, and λ is a dynamic scaling factor that coordi-
nates W
A
and W
B
, which are varied over the course of
the simulation.
Fig. 3(C) shows that the variances in both T
max
and
¯
θ are suppressed against W
B
and W
A
, respec-
tively. The means of T
max
and
¯
θ are 94.2 and 410.0,
which are smaller than the 126.8 of W
A
and 783.4
of W
B
, indicating that a reasonable compromise has
been reached.
In this section, we use the notation W (t) for sim-
plicity although it is a local image
[
W (t) within a evac-
uation sign and introduce two additional local vari-
ables λ(t) and
\
W (t − 1) to implement W
C
for each
evacuation sign.
The parameters used in Fig. 3 (C) are as follows:
λ(0) = 0.9, β = 0.6, ξ = 0.5, and γ = 0.8.
6.1 Case Study
A simulation example using the aforementioned pa-
rameters is presented in Fig. 4. The simulation
screens for Steps 90, 150, 200, and 260 are presented
in (1), (2), (3), and (4), respectively. The correspond-
ing evacuation graph representing the displayed direc-
tion of each evacuation sign is shown on the right side
of each screen. The fire originated at (36, -25), which
is close to the lower right corner in Step 1.
In Step 90, the fire area (black region in the lower
right of Fig. 4 (1)) expands, and the agents are evac-
uated according to the evacuation signs; evacuation
graph (1) illustrates that both exits 23 and 24 are used
for swift evacuation; doors 1, 2, 9, and 19 are used to
access exit 23; doors 4 and 7 are used to access exit
24.
In step 150, the smoke penetrates the right half of
the lower area (the white area in Fig. 4 (2)), prevent-
ing the use of door 4. The evacuation graph in Fig. 4
(2) shows that door 4 is no longer used to access exit
24, and the evacuation sign at door 4 indicates that
evacuees are required to move to the left. Access to
exit 24 is still available through door 7.
In step 200, the fire and smoke spread into the
wider area, interfering with the use of door 7, and exit
24 is no longer used for evacuation. The evacuation
sign at door 2 points to the left to direct evacuees to
Integrated Simulation Approach for Dynamic Distributed Evacuation Guidance Under Fire Spread and Rare but Catastrophic Events
111
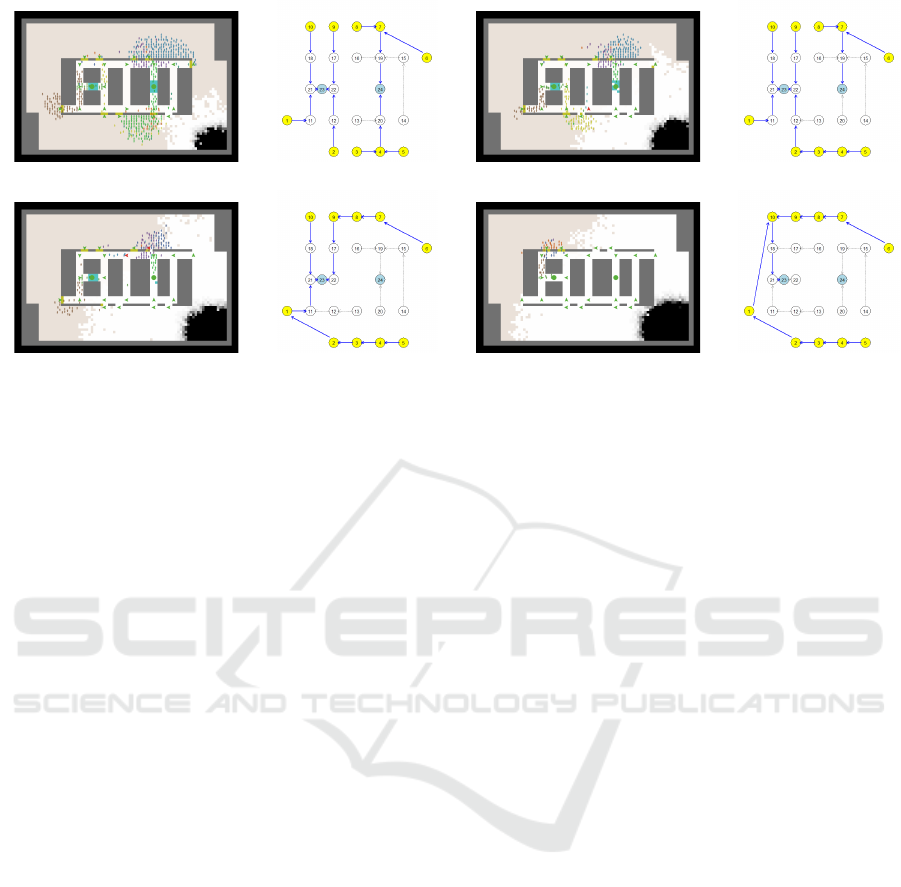
(1) 90 steps (2) 150 steps
(3) 200 steps (4) 260 steps
Figure 4: Simulation screens with 90, 150, 200, and 260 simulation steps. Corresponding evacuation graphs are shown to the
right of each screen.
door 1. Access to exit 23 is still available through
doors 1, 9, and 10.
In step 260, most of the surrounding space is filled
with smoke. Access to Exit 23, currently the only exit
used for evacuation is available only through door 10,
which is located on the side opposite to where the fire
originated.
This example illustrates that many doors are used
for swift evacuation during the early stages of the sim-
ulation. Subsequently, based on the dynamics of fire
and smoke evacuation graph rapidly changes its topol-
ogy, suppressing congestions at certain doors. The
few evacuees remaining in the final stage are guided
to the safest door opposite to where the fire originated.
T
max
and
¯
θ in this example are 337 and 0.5, respec-
tively.
7 RARE BUT CATASTROPHIC
EVENTS
In Section 6, we discussed the variance of the results
of the fire spread evacuation simulations. This vari-
ance will lead to serious consequences in real-world
situations. For example, in Fig. 3(A), the worst value
of
¯
θ indicates the mean hazardous contamination level
of 800 evacuees as 655.5. The fire origin in this case is
(6,−16), located between doors 3 and 4 and close to
the central core, as shown in Fig. 1(A),which can sig-
nificantly expose evacuees to hazard. If we consider
the set of contamination levels for evacuees exposed
to hazardous cells to be Θ
+
= {θ
a
|θ
a
≥ 1.0}, we
have |Θ
+
| = 227, mean Θ
+
= 2310.1, and max Θ
+
=
7859.1; 277 of the 800 evacuees are severely damaged
by the fire, which would be unacceptable in many
cases. Although such cases are rare, a method for
dealing with such RBCE is required. The W
C
in the
previous section can be used to coordinate the two ex-
tremes W
A
and W
B
and suppress the variances of the
two objectives T
max
and
¯
θ; however, the results still
vary depending on four parameters: λ(0), β, ξ, and
γ. For example, Fig. 5(D) shows the results of the
simulation for λ(0) = 1.0, β = 0.9, ξ = 0.00001, and
γ = 0.8, and (E) presents the results for λ(0) = 0.1,
β = 0.01, ξ = 0.1, and γ = 0.2; the former has a large
variance in
¯
θ and the latter in T
max
, which are consid-
ered as two extreme cases of different parameters for
W
C
. These parameters depend on the size and shape
of the target evacuation environment, and choosing
good parameters is difficult. Thus, techniques are re-
quired for the systematic calibration of these parame-
ters.
Tsurushima introduced a method that coordinates
two objective functions, while reducing the risks—
unfavourable extreme outcomes—in these objectives
(Tsurushima, 2022a; Tsurushima, 2022b). This
method is based on a mean risk model which uses
the average value at risk (AVaR), as the risk measure,
and has been applied to solve the visual evacuation
signage assignment problem by generating a set of
Pareto optimal solutions that coordinate the two ob-
jective functions and suppress the risk measures. In
this section, we discuss Tsurushima’s method for cal-
ibrating the four parameters of W
C
, leading to an effi-
cient control mechanisum for evacuation signs to fa-
cilitate safe evacuation guidance.
ICAART 2024 - 16th International Conference on Agents and Artificial Intelligence
112
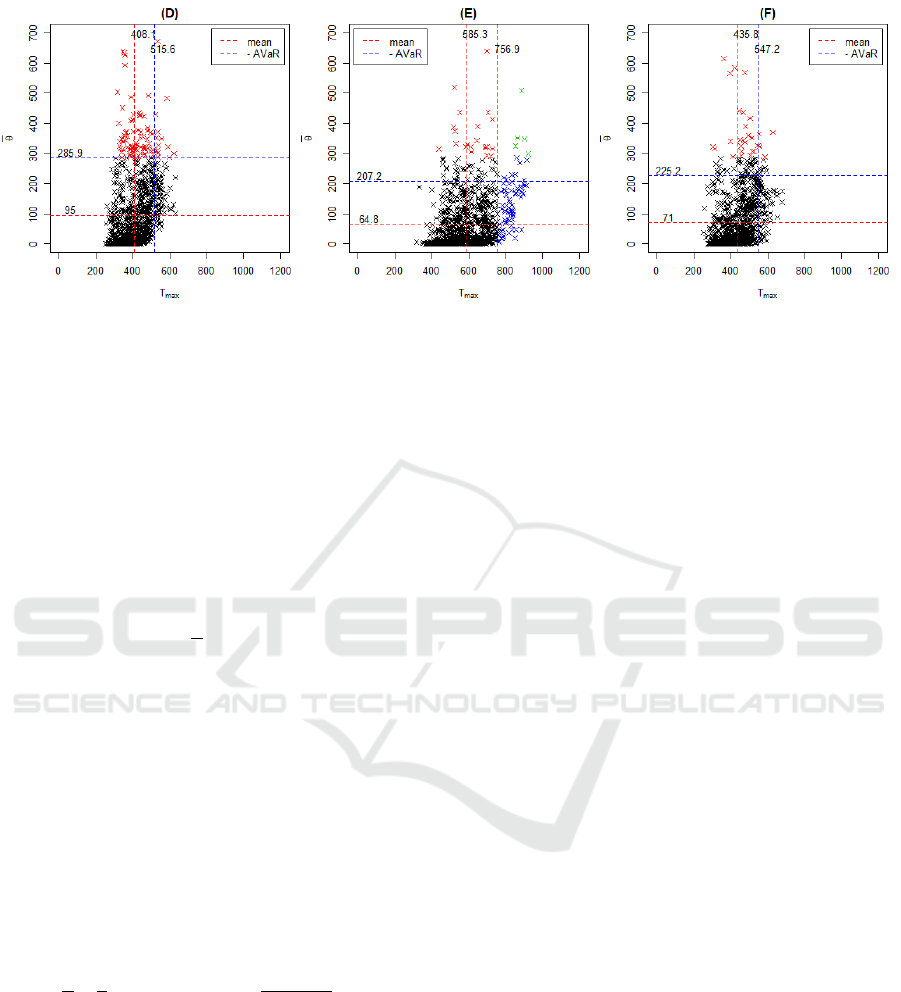
Figure 5: Results with different W
C
s. (D) and (E) are the results with arbitrarily chosen parameters, and (F) displays the
results obtained by Tsurushima’s method.
7.1 Average Value at Risk
The AVaR, which is a coherent and widely used
risk measure in economics and finance, is consis-
tent with the maximum expected utility principle
and second-order stochastic dominance (Gutjahr and
Pichler, 2016). The AVaR of a random variable X at
level α (0 < α ≤ 1) is defined based on value at risk
(VaR), which is the α quantile of the random variable
X:
AVaR
α
(X) =
1
α
Z
α
0
VaR
p
(X)d p (1)
= E[X|X ≤ VaR
α
(X)], (2)
where
VaR
α
(X) = F
−1
X
(α). (3)
Intuitively, AVaR
α
(X) can be considered the expected
value of the realizations of the random variable X that
are worse than the α-quantile of X.
Suppose we have n sorted samples denoted by
r
(1)
≤ r
(2)
≤,. .. ,≤ r
(n)
. The AVaR of the above sam-
ples at level α can be calculated as,
AVaR
α
(r) = (4)
1
α
1
n
⌈nα⌉−1
∑
k=1
r
(k)
+
α −
⌈nα⌉ − 1
n
r
(⌈nα⌉)
!
,
where ⌈x⌉ denotes the smallest integer larger than x
(Rachec et al., 2008).
In finance, AVaR is typically defined as above be-
cause a higher return is always better than a lower re-
turn. However, in our problem, a smaller outcome
is preferable to a larger outcome because we want to
minimize the objective functions T
max
and
¯
θ. There-
fore, in this study, we maximized the AVaR of the
negative variable, that is, max AVaR(−x), and use the
negative AVaR, −AVaR(−x), to indicate negative val-
ues as positive. In Figs. 3 and 5, the vertical and hori-
zontal blue dashed lines indicate the −AVaR values of
T
max
and
¯
θ, respectively.
7.2 Multi-Objective Model
To determine the optimal parameters of the algorithm
for the environment given in Fig. 1 (A), a black-box
optimiaztion with the model presented in Section 5
is performed. The parameters are evaluated based on
the results obtained from n simulations conducted to
solve the following multi-objective problem:
min f
1
= mean{T
1
max
,. .. ,T
n
max
} (5)
min f
2
= mean{
¯
θ
1
,. .. ,
¯
θ
n
} (6)
max f
3
= AVaR
0.2
{−T
1
max
,. .. ,−T
n
max
} (7)
max f
4
= AVaR
0.2
{−
¯
θ
1
,. .. ,−
¯
θ
n
} (8)
s.t. 0 < λ(0) ≤ 1, 0 < β ≤ 1,
0 < ξ ≤ 1, 0 < γ ≤ 1.
(9)
The first two objectives minimize the means of
T
max
and
¯
θ, whereas the last two objectives suppress
the occurrence of RBCE by maximizing the AVaR of
−T
max
and −
¯
θ to a level of 0.2. This problem is dif-
ficult to solve as it involves complex tradeoffs among
the four objective functions. The NSGA-II algorithm
(Deb et al., 2002), a widely used multi-objective evo-
lutionary algorithm, was used to obtain a set of Pareto
optimal solutions (Gutjahr and Pichler, 2016) for the
multi-objective problem in Tsurushima’s method.
To address this problem, a significant number of
simulations are performed, which is computationally
expensive. Thus, a two-phase approach was intro-
duced to reduce the computational costs (Tsurushima,
2022a; Tsurushima, 2022b). In the first phase, the
problem is solved using NSGA-II with a relatively
Integrated Simulation Approach for Dynamic Distributed Evacuation Guidance Under Fire Spread and Rare but Catastrophic Events
113
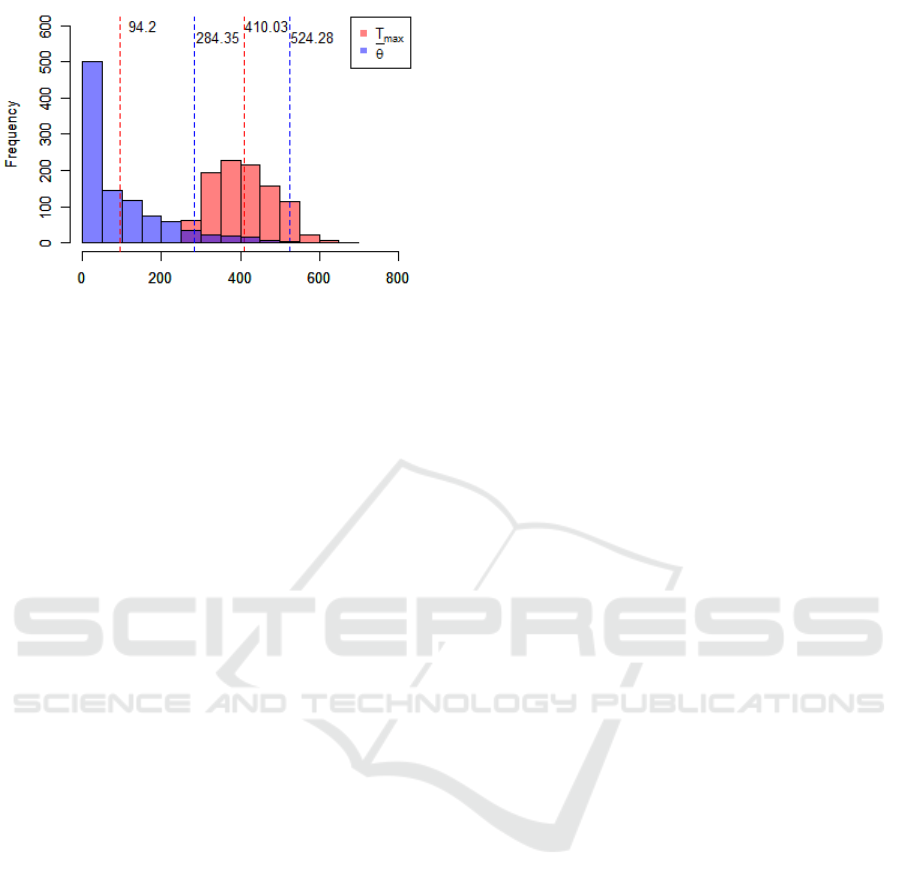
Figure 6: Histograms of T
max
and
¯
θ of Fig. 3 (C).
small n to reduce the computational cost, and Pareto
optimal solutions of manageable sizes are explored.
In the second phase, validation simulations with large
n are performed for each solution, to examine the
true Pareto efficiency. Subsequently, a small number
of Pareto optimal solutions are selected by evaluat-
ing expected value and AVaR Pareto optimal (EAPO)
efficiency with respect to both expected values and
AVaRs, which is the criterion for selecting the ap-
propriate size of the solutions from among the Pareto
optimal solutions generated by NSGA-II. The EAPO
solutions obtained are then presented to the decision
maker to choose the most preferable solution.
8 EXPERIMENT
In this section, we describe the experiment conducted
to explore the Pareto optimal solutions of the param-
eter set in a given environment (Fig. 1) using Tsu-
rushima’s method. The histograms of T
max
and
¯
θ in
Fig. 3(C) are presented in Fig. 6, where the former is
depicted in red and the latter in blue. The distribu-
tions of these two are different; the latter, in particu-
lar, has a heavy-tailed distribution that is difficult to
minimize because representative values may vary sig-
nificantly between small and large sample sizes. The
Pareto optimal solutions obtained may be inaccurate
because Tsurushima’s method performs NSGA-II on
small samples, which may lead to imprecise optimal
solutions. Minimizing AVaR, that is, max AVaR(−x),
is even more difficult because it is the expected value
of rare events, which may vary significantly with sam-
ple size. To address this issue, we conducted prelim-
inary studies to obtain some useful information prior
to the experiment.
1. Instead of solving the problem stated in Sec-
tion 5 directly, we took two objective functions
(5) and (6) from the problem and formulated a bi-
objective problem because in this problem, corre-
lations between the expected value and AVaR are
greater than 0.95 for both T
max
and
¯
θ according to
random parameter simulations.
2. To reduce the search space, we introduced a con-
straint on the parameter ξ as 0.0001 ≤ ξ ≤ 0.01
because the value of ξ, within a certain range, sig-
nificantly affects the results according to some ob-
servations and random parameter simulations. We
assumed λ(0) = 0.5 and n = 48, which may not be
sufficient to guarantee the utmost accuracy in re-
sults, thereby sacrificing accuracy at the expense
of computational cost. However, the assumptions
appear reasonable because based on our exten-
sive experimentation, a significantly better solu-
tion could rarely be achieved.
The four objective problems in Section 7.2 are relaxed
as follows:
min f
1
= mean{T
1
max
,. .. ,T
n
max
} (10)
min f
2
= mean{
¯
θ
1
,. .. ,
¯
θ
n
} (11)
s.t. λ(0) = 0.5, 0 < β ≤ 1,
0.0001 < ξ ≤ 0.01, 0 < γ ≤ 1.
(12)
The NSGA-II algorithm, with 40 populations, 40
generations, and n = 48 was applied to solve the
aforementioned bi-objective black box optimization
problem. 1000 validation simulations were performed
for each of the Pareto optimal solutions generated
by NSGA-II to verify the true Pareto efficiency and
EAPO solutions were selected. We used NetLogo
6.0.2 (Wilensky, 1999) for the multi-agent simula-
tions and R x64.3.5.1 to implement the optimization
algorithm and analyze the results. NetLogo was cho-
sen because of its good connectivity with the R lan-
guage. The libraries used included nsga2R, parallel,
and RNetLogo. The simulations and optimizations
were executed on a machine with an Intel Core i7 −
6700 CPU.
9 RESULTS AND DISCUSSION
Seven Pareto optimal solutions were generated using
NSGA-II, and three EAPO solutions were selected
after 1000 validation simulations. Fig. 7 shows the
seven Pareto optimal solutions generated by NSGA-
II (depicted as ×) and the results of validation sim-
ulations associated with the Pareto optima. The ex-
pected value and AVaR of the validation simulation
results are depicted by red and blue circles, respec-
tively. Solid circles indicate the EAPO solutions. The
results are summarized in Table 1. The results of
ICAART 2024 - 16th International Conference on Agents and Artificial Intelligence
114
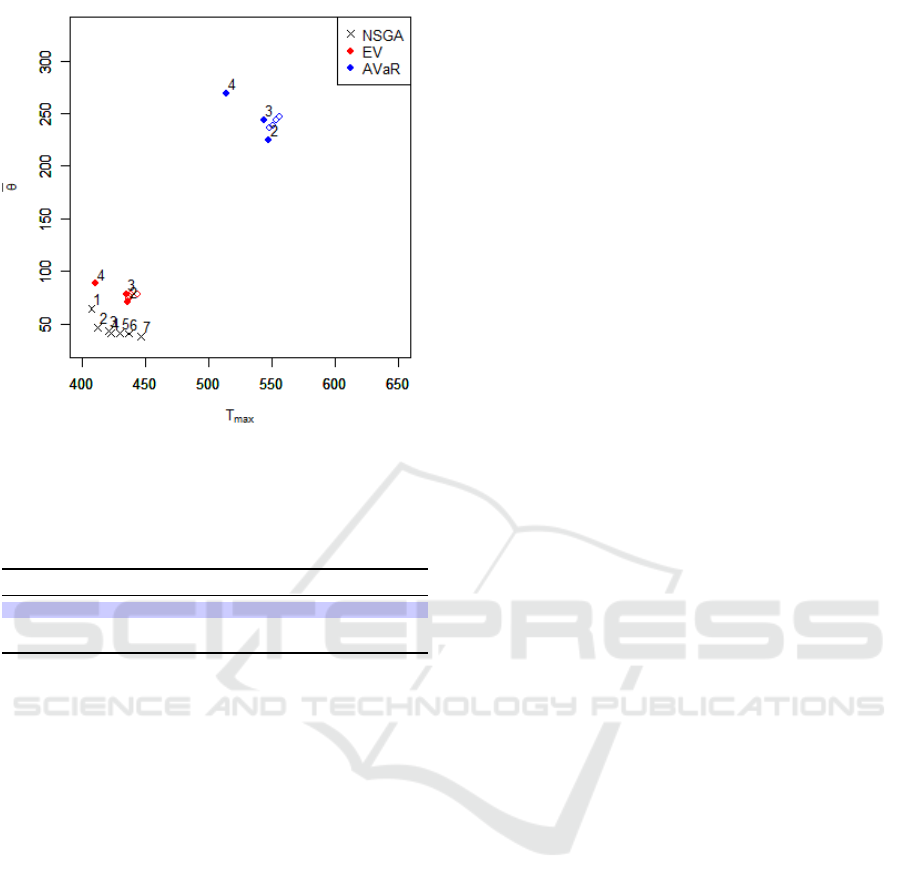
Figure 7: Pareto optimal solutions by NSGA-II and corre-
sponding solutions by validation simulations.
Table 1: Three EAPO solutions. f
1
, f
2
, f
3
, and f
4
denote mean{T
max
}, mean{
¯
θ}, −AVaR
0.2
{−T
max
}, and
−AVaR
0.2
{−
¯
θ}, respectively.
β ξ γ f
1
f
2
f
3
f
4
2 0.15 0.0098 0.98 435.8 71.0 547.2 225.2
3 0.15 0.0098 0.93 434.7 77.8 543.4 243.4
4 0.68 0.0080 0.02 410.2 88.2 514.3 269.1
1000 simulations for solution 2 (blue row in the ta-
ble) are shown in Fig. 5 (F). Let T
max
of (D), (E),
and (F) in Fig. 5 be T
D
max
, T
E
max
, T
F
max
, respectively,
and similarly
¯
θ
D
,
¯
θ
E
,
¯
θ
F
. In this figure, the solutions
for T
max
> −AVaR{−T
E
max
},
¯
θ > −AVaR{−
¯
θ
D
}, and
T
max
> −AVaR{−T
E
max
}∧
¯
θ > −AVaR{−
¯
θ
D
} are indi-
cated in red, blue, and green, respectively. In Solution
2 ((F) in Fig. 5), |{
¯
θ |
¯
θ
F
> −AVaR{−
¯
θ
D
}}| = 29,
which is reduced from |{
¯
θ |
¯
θ
D
> −AVaR{−
¯
θ
D
}}| =
89, {T
max
| T
F
max
> −AVaR{T
E
max
}} = φ.
In Fig. 5, comparing (F) with (D) and (E), a
reasonably good parameter set was found, allowing
for an efficient control mechanism for the distributed
evacuation guidance system; however, Fig. 7 indi-
cates that there are certain limitations to our approach.
The seven Pareto optimal solutions in the figure ob-
tained by NSGA-II with small sample size (× in the
figure) and the expected values of the corresonding
validation simulations (red circles in the figure) are
not close to each other. Moreover, the latter are
densely packed. These facts suggest that the Pareto
frontier of the multi-objective problem has not been
sufficiently explored. The solutions obtained are not
true Pareto optima, in that, better solutions may have
been overlooked.
A limitation of our approach is the accuracy of the
results because of limited computational resources.
The dynamics of the fire spread in our simulations
may have been inaccurate because we used a pseudo-
fire-spread model rather than a model based on the
computationally expensive Navier-Stokes equations.
This may have caused our pseudo-fire-spread model
to produce unrealistic results. However, this model
can produce a substantial number of fire-spread sce-
narios, which may be sufficient for exploring an ef-
ficient control mechanism because the goal in this
study was not to provide a precise analysis but to de-
velop a mechanism for distributed guidance systems.
In Tsurushima’s method, we explored Pareto op-
timal solutions using NSGA-II with a small number
of samples, which resulted in a set of solutions that
may not be truly Pareto optimum because of noisy
objective functions. The method we used may not
be the best way to solve the problem of the four
objectives presented in Section 7.2. Other multi-
objective evolutionary algorithms, such as NSGA-
III, MOEA/D, may be applicable instead of NSGA-
II, which perhaps is not appropriate for many objec-
tive problems. Multi-objective black-box optimiza-
tion techniques such as multi-objective Bayesian op-
timization may be applicable to our problem; how-
ever, the non-Gaussian error distribution in the objec-
tive function would make this problem still difficult
to solve. Therefore, new techniques are required to
address these issues.
Although a few studies (Zhao et al., 2022; Tsu-
rushima, 2024) were conducted, there is a crucial
need for a distributed evacuation guidance algorithm
that does not assume that all components work as in-
tended because the assumption of a perfectly func-
tioning system is unrealistic in real disaster evacua-
tion scenarios. Furthermore, evacuation studies have
focused only on average cases or a few scenarios, dis-
regarding low-probability catastrophic cases despite
their importance. In spite of limitations, our study
provides a first step toward a solution addressing these
problems.
10 CONCLUSION
An effective control mechanism based on Tsu-
rushima’s algorithm was developed for a distributed
evacuation guidance signage system during fire
spread. Additionally, Tsurushima’s parameter cali-
bration method was applied to the system to mini-
mize the occurrence of low-probability catastrophic
events. Experimental results demonstrated the profi-
ciency of the system in crowd control and its capa-
Integrated Simulation Approach for Dynamic Distributed Evacuation Guidance Under Fire Spread and Rare but Catastrophic Events
115

bility to suppress RBCE. This study takes the initial
steps towards resolving two crucial yet often over-
looked challenges in evacuation guidance research:
resilience and RBCE. It is imperative that any com-
puter system designed to operate under disaster con-
ditions, such as urban traffic control, emergency com-
munication, or emergency fire suppression system, ef-
fectively tackle both of these issues. The presented
approach offers valuable insights for addressing these
challenges in such systems.
ACKNOWLEDGMENT
The author would like to thank Mr. Kei Marukawa for
his assistance and helpful discussions. We would like
to thank Editage (www.editage.jp) for English lan-
guage editing.
REFERENCES
Cos¸kun, G., Demir, U., and Soyhan, H. (2022). Investiga-
tion of the smoke ventilation and evacuation strategies
to decrease smoke poisoning risk by coupling fire and
evacuation simulations. Journal of Applied Fluid Me-
chanics, 15:659–671.
Deb, K., Pratap, A., Agarwal, S., and Meyarivan, T. (2002).
A fast and elitist multiobjective genetic algorithm:
NSGA-II. IEEE Transactions on Evolutionary Com-
putation, 6(2):182–197.
Ferscha, A. and Zia, K. (2010). Lifebelt: Crowd evacua-
tion based on vibro-tactile guidance. IEEE Pervasive
Computing, 9(4):33–42.
Fraser-Mitchell, J. and Charters, D. (2005). Human be-
haviour in tunnel fire incidents. Fire Safety Science,
8:543–554.
Fridolf, K. (2010). Fire evacuation in undergaound trans-
portation systems: a review of accidents and research.
Technical report, The Department of Fire Safety Engi-
neering and Systems Safety, Lund University. Report
3151.
Gutjahr, W. J. and Pichler, A. (2016). Stochas-
tic multi-objective optimization: a survey on non-
scalarizing methods. Annals of Operations Research,
236(2):475–499.
Jasztal, M., Omen, c., Kowalski, M., and Jaskolowski, W.
(2022). Numerical simulation of the airport evacua-
tion process under fire conditions. Advances in Sci-
ence and Technology Research Journal, 16:249–261.
Lee, J., Lee, M., and Jun, C. (2018). Fire evacuation simula-
tion considering the movement of pedestrian accord-
ing to fire spread. ISPRS - International Archives of
the Photogrammetry, Remote Sensing and Spatial In-
formation Sciences, XLII-4/W9:273–281.
Liao, L., Li, H., Li, P., Bao, X., Hong, C., Wang, D., Xie,
X., Fan, J., and Wu, P. (2023). Underground evacu-
ation and smoke flow simulation in Guangzhou Inter-
national Financial City during fire. Fire, 6:266.
Mirahadi, F. and McCabe, B. (2020). EvacuSafe: Build-
ing evacuation strategy selection using route risk in-
dex. Journal of Computing in Civil Engineering,
34(2):04019051.
Rachec, S. T., Stoyanov, S. V., and Fabozzi, F. J. (2008). Ad-
vanced stochastic Models, Risk Assessment, and Port-
folio Optimization: The Ideal Risk, Uncertainty, and
Performance Measures. Wiley.
Tsurushima, A. (2021). Reproducing evacuation behaviors
of evacuees during the Great East Japan Earthquake
using the evacuation decision model with realistic set-
tings. In Proceedings of the 13th International Con-
ference on Agents and Artificial Intelligence - Volume
1: ICAART,, pages 17–27.
Tsurushima, A. (2022a). Efficient visual sign assign-
ment for crowd evacuation guidance considering risks
and multiple objectives. In Rocha, A. P., Steels, L.,
and van den Herik, J., editors, Agents and Artificial In-
telligence, pages 3–26, Cham. Springer International
Publishing.
Tsurushima, A. (2022b). Multi-objective risk analysis
for crowd evacuation guidance using multiple visual
signs. In Proceedings of the 14th International Con-
ference on Agents and Artificial Intelligence - Volume
1: ICAART,, pages 71–82. INSTICC, SciTePress.
Tsurushima, A. (2022c). Tunnel vision hypothesis: Cogni-
tive factor affecting crowd evacuation decisions. SN
Computer Science, 3(332).
Tsurushima, A. (2024). Simulation analysis of evacua-
tion guidance using dynamic distributed signage. In
Proceedings of the 16th International Conference on
Agents and Artificial Intelligence (ICAART 2024).
Wilensky, U. (1999). Netlogo. Center for Connected Learn-
ing and Computer-Based Modeling, Northwesten
University, Evanston, IL.
Zhao, H., Schwabe, A., Schl
¨
afli, F., Thrash, T., Aguilar, L.,
Dubey, R., Karjalainen, J., H
¨
olscher, C., Helbing, D.,
and Schinazi, V. (2022). Fire evacuation supported
by centralized and decentralized visual guidance sys-
tems. Safety Science, 145:105451.
Zheng, Y., Jia, B., Li, X.-G., and Jiang, R. (2017). Evacua-
tion dynamics considering pedestrians’ movement be-
havior change with fire and smoke spreading. Safety
Science, 92:180–189.
ICAART 2024 - 16th International Conference on Agents and Artificial Intelligence
116
