
Identification of Bistability in Enzymatic Reaction Networks Using
Hysteresis Response
Takashi Naka
*
Faculty of Science and Engineering, Kyushu Sangyo University, Fukuoka, Japan
Keywords: Enzymatic Reaction Network, Regulatory Network, Hysteresis Response, Bistability, Mathematical Model.
Abstract: Intracellular signaling systems can be viewed as enzymatic reaction networks in which enzymes regulate each
other through activation and inactivation, and exhibit various properties such as bistability depending on their
regulatory structure and parameter values. In this study, we formulate the intracellular signaling systems as
regulatory networks whose nodes are cyclic reaction systems of enzyme activation and inactivation, and
propose an evaluation function that can identify bistability with low computational cost. For the purpose of
demonstrating its effectiveness, we identified 4- and 5-node regulatory networks that exhibit bistability.
Furthermore, the effect of parameter values on bistability was analyzed, suggesting that the regulatory
structure is more dominant than parameter values for the emergence of bistability.
1 INTRODUCTION
Intracellular signaling systems can be viewed as
enzymatic reaction networks in which enzymes
regulate each other through activation and
inactivation, and are known to exhibit various
characteristics depending on their regulatory
relationships and parameter values (Ferrell, 1998;
Jeschke et al., 2013; Kholodenko, 2006; Mai & Liu,
2013; Qiao et al., 2007; Volinsky & Kholodenko,
2013). For example, the MAPK cascade, one of the
most representative and well analyzed enzymatic
reaction network, has been reported to have
ultrasensitive properties that can function as an
analog-to-digital conversion in the cell. It has also
been shown that it can be bistable as an extreme case.
Multistability, represented by bistability,
corresponds to a stable group of states in the cell and
is thought to provide robust control over intra- and
extracellular disturbances (Gedeon et al., 2018; Ma et
al., 2009; Yao et al., 2011). Bistability is also an
important property from the standpoint of synthetic
biology, as it may function as a memory element
(Doncic et al., 2015). Therefore, it is interesting to
know what kind of regulatory structures and
parameter values of enzymatic reaction networks
show bistability, and studies have been conducted to
analyze the properties of enzymatic reaction networks
*
http://www.is.kyusan-u.ac.jp/~naka/
by changing the structure and parameter values of the
networks in an exhaustive manner (Kuwahara & Gao,
2013; Ramakrishnan & Bhalla, 2008; Shah & Sarkar,
2011; Siegal-Gaskins et al., 2011; Sueyoshi & Naka,
2017).
In order to identify enzymatic reaction networks
with specific properties, such as bistability, an
evaluation function is needed to quantify the degree
of the property. It is also necessary to select an
appropriate mathematical model to describe the
enzymatic reaction networks. With respect to the
number of enzyme species that comprise the
enzymatic reaction network, several efforts have been
made to address the combinatorial increase in
computational cost of their identification.
One innovation is the simplification of the
mathematical model of enzymatic reactions.
Enzymatic reactions can be described by a system of
differential equations by applying the law of mass
action, but to reduce computational cost, the
Michaelis-Menten or linear approximation is
sometimes used (Adler et al., 2017; Kuwahara & Gao,
2013; Ma et al., 2009; Shah & Sarkar, 2011; Sueyoshi
& Naka, 2017; Yao et al., 2011). However, if
possible, the analysis would be more accurate without
those approximations. In fact, with respect to
bistability, it has been suggested that the Michaelis-
Menten approximation overstates the evaluation
Naka, T.
Identification of Bistability in Enzymatic Reaction Networks Using Hysteresis Response.
DOI: 10.5220/0012416000003657
Paper published under CC license (CC BY-NC-ND 4.0)
In Proceedings of the 17th International Joint Conference on Biomedical Engineering Systems and Technologies (BIOSTEC 2024) - Volume 1, pages 479-486
ISBN: 978-989-758-688-0; ISSN: 2184-4305
Proceedings Copyright © 2024 by SCITEPRESS – Science and Technology Publications, Lda.
479

(Kim & Tyson, 2020; Naka, 2020). Therefore, in this
study, we use a mathematical model that does not
make any approximations, only applying the law of
mass action.
There are also several methods for the evaluation
function of bistability. An enzymatic reaction
network has two kinds of parameters: the total
concentration of each enzyme that makes it up and the
reaction rate constants for each enzyme. For a
particular set of parameter values of a system, there
are possible ways to transition from a random initial
value group to a steady state (Naka, 2022). If the
system is bistable and a sufficient number of initial
value groups are used, bistability can be detected due
to the system transitions to two values of steady
states. However, the computational cost is higher
because steady-state values must be obtained for a
number of initial value groups.
Another possible method is to fix one value of a
certain reaction rate constant, etc. as an input to the
system, and then gradually change the value to obtain
a steady state sequentially. If the system is bistable, it
takes advantage of the property that different steady-
state values are reached when its input values are
increased or decreased. This is less computationally
expensive than the aforementioned method. This
method will be referred to as the sequential steady-
state tracking method in this study. Figure 1 shows an
example of a regulatory network consisting of 4
nodes. In this study, we propose an evaluation
function using hysteresis response that extends the
sequential steady-state tracking method and verify its
effectiveness.
The MAPK cascade, a representative signaling
system that relays between the plasma membrane and
cell nucleus with respect to cell growth factor (EGF)
signaling, is thought to be the cause of cell cancer,
and much has been learned about its abnormalities
(Ferrell, 1998; Jeschke et al., 2013; Kholodenko,
2006; Mai & Liu, 2013; Qiao et al., 2007; Volinsky
& Kholodenko, 2013). A major component of the
signaling system represented by the MAPK cascade
is the enzymatic activation/inactivation cyclic
reaction system through phosphorylation and
dephosphorylation of enzymes. The cyclic reaction
system is a combination of two post-translational
modification reactions. Therefore, we model and
analyze the intracelluler signaling system as a
regulatory network consisting of enzymatic
activation/inactivation cyclic reaction systems, which
mutually regulate each other.
Figure 1: Regulatory network consisting of 4 nodes. The
number is the node number. Node 1 is an input node. Node
4 is the output node. Blue and red arrows represent positive
and negative regulations, respectively.
2 REGULATORY NETWORKS TO
BE ANALYZED
The regulatory network is a representation of the
regulatory relationships between enzymes, where
each node included corresponds to a cyclic reaction
system of enzymatic activation and inactivation. The
cyclic reaction system is an enzymatic reaction
system that combines two post-translational
modification reactions represented by
phosphorylation. It is represented by the following
reaction scheme.
U
i
is the inactive form of the enzyme, S
i
is the
activating enzyme that catalyzes the activation of U
i
,
Q
i
is the enzyme-substrate complex to which U
i
and
S
i
are bound, P
i
is the active form of the enzyme, V
i
is the inactivating enzyme that catalyzes the
inactivation of P
i
, R
i
is the enzyme-substrate complex
to which P
i
and V
i
are bound. a
i
, d
i
, k
i
, b
i
, e
i
, and l
i
are
the reaction rate constants for each reaction. The
subscript i is the node number in the regulatory
network.
By applying the law of mass action to the reaction
scheme, we obtain a system of differential equations
describing the behavior of the system shown below.
The activated enzyme P
i
catalyzes the activation or
inactivation reaction of the enzyme at the other node.
BIOINFORMATICS 2024 - 15th International Conference on Bioinformatics Models, Methods and Algorithms
480

Figure 1 shows an example of a regulatory
network consisting of 4 nodes. The blue arc from
node j to node i means that the activated enzyme P
j
at
node j is catalyzing the activation reaction of the
enzyme at node i as the activated enzyme S
i
. This is
called node j positively regulating node i. The red arc
from node j to node i means that the activated enzyme
P
j
at node j is catalyzing the inactivation reaction of
the enzyme at node i as the inactivating enzyme V
i
.
This is called node j negatively regulating node i.
In this study, assuming a typical signaling system
such as a MAPK cascade, we will analyze regulatory
networks with 4 and 5 nodes that satisfy the following
constraints.
• It has one input node and one output node, and
is connected from the input node to the output
node with positive or negative regulations
through intermediate nodes.
• Each node receives at most two regulations,
positive and negative, from the other nodes.
• Each node regulates at most two other nodes.
• There is no auto-regulaton.
• The input node is node 1 and is not regulated by
any other node.
• The output node is node N if the number of
nodes is N. Since a regulation of the outside of
the regulatory network is assumed for the output
node, the output node regulates at most one
other node in the regulatory network.
There are 80 regulatory networks of 4 nodes and 912
regulatory networks of 5 nodes that satisfy the above
conditions.
3 IDENTIFICATION OF
BISTABILITY USING THE
HYSTERESIS RESPONSE
The value of the reaction rate constant k
1
of the cyclic
reaction system corresponding to the input node is the
external input to the regulatory network, which is the
oscillatory stimulus in the following equation.
T is the period of oscillation. In this study, the period
was set to 3600 seconds, i.e. 1 hour. This is large
enough to allow time for the intracellular signaling
system to reach a steady state.The system is intended
Figure 2: Oscillatory input and the response. Response of
the output enzyme activity to the oscillatory input stimulus
for the regulatory network of Fig. 1. The blue curve is the
time course of k
1
, the input to the system. Two periods are
displayed. The ochre curve is the time course of the relative
concentration of P
4
, the output of the system. The red circle
corresponds to the value of the output when the value of the
input is 0.5, indicated by the blue circle.
to maintain an approximate steady state in its
response to the oscillatory input. The output of the
regulatory network is the relative concentration P
N
of
the activated enzyme at node N if the number of nodes
is N.
Figure 2 shows an example of the response of the
4-node regulatory network shown in Fig. 1 to a
oscillatory input. The total concentration of each
enzyme and the reaction rate constant are all set to 1,
except for k
1
, the input to be varied. The unit system
is the μM-sec system. The blue curve is the time
course of k
1
, the input to the system. Two periods are
displayed. The ochre curve is the time course of the
relative concentration of P
4
, the output of the system.
The time course of the output differs when the input
is increasing and when it is decreasing, indicating the
appearance of hysteresis. When the input is
increasing, the output gradually decreases as the input
increases, but when the input is decreasing, the output
is almost zero until the value of the input is around
0.25, at which point it rapidly increases. The red
circle in the figure corresponds to the value of the
output when the input value is 0.5, indicated by the
blue circle. It can be seen that the values are different
when the input is increasing and when it is
decreasing.
The phase diagram between input k
1
and output P
4
in Fig. 2 is shown in Fig. 3. The blue and red circles
correspond to those in Fig. 2. The upper right-
descending line corresponds to the output when the
input is rising, and the lower curve corresponds to the
output when the input is decreasing. It can be seen
that a typical hysteresis appears, where the response
differs between rising and falling inputs. From the
figure, it can be read that the input is bistable in the
range of 0.2 to around 0.8.
Identification of Bistability in Enzymatic Reaction Networks Using Hysteresis Response
481
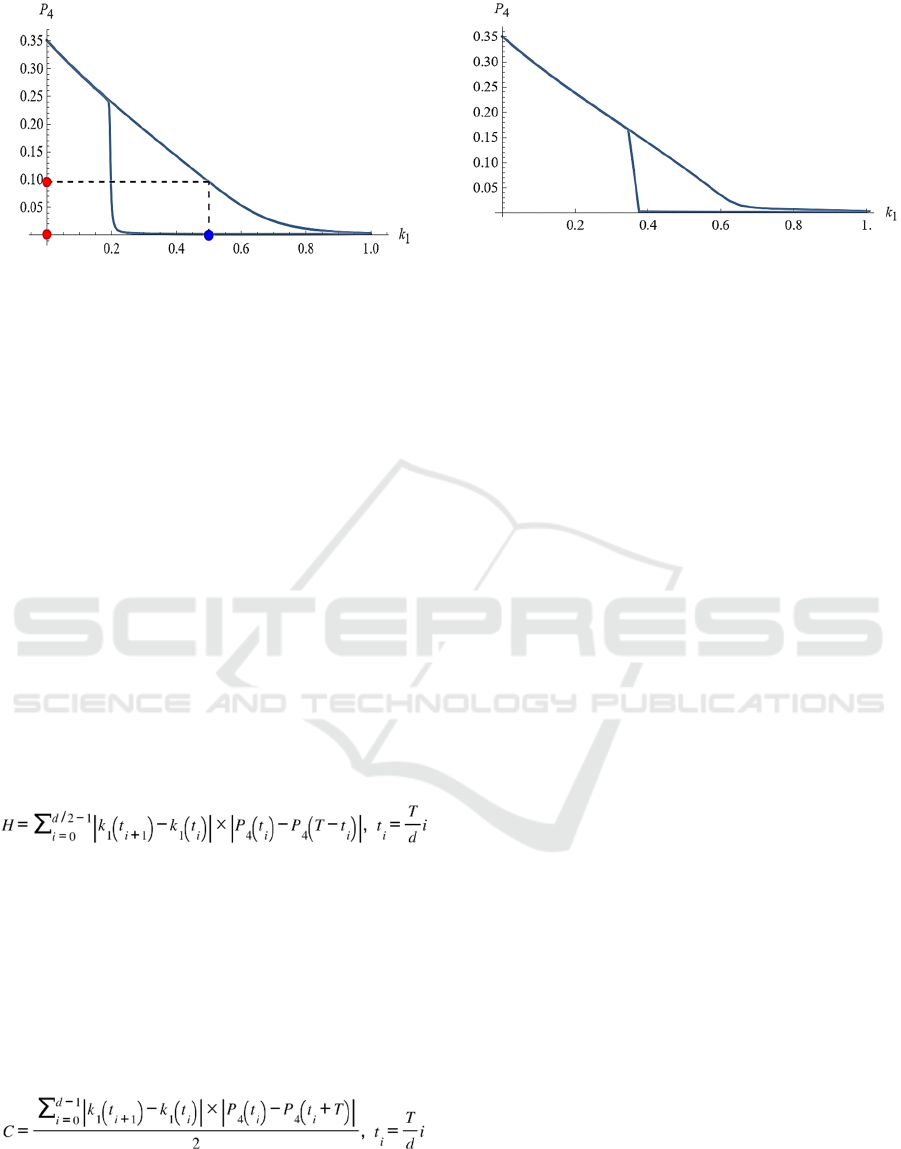
Figure 3: Hysteresis on the oscillatory response. Phase
diagram of the input k
1
and output P
4
in Fig. 2. The blue and
red circles correspond to those in Fig. 2.
The hysteresis loss H is used as a quantitative
measure of the bistability of the system, which is
formulated as bellow.
The hysteresis loss is the area of the closed region
appearing in the phase diagram. The area is
approximated by a finite sum of T/d time intervals,
where T is the period of the input and d is the number
of divisions. Since both input and output are
normalized to a maximum value of 1, the maximum
hysteresis loss is 1. In this study, the value of the
number of divisions d is set to 50. The convergence
rate C is used to quantify the degree of convergence
of the hysteresis loss, which is formulated as bellow.
This is the difference between the hysteresis loss in
the first period and the hysteresis loss in the
subsequent period.
Figure 4 shows the hysteresis loss using the
sequential steady-state tracking method mentioned
above. This is a method in which the steady-state
value of the system is first obtained with zero input,
and the value at that time is used as the initial value,
and the steady-state value is obtained sequentially as
the input is gradually increased. Therefore, the
accuracy is considered to be higher than the method
using hysteresis response proposed here. However, if
this method is executed in a form corresponding to
the number of divisions mentioned above, a
convergence calculation of the system is performed
for the number of divisions, and the computational
cost is at least the number of division times. The
curves in Fig. 4 is similar to that in Fig. 3 using
hysteresis, indicating that the hysteresis-based
method proposed here is effective. Mathematica
Figure 4: Hysteresis on the steady state. Hysteresis loss by
sequential steady-state tracking method.
v13.0 was used to derive a system of differential
equations describing the behavior of the system from
the enzymatic reaction network and to numerically
solve the derived system of differential equations to
calculate hysteresis loss H and convergence rate C,
and to analyze bistability (Wolfram Research, 2021).
4 IDENTIFICATION OF
BISTABLE REGULATORY
NETWORKS
The results of the analysis for 80 regulatory networks
of 4 nodes that satisfy the constraints are shown in
Fig. 5. The horizontal axis is the hysteresis loss H and
the vertical axis is the convergence rate C. The total
concentration of each enzyme and the reaction rate
constants, all set to 1, are circled in red. The unit
system is μM-sec.
To further investigate the effect of reaction rate
constants on hysteresis loss, the reaction rate
constants of the nodes other than the input node were
varied. However, to prevent the combination of
parameters from becoming too large, the six values
included in the cyclic reaction system comprising
each node were kept the same value. The range of
change was set to 11 values of 2
p
(p is an integer from
-5 to 5) to approximately include the values used in
the literature as reaction rate constants for the
enzymes comprising the MAPK cascade (Brightman
& Fell, 2000; Hatakeyama et al., 2003; Huang &
Ferrell, 1996; Levchenko et al., 2000; Schoeberl et
al., 2002). On the other hand, with respect to the input
node, k
1
among the reaction rate constants of that
cyclic reaction system was assumed to be the
oscillatory input and all other reaction rate constants
were fixed at 1, since it is intended to change the
concentration of P
1
, which is the input to node 2.
Thus, the total number of combinations of parameters
is 11
3
=1331. In practice, however, the values of all
BIOINFORMATICS 2024 - 15th International Conference on Bioinformatics Models, Methods and Algorithms
482
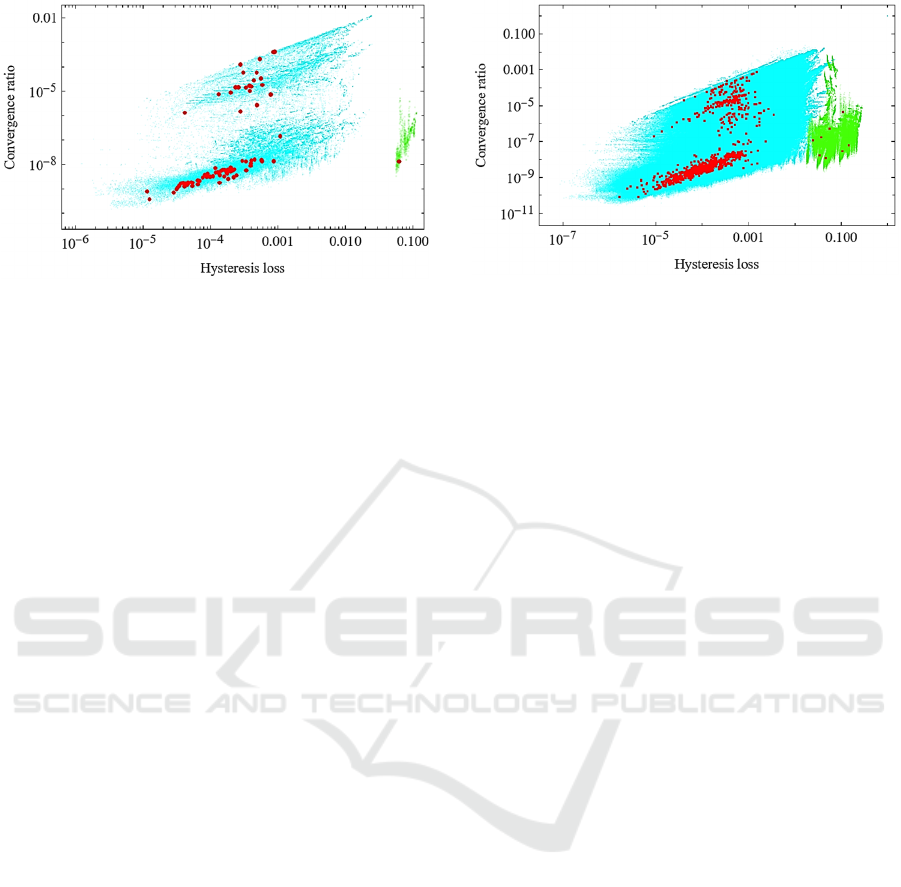
Figure 5: Aspect of hysteresis on 4 nodes networks. Results
for 80 4-node regulatory networks. The horizontal axis is
the hysteresis loss H and the vertical axis is the convergence
rate C. The red circles are the results when the total
concentration of each enzyme and the reaction rate
constants are all set to 1. The other set of fine dots
correspond to the case where the reaction rate constants of
the nodes other than the input node are varied.
reaction rate constants are multiplied by a factor of 10
for the purpose of increasing the rate of convergence.
This is the same as multiplying the period of the
oscillatory input by a factor of 10, which means that
the velocity of the oscillation is slowed down to 1/10.
The results are shown as a set of blue and green
fine dots in Fig. 5. Only one regulatory network had
a hysteresis loss value of about 0.1. The hysteresis
loss of 0.1 is a fairly prominent value for the
hysteresis loss region in the phase diagram. This
regulatory network corresponds to the red circle and
the fine green points isolated on the right side of the
figure. This is the regulatory network used as an
example in Fig. 1 through Fig. 4. Compared to the
distribution of the red circles, the variation due to the
parameter values indicated by the fine colored dots is
distributed over a limited small area. This suggests
that the network structure is dominant with respect to
the property of bistability and robust with respect to
parameter values, despite the limitation that the
reaction rate constants within each node are identical.
There are 912 regulatory networks of 5 nodes that
satisfy the constraints. Figure 6 shows the results of
the analysis. As in Fig. 5, the horizontal axis is the
hysteresis loss H and the vertical axis is the
convergence rate C.
The meaning of the red circles and colored fine
point groups is the same as in Fig. 5. In the 6-node
regulatory network, eight had hysteresis loss values
greater than 0.01. These correspond to the eight red
circles and green fine dots scattered on the right side
of the fig. 6. As in the 5-node regulatory network, the
variation due to the values of the parameters indicated
Figure 6: Aspect of hysteresis on 5 nodes networks. Results
for 912 5-node regulatory networks. The horizontal axis is
the hysteresis loss H and the vertical axis is the convergence
rate C. The red circles are the results when the total
concentration of each enzyme and the reaction rate
constants are all set to 1. The other set of fine dots
correspond to the case where the reaction rate constants of
the nodes other than the input node are varied.
by the fine blue and green dots is distributed in a
limited area, compared to the distribution of the red
circles. This suggests again that the network structure
is dominant with respect to the bistability property
and robust with respect to the parameter values,
although there is still the restriction that the reaction
rate constants within each node are identical.
Figure 7 shows 5-node regulatory networks with
hysteresis loss greater than 0.01. The regulatory
structure of the network and the phase diagram of
input k
1
and output P
5
are laid out. It can be seen that
the regulatory structure of the 4-node regulatory
network, which exhibits the bistability shown in Fig.
1, is contained in the third from the top of the left
column and the second from the top of the right
column. It is a structure of mutual negative regulation
between node 2 and node 3 and positive regulation
between node 3 and node 4. The regulatory structures
of the remaining three regulatory networks are also
found to have similar structures, although there is
intervening positive regulation in between.
5 CONCLUSIONS
For 4- and 5-node regulatory networks, where the
cyclic reaction system is the node and the regulatory
relationship between them is the arc, the method
using hysteresis response for identifying bistability
was found to be effective. This method has errors
compared to the sequential steady-state tracking
method, but the computational cost is much lower.
Identification of Bistability in Enzymatic Reaction Networks Using Hysteresis Response
483
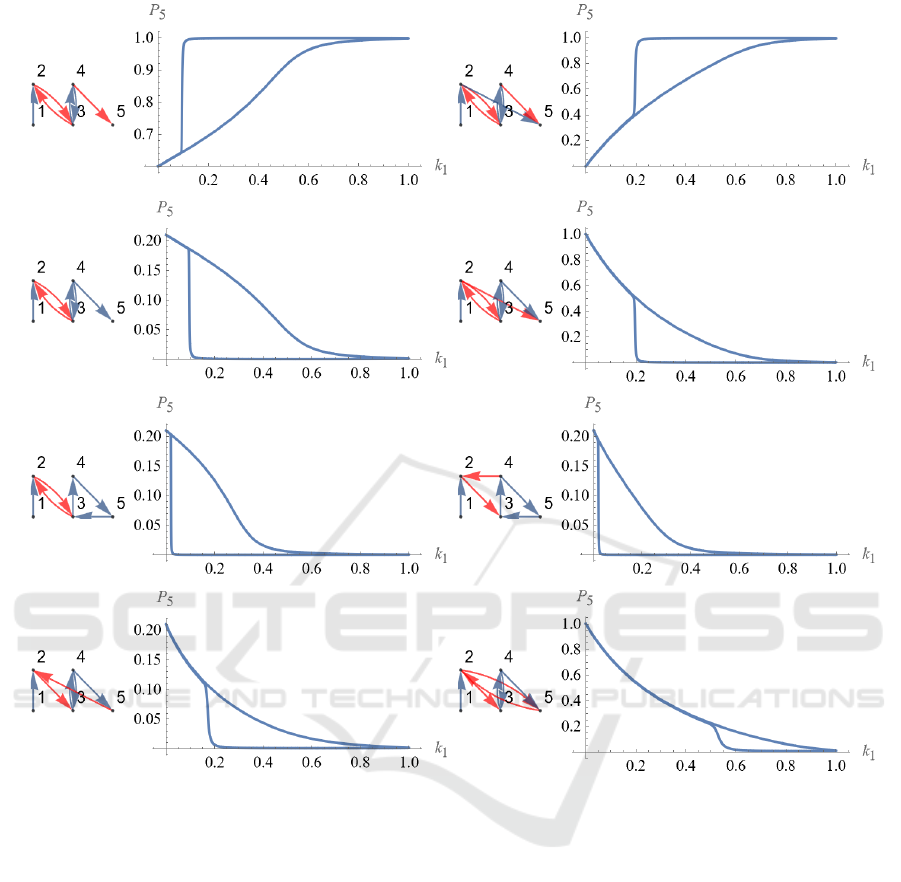
Figure 7: Bistable regulatory 5 nodes networks. 5-node regulatory networks with hysteresis loss greater than 0.01. The
regulatory structure of the network and the phase diagram of input k
1
and output P
5
are laid out.
This error is not particularly problematic when it
comes to primary screening of the regulatory
networks.
The authors have proposed a representation of
enzymatic reaction networks using set partitioning
and a search algorithm based on the representation, in
which a method with random initial value group is
used as the evaluation function for bistability (Naka,
2022). The computational cost was therefore
enormous, requiring time on the order of several days
to complete the search. The evaluation function using
hysteresis response proposed here is expected to have
an application to search as well, since its cost is
expected to be about 1/100 of that estimated from its
computational complexity. In fact, most of the
computational cost is the convergence calculation
performed to find the steady state of the system. In
the sequential steady state tracking method used to
validate the proposed method, the convergence
calculation must be performed as many times as the
number of divisions of the parameter values to be
analyzed, which in this study is set at 50, resulting in
a computational cost approximately 50 times higher.
Furthermore, the method using a random initial value
group described above requires a sufficient number of
initial values to separate two transition destinations in
a bistable system. Even if the value is set to about 10,
the convergence calculation must be performed about
500 times, i.e., the number of initial values multiplied
by the number of divisions. In the evaluation function
using the hysteresis response proposed here, the
convergence calculation to find the steady state of the
system only needs to be performed once to find the
BIOINFORMATICS 2024 - 15th International Conference on Bioinformatics Models, Methods and Algorithms
484

initial values, and as a result, the computational cost
is about 1/100 of the original cost.
The results also suggest that the regulatory
structure of the network is dominant with respect to
the bistability compared to the parameter values. This
indicates that, when searching for regulatory
networks with bistability, it may be effective, for
example, to fix all parameter values to 1 and search
for variations in structure only.
By the way, the enzymatic reaction networks
analyzed here were cyclic reaction systems as nodes.
The MAPK cascade, a typical signal transduction
system, includes the process of double
phosphorylation. To extend the mathematical model
of this study to include the process of double
phosphorylation in the analysis, the set of differential
equations derived from a single node can be modified.
In the future, we intend to extend it as such and apply
it to a more realistic analysis of bistability in
intracellular signaling systems.
REFERENCES
Adler, M., Szekely, P., Mayo, A., & Alon, U. (2017).
Optimal Regulatory Circuit Topologies for Fold-
Change Detection. Cell Syst, 4(2), 171-181 e178.
https://doi.org/S2405-4712(16)30419-7 [pii],
10.1016/j.cels.2016.12.009
Brightman, F. A., & Fell, D. A. (2000). Differential
feedback regulation of the MAPK cascade underlies the
quantitative differences in EGF and NGF signalling in
PC12 cells. FEBS Letters, 482, 169-174.
Doncic, A., Atay, O., Valk, E., Grande, A., Bush, A.,
Vasen, G., Colman-Lerner, A., Loog, M., & Skotheim,
J. M. (2015). Compartmentalization of a bistable switch
enables memory to cross a feedback-driven transition.
Cell, 160(6), 1182-1195. https://doi.org/10.1016/
j.cell.2015.02.032, S0092-8674(15)00198-1 [pii]
Ferrell, J. E., Jr. (1998). How regulated protein
translocation can produce switch-like responses.
Trends in Biochemical Science, 23, 461-465.
Gedeon, T., Cummins, B., Harker, S., & Mischaikow, K.
(2018). Identifying robust hysteresis in networks. PLoS
Comput Biol, 14(4), e1006121. https://doi.org/10.1371/
journal.pcbi.1006121 PCOMPBIOL-D-17-01583 [pii]
Hatakeyama, M., Kimura, S., Naka, T., Kawasaki, T.,
Yumoto, N., Ichikawa, M., Kim, J. H., Saito, K., Saeki,
M., Shirouzu, M., Yokoyama, S., & Konagaya, A.
(2003). A computational model on the modulation of
mitogen-activated protein kinase (MAPK) and Akt
pathways in heregulin-induced ErbB signalling.
Biochemical Journal, 373(Pt 2), 451-463.
Huang, C. F., & Ferrell, J. E., Jr. (1996). Ultrasensitivity in
the mitogen-activated protein kinase cascade.
Proceedings of the National Academy of Science of the
United States of America, 93, 10078-10083.
Jeschke, M., Baumgartner, S., & Legewie, S. (2013).
Determinants of cell-to-cell variability in protein kinase
signaling. PLoS Comput Biol, 9(12), e1003357.
https://doi.org/10.1371/journal.pcbi.1003357
PCOMPBIOL-D-13-00825 [pii]
Kholodenko, B. N. (2006). Cell-signalling dynamics in
time and space. Nat Rev Mol Cell Biol, 7(3), 165-176.
http://www.ncbi.nlm.nih.gov/entrez/query.fcgi?cmd=
Retrieve&db=PubMed&dopt=Citation&list_uids=164
82094
Kim, J. K., & Tyson, J. J. (2020). Misuse of the Michaelis-
Menten rate law for protein interaction networks and its
remedy. PLoS Comput Biol, 16(10), e1008258.
https://doi.org/10.1371/journal.pc bi.1008258
Kuwahara, H., & Gao, X. (2013). Stochastic effects as a
force to increase the complexity of signaling networks.
Sci Rep, 3, 2297. https://doi.org/10.1038/srep02297
srep02297 [pii]
Levchenko, A., Bruck, J., & Sternberg, P. W. (2000).
Scaffold proteins may biphasically affect the levels of
mitogen-activated protein kinase signaling and reduce
its threshold properties. Proceedings of the National
Academy of Science of the United States of America,
97(11), 5818-5823.
Ma, W., Trusina, A., El-Samad, H., Lim, W. A., & Tang,
C. (2009). Defining network topologies that can
achieve biochemical adaptation. Cell, 138(4),
760-773. https://doi.org/10.1016/j.cell.2009.06.013
S0092-8674(09)00712-0 [pii]
Mai, Z., & Liu, H. (2013). Random parameter sampling of
a generic three-tier MAPK cascade model reveals major
factors affecting its versatile dynamics. PLoS One, 8(1),
e54441. https://doi.org/10.1371/journal.pone.0054441
PONE-D-12-24261 [pii]
Naka, T. (2020). Validity of the Michaelis-Menten
Approximation for the Stability Analysis in Regulatory
Reaction Networks. BIOSTEC 2020 (13th International
Joint Conference on Biomedical Engineering Systems
and Technologies), Valletta, Malta.
Naka, T. (2022). The partition representation of enzymatic
reaction networks and its application for searching bi-
stable reaction systems. PLoS One, 17(1), e0263111.
https://doi.org/10.1371/journal.pone.0263111
Qiao, L., Nachbar, R. B., Kevrekidis, I. G., & Shvartsman,
S. Y. (2007). Bistability and oscillations in the Huang-
Ferrell model of MAPK signaling. PLoS Comput Biol,
3(9), 1819-1826. https://doi.org/07-PLCB-RA-0294
[pii] 10.1371/journal.pcbi.0030184
Ramakrishnan, N., & Bhalla, U. S. (2008). Memory
switches in chemical reaction space. PLoS Comput
Biol, 4(7), e1000122. https://doi.org/10.1371/
journal.pcbi.1000122
Schoeberl, B., Eichler-Jonsson, C., Gilles, E. D., & Muller,
G. (2002). Computational modeling of the dynamics of
the MAP kinase cascade activated by surface and
internalized EGF receptors. Nature Biotechnology, 20,
370-375.
Shah, N. A., & Sarkar, C. A. (2011). Robust network
topologies for generating switch-like cellular
responses. PLoS Comput Biol, 7(6), e1002085.
Identification of Bistability in Enzymatic Reaction Networks Using Hysteresis Response
485

https://doi.org/10.1371/journal.pcbi.1002085 10-
PLCB-RA-2608 [pii]
Siegal-Gaskins, D., Mejia-Guerra, M. K., Smith, G. D., &
Grotewold, E. (2011). Emergence of switch-like
behavior in a large family of simple biochemical
networks. PLoS Comput Biol, 7(5), e1002039.
https://doi.org/10.1371/journal.pcbi.1002039
PCOMPBIOL-D-10-00298 [pii]
Sueyoshi, C., & Naka, T. (2017). Stability Analysis for the
Cellular Signaling Systems Composed of Two
Phosphorylation-Dephosphorylation Cyclic Reactions.
Computational Molecular Bioscience, 7, 33-45.
Volinsky, N., & Kholodenko, B. N. (2013). Complexity of
receptor tyrosine kinase signal processing. Cold Spring
Harb Perspect Biol, 5(8), a009043. https://doi.org/
10.1101/cshperspect.a009043a009043 [pii] 5/8/a009
043 [pii]
Wolfram Research, I. (2021). Mathematica. In (Version
13.0)
Yao, G., Tan, C., West, M., Nevins, J. R., & You, L. (2011).
Origin of bistability underlying mammalian cell cycle
entry. Mol Syst Biol, 7, 485. https://doi.org/10.1038/
msb.2011.19msb201119 [pii]
BIOINFORMATICS 2024 - 15th International Conference on Bioinformatics Models, Methods and Algorithms
486
