
FEAT: A Fast, Effective, and Feasible Model for Molecular Property
Prediction Based on Graph Neural Network
Mukesh Kumar Rohil
a
and Ishan Sharma
Department of Computer Science and Information Systems, Birla Institute of Technology and Science,
Pilani, Rajasthan 333 031, India
Keywords: Artificial Intelligence, Machine Learning, Graph Neural Networks, QSAR, Molecular Property Prediction.
Abstract: Artificial Intelligence based methods and algorithms are being increasingly used by chemists to perform
various tasks that would be rather difficult to perform using conventional methods. Whenever scientists design
a new set of molecules for certain application, they need to experimentally validate if it possesses the desirable
properties. Such (iterative) methods are often expensive and time-consuming. In the realm of Artificial
Intelligence and Machine Learning, the molecules can themselves be viewed as graphs present in nature with
bonds as edges and nodes as atoms. Therefore, it is worthwhile to exploit Graph Neural Networks for
extracting the structural properties of these atoms and bonds, so as to further leverage these to predict the
properties of these molecules (represented as graphs) as a whole. We propose a Graph Neural Network based
model, FEAT, for this purpose. FEAT’s performance has been evaluated on multiple publicly available
datasets and the results obtained are promising.
1 INTRODUCTION
In recent times various Artificial Intelligence (AI)
methods and algorithms are being used more and more
by chemists to perform various tasks that would be
rather difficult to perform using traditional methods.
Latest applications of AI in chemistry are targeted
towards designing new molecules for drug discovery,
attaining knowledge of universe etc. Whenever
researchers design a new molecule, its properties have
to be experimentally identified and analysis is to be
performed whether they are the desired ones or not.
Many a times the process of experimentally identifying
the properties becomes rather expensive and time-
consuming as we may have hundreds or even
thousands of new molecules designed and waiting to
test for properties. These experimentations can be
iteratively done with the help of artificial intelligence.
1.1 Quantitative Structure, Activity
Relationship
Quantitative Structure-Activity Relationship (QSAR)
models have been used in the past to predict
a
https://orcid.org/0000-0002-2597-5096
molecular properties using physical laws or empirical
relationships relating the structure of the molecule to
their properties.
The physiological activity Φ was expressed as a
function of chemical structure C.
Φ = f(C) (1)
One of the first historical QSAR applications was
to predict boiling points for different molecules
(Dearden, 2003). A general trend was observed
between number of carbons in alkanes and their
boiling points. The boiling points for alkanes
increases as the number of carbons increased in the
molecules (Dearden, 2003).
But generally, the patterns within structure and
properties are not usually very straightforward and
are very complex in nature. Hence, we try to
implement the same idea using Artificial Intelligence
and Machine Learning so that complex structural-
property relations could be extracted from molecules
to predict some property (e.g. solubility) accurately.
1.2 Graph Neural Networks
Graphs are a type of data structures having two
878
Rohil, M. and Sharma, I.
FEAT: A Fast, Effective, and Feasible Model for Molecular Property Prediction Based on Graph Neural Network.
DOI: 10.5220/0012410700003636
Paper published under CC license (CC BY-NC-ND 4.0)
In Proceedings of the 16th International Conference on Agents and Artificial Intelligence (ICAART 2024) - Volume 3, pages 878-881
ISBN: 978-989-758-680-4; ISSN: 2184-433X
Proceedings Copyright © 2024 by SCITEPRESS – Science and Technology Publications, Lda.
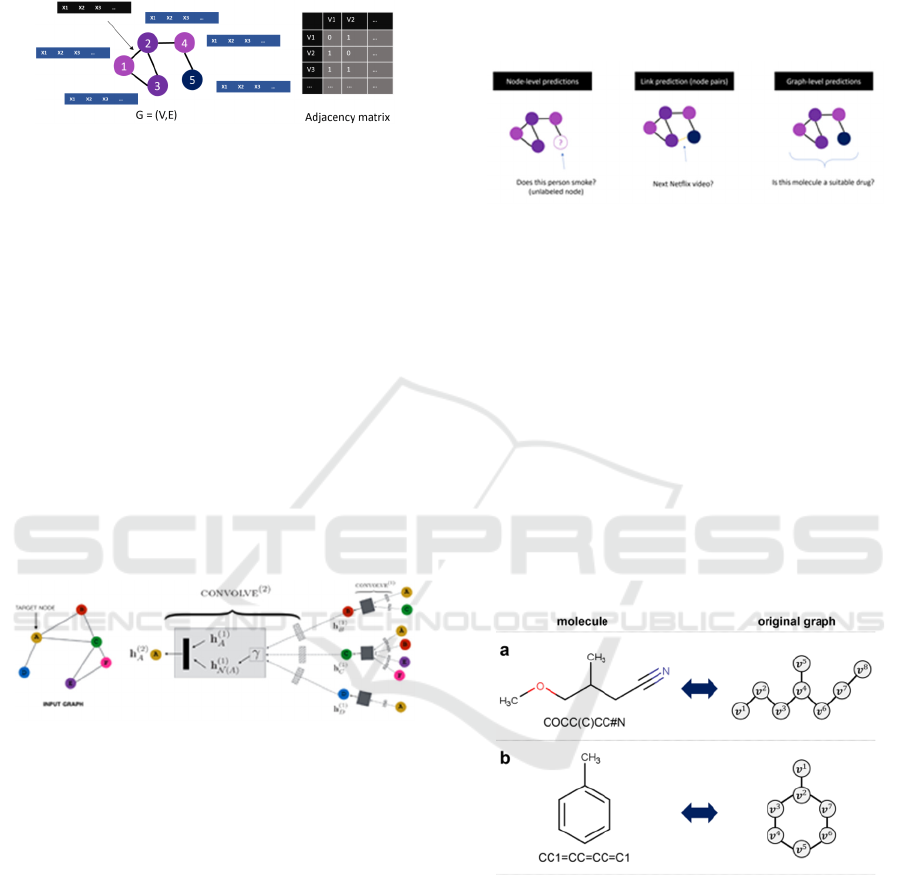
components: Vertices (or Nodes) and edges. An edge
connects two nodes as shown in Figure 1. A graph can
be represented by an adjacency matrix.
Figure 1: Graph Representation: Nodes and edges both can
have a set of features that are unique for that node or edge.
Graph neural networks (GNN) refer to the neural
network architectures that operate on graph data.
Each node has some set of features that defines it. For
example, in case of a social network these features
could be gender, age, country, friends etc. Similarly,
edges may also contain some set of features e.g.
friendship between two people, distance between two
persons’ locations etc.
The GNNs, as shown in Figure 2, work by
gathering and passing information between nodes and
its neighbours. Nodes receive information from
neighbours via edges. Data from these edges are
aggregated (using many different techniques like max
pooling, averaging etc.) and are passed to an
activation function to get new set of embeddings for
the node.
Figure 2: Working of GNN, current node embeddings h
v
are
calculated with the help if neighbouring node embeddings,
neighbouring edge features and current node features.
Every node in the initial state has features X
v
. The
embeddings for a node after message passing can be
defined as:
h
v
= f(X
v
,X
co[v]
, h
ne[v]
, X
ne[v]
)
(2)
Where,
f is a local transition function,
X
ne[v]
denotes the features of the neighbours of v,
X
co[v]
denotes the edge features connected to v,
h
ne[v]
denotes the embeddings of the neighbours of v.
In the Figure 2 above, h
a
(1)
is the initial embedding
of the node, h
N(A)
(1)
is the aggregated embeddings of
its neighbours. Combining these and passing to the
node’s activation function will provide the new
embeddings for the node A. In different steps, as
shown in Figure 3, each node gets a new set of
embeddings for itself. After various iterations or K
layers of message passing, a node learns more and
more about its neighbourhood and its distant
neighbours as well.
Figure 3: GNN-produced node level, edge level and graph
level predictions.
QSAR relations can be utilised and built upon to
extract information from structural composition of a
molecule. We could input a molecule to a simple
feed-forward recurrent neural network; the predicted
molecular properties would be as a result of the model
learning the sequential grammar of molecular
structure (SMILES strings) rather than extracting
information from structural properties of it.
A molecule itself could be viewed as a graph as
depicted in Figure 4. The atoms correspond to the
vertices and edges corresponds to the bonds between
those vertices / atoms. Vertices can contain features as
electronic configuration, formal charge, etc. Edges
may contain features like bond type, bond distance, etc.
Figure 4: Molecules represented as graphs with individual
atoms representing the nodes of the graph and bonds
representing the edges of the graph.
2 DATASETS AND
ARCHITECTURE
2.1 Datasets and Pre-Processing
Three MoleculeNet datasets have been used to train
and test the model (Wu et al., 2018).
FEAT: A Fast, Effective, and Feasible Model for Molecular Property Prediction Based on Graph Neural Network
879
a) ESOL: (1128 molecules) Water solubility for
common organic molecules (Wu et al., 2018).
b) Free Solv: (642 molecules) Experimental and
calculated hydration free energy of molecules in
water (Wu et al., 2018).
c) Lipophilicity: (4200 molecules) Octanol/water
distribution coefficient (Wu et al., 2018).
Using rdkit library molecules are pre-processed to
attach the following atomic properties to the
individual atoms in the molecule: Atomic Number,
Chirality, Degree, Formal Charge, Number of
Hydrogens, Number of Radical Electrons,
Hybridization, Aromatic or not, Atom inside the ring
or not. Bond type, stereo configuration and
conjugation were the three properties chosen as the
bond properties that the edges of the graph will hold.
2.2 Model Architecture
The model, which we call as FEAT, consists of five
message passing layers as listed in Table 1. The
number of layers itself is a hyper parameters hence
can be changed accordingly whether the data under fit
or over fit the model. The first message passing layer
has an input dimension of which refers to the 9 atomic
properties that we shortlisted for the data. These
message passing layers constitute of Graph
Convolution Network layer (Kipf and Welling, 2017)
with tanh activation function (Wang et al., 2020). The
dimensions of hidden message passing layers are
hyper-parameters too, here 64 has been chosen as the
dimension of hidden message passing layers.
A concatenation of global mean and max pooling
layer was added to aggregate the features together.
The final layer consists of a linear layer which takes
in the output of global pooling layer as input and
outputs the value of the predicted property.
The tanh activation function was chosen over
ReLu or Sigmoid due to its higher performance for
convolutional systems (Wang et al., 2020), (Wieder
et al., 2020).
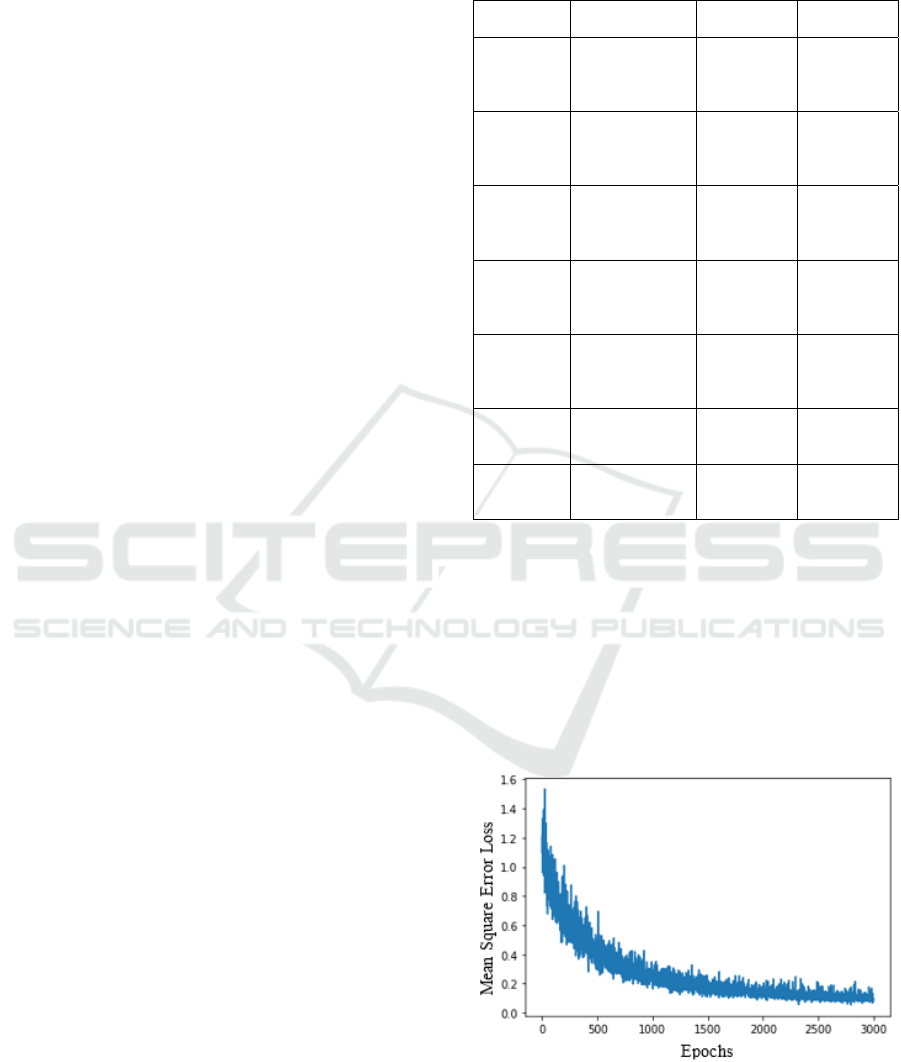
3 RESULTS AND DISCUSSION
The model FEAT was run on Dataset-1 (ESOL) and
the plot shown in Figure 5 is obtained, it contains a
graph that has been plotted between Mean Square
Error and Number of Epochs for the ESOL dataset,
we can see a steep loss in the mean squared error
value which indicated the training going in the right
direction with a good learning rate.
Table 1: GNN Model Architecture consisting of Five
Message Passing Layers, a Global Pooling Layer and Final
Linear Layer for Property Prediction.
Layer Components
Input
Dimensions
Output
Dimensions
First
Message
Passing
Graph
Convolution
with tanh
Activation
9 64
Second
Message
Passing
Graph
Convolution
with tanh
Activation
64 64
Third
Message
Passing
Graph
Convolution
with tanh
Activation
64 64
Fourth
Message
Passing
Graph
Convolution
with tanh
Activation
64 64
Fifth
Message
Passing
Graph
Convolution
with tanh
Activation
64 64
Global
Pooling
Global Mean
and Max
Pooling
64 128
Linear
Layer
Linear
Regression
Laye
r
128 1
To evaluate the predictions, 128 data points (1
batch) from the test dataset (20% of the whole
dataset) were plotted against the actual
experimentally determined values. The Figure 6
presents the graph between the experimentally
determined solubility values vs the solubility values
predicted by the model. The line y = x has been added
to visualize the accuracy of the predicted property
values by FEAT as compared to experimentally
determined values.
Figure 5: MSE vs Epoch for ESOL dataset, good descent
for loss observed for the MSE function as epochs increase.
ICAART 2024 - 16th International Conference on Agents and Artificial Intelligence
880
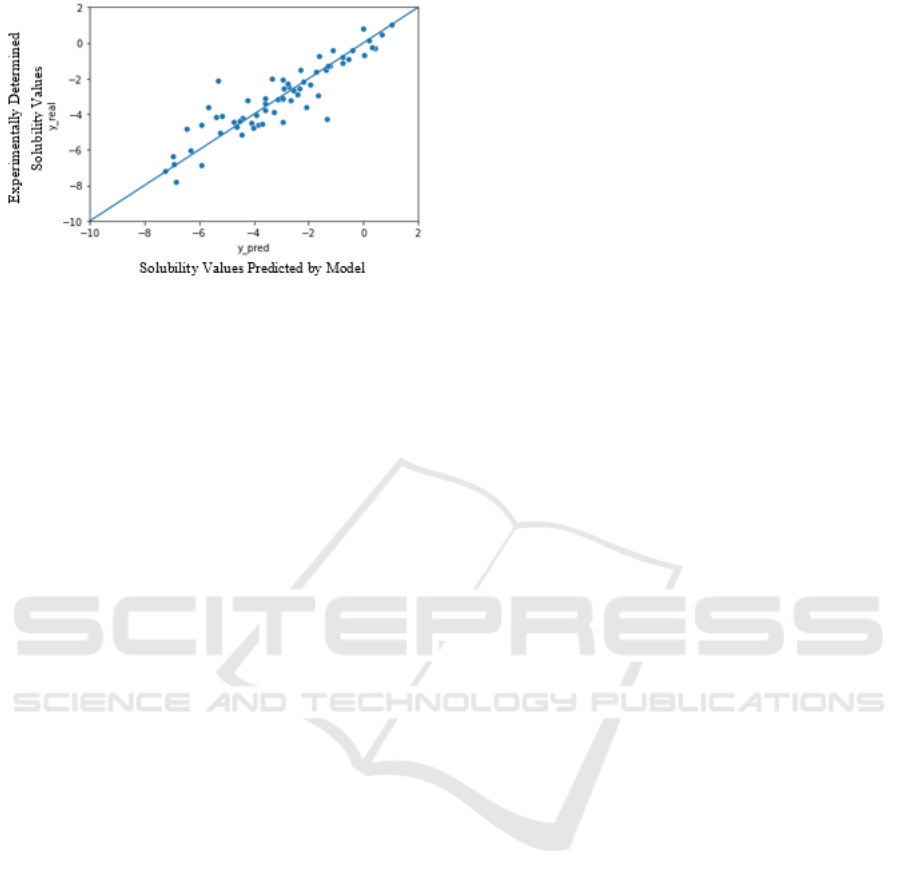
Figure 6: Experimentally determined solubility values
plotted against solubility values predicted by model.
Similar graphs were obtained for model run on
Dataset-2 (Free Solv) and Dataset-3 (Lipophilicity).
In both the cases, the model FEAT seems to underfit
the data. Nevertheless, various hyper-parameters can
be tweaked and experimented with to generate more
accurate results.
4 CONCLUSIONS AND SCOPE
FOR FUTURE RESEARCH
It is known that physiological properties of the
chemicals can be related to structural properties of the
chemicals by some functions as we call these
relations as QSAR relations. QSAR relations are not
usually linear in nature, they might be very complex
in higher order polynomials, hence we try to take help
of artificial neural networks in achieving this task. As
molecules can be views as graphs present in nature,
the bonds correspond to the edges and atoms
correspond to the nodes in the graph. It makes sense
to use Graph Neural Network to extract structural
information from the molecular graphs and use this
information to predict various properties from it.
The graph neural network based model FEAT was
designed by having five linear layers of Graph
Convolutional Network Layers with a catenated
Global Mean and Max pooling layer with a final
linear layer to predict the property. The presented
model FEAT gave nearly accurate results. In addition,
it promises to be a fast and feasible means to predict
molecular properties in comparison to conventional
methods based off manual experimentation by
chemists. Considering the present state of this
research, it definitely cannot be taken as an alternative
to conventional experimentation; however, it could
potentially serve as a means for the required
predictions in environments or situations that are
resource- and time-constrained. As a scope for future
research in this relatively less researched domain, the
model can be further improved by adding more
message passing layers, experimenting with different
learning rates, changing atomic properties chosen for
atoms, etc.
REFERENCES
Dearden, J.C. (2003). Quantitative structure-property
relationships for prediction of boiling point, vapor
pressure, and melting point. Environmental Toxicology
and Chemistry, vol. 22, no. 8, pp. 1696–1709. Wiley-
Blackwell.
Kipf, T.N., Welling, M. (2017). Semi-Supervised
Classification with Graph Convolutional Networks. In
Proceedings of the 2017 International Conference on
Learning Representations, pp. 1–14. ICLR.
Wang, Y., Li, Y., Song, Y., Rong, X. (2020). The Influence
of the Activation Function in a Convolution Neural
Network Model of Facial Expression Recognition.
Applied Sciences, vol. 10, no. 5, pp. 1897. MDPI.
Wieder, O., Kohlbacher, S., Kuenemann, M., Garon, A.,
Ducrot, P., Seidel, T., Langer, T. (2020). A compact
review of molecular property prediction with graph
neural networks. Drug Discovery Today: Technologies,
vol. 37, pp. 1-12. Elsevier.
Wu, Z., Ramsundar, B., Feinberg, E.N., Gomes, J.
Geniesse, C., Pappu, A.S., Leswing, K., Pande, V.
(2018). MoleculeNet: A Benchmark for Molecular
Machine Learning. Chemical Science, vol. 9, pp. 513–
530. Royal Society of Chemistry.
FEAT: A Fast, Effective, and Feasible Model for Molecular Property Prediction Based on Graph Neural Network
881
