
World-Map Misalignment Detection for Visual Navigation Systems
Rosario Forte
1,∗
, Michele Mazzamuto
1,2,∗
, Francesco Ragusa
1,2
,
Giovanni Maria Farinella
1,2
and Antonino Furnari
1,2
1
FPV@IPLAB, DMI - University of Catania, Italy
2
Next Vision s.r.l. - Spinoff of the University of Catania, Italy
{francesco.ragusa, giovanni.farinella, antonino.furnari}@unict.it
Keywords:
Egocentric Vision, Computer Vision, Synthetic Data, Acquisition Tool.
Abstract:
We consider the problem of inferring when the internal map of an indoor navigation system is misaligned
with respect to the real world (world-map misalignment), which can lead to misleading directions given to
the user. We note that world-map misalignment can be predicted from an RGB image of the environment and
the floor segmentation mask obtained from the internal map of the navigation system. Since collecting and
labelling large amounts of real data is expensive, we developed a tool to simulate human navigation, which
is used to generate automatically labelled synthetic data from 3D models of environments. Thanks to this
tool, we generate a dataset considering 15 different environments, which is complemented by a small set of
videos acquired in a real-world scenario and manually labelled for validation purposes. We hence benchmark
an approach based on different ResNet18 configurations and compare their results on both synthetic and real
images. We achieved an F1 score of 92.37% in the synthetic domain and 75.42% on the proposed real dataset
using our best approach. While the results are promising, we also note that the proposed problem is challeng-
ing, due to the domain shift between synthetic and real data, and the difficulty in acquiring real data. The
dataset and the developed tool are publicly available to encourage research on the topic at the following URL:
https://github.com/fpv-iplab/WMM-detection-for-visual-navigation-systems.
1 INTRODUCTION
Navigation systems, like Google Maps Indoor Navi-
gation
1
, Waze
2
, MapsPeople
3
and HERE WeGo
4
, are
very popular nowadays. These services aim to fa-
cilitate navigation, helping humans orient themself
in outdoor (e.g., cities, parks, geographical areas)
and indoor (e.g., museums, airports, malls, industrial
sites) environments. While outdoor systems can rely
on the continuous localization provided by GPS, in-
door navigation can be tackled by leveraging localiza-
tion mechanisms based on radio signals, such as WiFi
or Bluetooth beacons (Jeon et al., 2018), image-based
techniques (Dong et al., 2019), or a combination of
both (Ishihara et al., 2017), since GPS lacks in preci-
sion and signal in indoor spaces. Indoor localisation
∗
Co-First Authors
1
https://www.google.com/maps/about/partners/
indoormaps/
2
https://www.waze.com/it/live-map/
3
https://www.mapspeople.com/
4
https://wego.here.com/
is the process of obtaining the position of a device
in an indoor environment. A navigator exploiting a
mobile device requires a localisation as first step, and
then the search for the appropriate route to suggest
how to reach a point of interest. Through the entire
navigation, the re-localisation of the device must be
accurate.
Image-based navigation systems, in particular,
achieve precise visual localization by combining a
computationally intensive feature-based localization
system with a lightweight pose tracker based on
SLAM (Simultaneous Localization And Mapping).
This approach is suitable for the processing power of
mobile devices as well (Middelberg et al., 2014). In
this scenario, the performance of the navigation sys-
tem is tied to the reliability of the local pose tracker,
which may accumulate drift or fail, especially when
lighting conditions and environment features are sub-
optimal or when the hardware has limited compu-
tation abilities. These characteristics make the sys-
tem more susceptible to a misalignment of the in-
ternal navigation map with respect to the real envi-
324
Forte, R., Mazzamuto, M., Ragusa, F., Farinella, G. and Furnari, A.
World-Map Misalignment Detection for Visual Navigation Systems.
DOI: 10.5220/0012410400003660
Paper published under CC license (CC BY-NC-ND 4.0)
In Proceedings of the 19th International Joint Conference on Computer Vision, Imaging and Computer Graphics Theory and Applications (VISIGRAPP 2024) - Volume 4: VISAPP, pages
324-332
ISBN: 978-989-758-679-8; ISSN: 2184-4321
Proceedings Copyright © 2024 by SCITEPRESS – Science and Technology Publications, Lda.

(a) (b)
Figure 1: (a) An example of correct (left) navigation in-
structions and misleading instructions (right) due to the mis-
alignment of the internal navigation map with respect to the
real environment. (b) The floor segmentation map accord-
ing to the internal representation of the navigation system
in the two cases. As can be seen, the misalignment between
the floor segmentation and the RGB image is an informative
signal for world-map misalignment detection.
ronment (referred to as “world-map misalignment” in
this work), hence leading to misleading navigation in-
structions as shown in Figure 1 a.
A naive solution to this problem involves running
the localization algorithm frequently, consequently
slowing down the speed of the navigation system
due to the computational demands of the localiza-
tion algorithm. Another option is to employ an “on-
demand” localization system, which is activated only
when the system recognizes that the current localiza-
tion is inaccurate or the internal map of the naviga-
tion system is misaligned with respect to the environ-
ment. The described approach requires a module able
to detect world-map misalignment and trigger the lo-
calization system. We argue that this problem can be
addressed through computer vision techniques com-
paring the input RGB image with the floor segmenta-
tion map used by the navigation system based on its
internal 3D map, as illustrated in Figure 1 b.
To study the problem and the effectiveness of the
proposed approach, we provide a novel dataset based
on 15 synthetic environments, generated using a new
proposed tool. The 3D models were obtained by scan-
ning real environments using Matterport3D
5
or utiliz-
ing prefabricated of 3D models available on the offi-
cial Matterport3D website.
These virtual environments were used to gener-
ate synthetic data simulating agent navigation. Dur-
ing the data generation process, the localization of
the navigation system was perturbed with different
amounts of noise to obtain misaligned examples.
Generated images also contain light changes and dif-
ferent degrees of agent speed and movement. A
smaller set of real data is also collected and labelled
in a real environment for evaluation purposes. We
5
https://matterport.com/
provide different baselines based on ResNet18 (He
et al., 2015), resulting in an F1 score of 92.37% in
the synthetic domain and 75.42% on the proposed real
dataset. Based on the obtained results, it is evident
that training a system to identify the world-map mis-
alignment is possible but presents some challenges,
mostly due to a domain gap between virtual and real
environments.
The main contributions of this paper are as fol-
lows: 1) We present a novel generation tool for in-
door human navigation data, able to generate high-
resolution frames, with an automatic labelling sys-
tem and environment randomization; 2) We present
a dataset consisting of RGB images and floor seg-
mentation masks captured during indoor navigation
simulations. Navigation paths are generated in fifteen
distinct virtual environments. Each “aligned” path is
paired with a “misaligned” counterpart. The dataset
is augmented with a test set composed by real im-
ages for evaluation. 3) We propose an approach to
world-map misalignment detection and highlight the
challenges involved in the proposed task.
The remainder of the paper is organized as fol-
lows. In Section 2, we discuss related work. Sec-
tion 3 reports the acquisition tool and proposed
dataset. Section 4 presents the considered ap-
proaches, providing different baselines. Section 5
concludes the paper and summarises the main accom-
plishments of our study. Our data and the developed
tool are available at https://github.com/fpv-iplab/
WMM-detection-for-visual-navigation-systems.
2 RELATED WORK
2.1 Indoor Navigation Systems
Indoor navigation systems aim to guide the user inside
an indoor environment providing instructions with a
smartphone or wearable devices. Since the GPS sig-
nal is not available indoors, these systems generally
base their localization module on image-based tech-
niques. The authors of (Zheng et al., 2014) present
Travi-Navi, a vision-guided navigation system for in-
door navigation. The system relies on a set of im-
ages and data previously acquired by a guide to cre-
ate a navigation path, providing prompts to the user
for guidance. The authors of (Chen et al., 2014)
explored WiFi-Based and Pedestrian Dead Reckon-
ing (PDR) systems to achieve indoor navigation, in-
troducing a maximum likelihood-based fusion algo-
rithm that combines these systems to improve accu-
racy without user intervention. The authors of (Dong
et al., 2019) introduced a smartphone-based indoor
World-Map Misalignment Detection for Visual Navigation Systems
325

navigation system. Utilizing visual and inertial sen-
sors, it reconstructs 3D indoor models, calibrates user
trajectories, and achieves accurate localization in real-
world environments.
A line of works considered the problem of design-
ing navigation systems for visually impaired persons.
The authors of (Manlises et al., 2016) introduced a
navigation system using a Bluetooth headset, employ-
ing Continuously Adaptive Mean-Shift (CAMShift)
to track obstacles to avoid and the D* algorithm to de-
termine optimal paths. The authors of (Zhang et al.,
2016) present an intelligent wheelchair combining
brain-computer interfaces with automated navigation,
reducing user burden and adapting to environmental
changes.
The aforementioned works proposed localization
and a wayfinding system to support navigation in in-
door environments. In those works, the drift of the
system with respect to the real world was used as a
metric to evaluate navigation accuracy. In this work,
we propose to actively detect world-map misalign-
ment to anticipate inaccurate navigation scenarios.
Once the misalignment is detected, the system can
take the appropriate actions preventing the display of
misleading navigation directions or running a compu-
tationally expensive re-localization routine to recover
the world-map alignment.
2.2 Indoor Localization
Localization methods play a crucial role in naviga-
tion systems. In indoor scenarios, GPS localization is
often unavailable due to signal blockage by construc-
tion materials in the ceiling. For this reason, various
strategies have been developed to support indoor lo-
calization. The authors of (Kunhoth et al., 2020) pro-
vided an overview of these strategies, which include
computer vision approaches and radio frequency lo-
calization.
In traditional computer vision approaches, RGB
or RGB-D cameras are used to extract informa-
tion from the surrounding environment and match it
against a database of localized images of the envi-
ronment. In the most common localization pipelines,
local features such as SIFT or SuperPoint (DeTone
et al., 2018) are extracted from the images. Good
performance has been achieved through deep learning
techniques, utilizing representations obtained from
the network to match new images with a pre-saved
database (Orlando et al., 2019).
Other methods are based on a representation of the
environment using point clouds. In these approaches,
the position of the agent is obtained by matching the
local point clouds of the scene against a previously ac-
quired global point cloud of the environment through
Point Cloud Registration (PCR) algorithms (Huang
et al., 2021).
A different line of research on localization is
based on the use of Wireless technologies (Kunhoth
et al., 2020). Alternative approaches include Bea-
cons technology (Jeon et al., 2018) and UWB (Ultra-
wideband) (Mikhaylov et al., 2016).
It is worth noting that image-based localization
solutions are convenient as they do not require any
specific infrastructure and are accurate, but they tend
to be computationally expensive. In this paper, we
propose to minimize the number of times a navigation
system relies on such procedures by actively detecting
the misalignment between the internal localization of
the navigation agent and the real environment.
2.3 Synthetic Data Generation
The use of synthetic data to train machine learning
models has become increasingly popular, particularly
for time-consuming tasks such as the ones requiring
semantic segmentation (Saleh et al., 2018). With a
synthetic data generation pipeline, it is possible to ob-
tain a large amount of data with minimal cost and time
investment. Since the data is generated from a 3D
model, the labels can be easily obtained in simulation
using automated methods. The data generation tech-
nique also allows the obtainment of a controlled setup
in which the variability in the data is decided a priori.
Synthetic data acquisition via specially built applica-
tions, like simulators, has been widely used in differ-
ent computer vision studies, for instance in egocen-
tric vision (Leonardi et al., 2022; Quattrocchi et al.,
2022), crowd counting (Wu et al., 2022), human pose
estimation (Ebadi et al., 2022), and localization (An-
drea Orlando et al., 2020).
Addressing the gap between real and synthetic
data is a significant challenge in data genera-
tion (Sankaranarayanan et al., 2018). Models often
learn representations in the virtual domain that are
hard to generalize to real-world scenarios (Lee et al.,
2022). To smooth out the differences and learn a bet-
ter representation, different approaches have been ex-
plored. Domain Randomization (Tobin et al., 2017)
techniques are applied as a way to reduce the net-
work bias induced by repetitive synthetic data. Ran-
domizations such as light changes, texture and colour
changes, and random camera rotation have proven ef-
fective in guiding models into learning robust features
related to the task, reducing the domain gap (Frid-
Adar et al., 2018).
Following previous literature, we use synthetic
data to tackle the proposed word-map misalignment
VISAPP 2024 - 19th International Conference on Computer Vision Theory and Applications
326
1
2 3
4
5 6
7
8
9 10 11
12
13 14 15
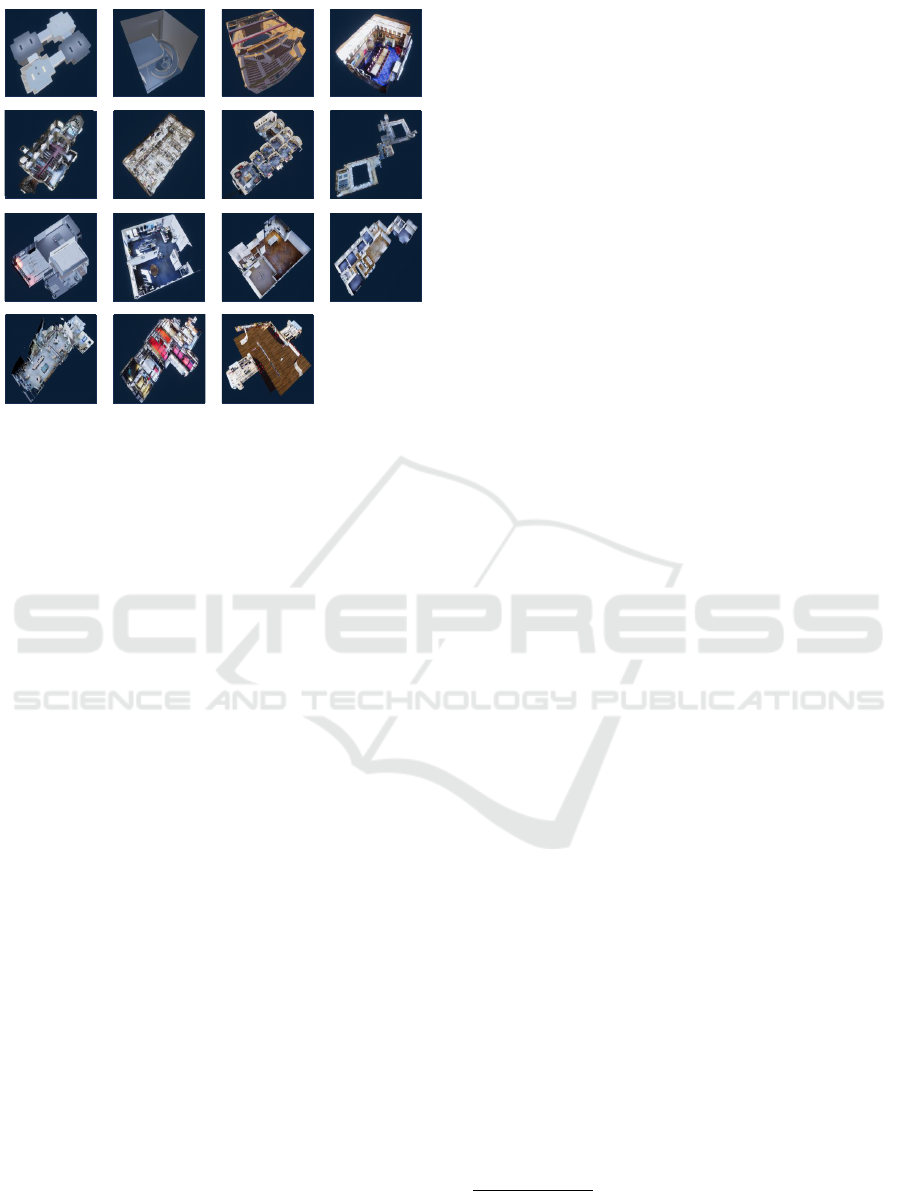
Figure 2: The 15 selected 3D models used to generate the
synthetic data.
detection task. To make the acquired frames more
similar to real ones we utilize a high definition ren-
der pipeline (HDRP). We also introduce several vari-
ations of lightning, agent height and speed, navigation
path of the agent, and simulate ambulatory walking.
3 DATA GENERATION
In this section, we present our dataset, composed of
a large set of synthetic images and a small set of real
ones. This dataset is designed to be representative of
the challenges of human navigation in an indoor envi-
ronment from a First Person View (FPV) perspective.
To create our synthetic dataset, we selected 15 envi-
ronments (Figure 2), 2 acquired by us through Matter-
port hardware, and the remaining 13 selected down-
loaded from online websites. Our selection aimed to
cover a wide range of indoor scenarios, to obtain a
range of buildings with different characteristics, and
consequently, different navigation scenarios.
3.1 Acquisition Tool
We built our acquisition tool on top of Unity, which
provides a wide range of plugins and high rendering
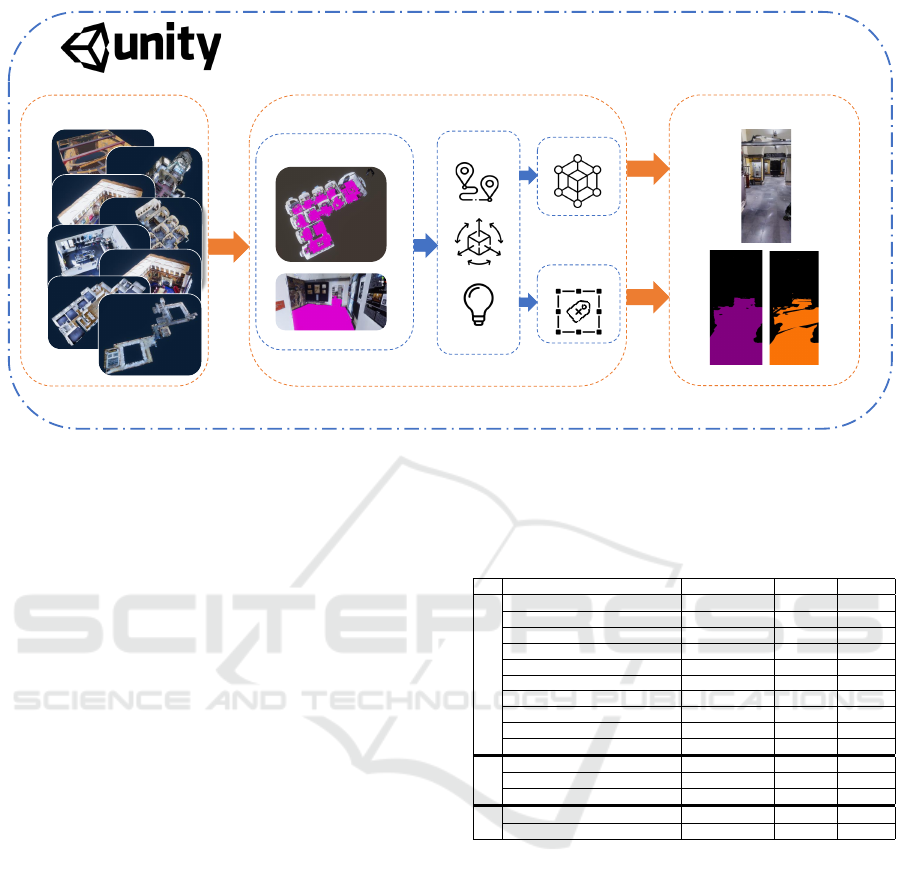
speed. The tool is depicted in Figure 3. The data
generation process involves environment importing,
walkable surface processing, randomization, and ac-
quisition. Further details are provided in the follow-
ing section. The tool relies on Perception (Borkman
et al., 2021), a toolkit primarily used for generating
synthetic data with different modalities and annota-
tions (segmentation masks, depth, normals, etc.). We
used the high-definition render pipeline
6
to make the
acquisition photorealistic (Figure 3 b).
For each imported 3D environment model, the
navigation surface is automatically computed using
Unity’s “AI.Navigation” libraries
7
. The computed
navigation surface defines the walkable area within
the environment (i.e., the area in which the agent can
navigate), which we refined to exclusively include the
floor, excluding any potential surfaces such as tables
or large furniture. Once the navigable surface has
been calculated, we determine a navigation path by
sampling a random source and a random destination
point on the walkable surface, after which the agent
navigation is initiated. The process is iterated until an
adequate number of frames, proportional to the size of
the environment, have been acquired. For each nav-
igation, we randomized the environment lights, the
agent height, and its speed. This approach allows
for the comprehensive exploration of the entire envi-
ronment, minimizing redundancy in data acquisition.
Additionally, to further reduce the domain gap be-
tween synthetic and real data, the agent navigates by
simulating human ambulatory walking and adjusting
its viewpoint as a human would naturally do (Figure
3 b).
During the navigation process, we captured
frames at a fixed sampling rate. The number of frames
acquired for each environment was based on its size,
categorizing them as small, medium, or large. For
each instance, we stored an RGB frame, with a pair
of floor segmentation masks. The first mask of the
pair is marked as “aligned (correct)”. In this frame,
the floor segmentation aligns precisely with the ac-
tual floor. The second mask of the pair is labelled
as “misaligned (wrong)”. In this case, we generate
a misaligned floor segmentation by intentionally per-
turbing the position and rotation of the 3D model to
simulate world-map misalignment. The perturbation
is obtained by adding Gaussian noise to the position
and rotation of the floor surface. To obtain exam-
ples of different difficulties, we employed three dis-
tinct types of Gaussian distributions, each represent-
ing the degrees of misalignment between the mask
and the floor: easy (indicating significant misalign-
ment), medium (reflecting moderate misalignment),
and hard (denoting minor misalignment). Respec-
tively, we use Gaussian distributions with means of
0.5, 0.15, and 0.055, and standard deviations of 0.1,
0.05, and 0.022. These values were intentionally cho-
sen to ensure that the perturbations obtained are suit-
6
https://unity.com/srp/High-Definition-Render-Pipeline
7
https://docs.unity3d.com/Packages/com.unity.ai.
navigation@2.0
World-Map Misalignment Detection for Visual Navigation Systems
327
Environments import
Walkable surface
Simulation
HDRP
Perception
Data Generation Module
Synthetic Data
1
2
3
Navigation
Camera Movement
Environmental light
a)
b)
c)
Figure 3: The workflow of the proposed tool. a) 3D models are imported into the tool. b) The Data Generation Tool
automatically computes the walkable surface and initiates the simulation. c) Throughout the simulation, high-definition RGB
frames and masks are captured using HDRP and the perception package, as shown in the following: c1) An example of an
RGB image; c2) Aligned floor segmentation; c3) Misaligned floor segmentation.
able for creating a shift in meters. For each instance,
we saved both the RGB frame and the two segmenta-
tion masks separately (Figure 3 c).
3.2 Dataset
3.2.1 Synthetic Data
The proposed synthetic dataset is composed of
70,000 (frame, floor segmentation mask) pairs, in-
cluding 35,000 aligned examples, and 35,000 mis-
aligned ones. These frames have been extracted from
navigation episodes simulated in different virtual en-
vironments. Each of the misaligned examples is clas-
sified according to the degree of perturbation we ap-
plied to the orientation and position of the 3D model
during generation as described in Section 3.1. In to-
tal, we collected 13, 000 examples for the hard class,
12,000 for the medium class, and 10,000 for the easy
class.
For the data generation, we have chosen 15 3D
environments, each serving as a representative ex-
ample of different building types, as detailed in Ta-
ble 1. These different environments have enabled us
to cover a broad spectrum of navigation scenarios, in-
cluding theatres, retailers, houses, churches, and in-
dustrial settings. The proposed dataset was split into
training, validation, and test sets. Table 1 provides de-
tails on the distributions of data across these subsets.
Each specific environment is exclusively allocated to
either the training, validation, or test subset to avoid
Table 1: Dataset environment description and splitting.
Name Category Size Frames
Training
Loft House Small 1872
Dive Shop Retailer Small 2000
Two-room Apartment House Small 2000
Lincoln’s Inn Drawing Room Museum Small 2000
Theatre Theatre Small 2376
Modern House House Medium 4000
Vr Store Retailer Medium 5286
Back Rooms House Big 7000
Japan House House Big 7000
Church Of St Peter Stourton Church Big 7500
Val
Industry Industrial site Small 2672
Family Apartment House Medium 6000
Set Of Offices Offices Medium 6000
Test
Mirabilia Museum Big 7000
University University Big 10000
overfitting. The allocation of each environment to its
respective subset is category-based, and the split was
designed to ensure that the training set contains en-
vironments with characteristics similar to the ones in
the validation and test sets.
3.2.2 Real Data
To test the generalization of our algorithms to real-
world data, we also acquired and labelled 5 videos in a
real environment which matches the “University” 3D
model considered for data generation. The acquired
data comprises RGB images with the floor segmen-
tation mask already associated. In total, we obtained
8000 frames. The data was collected, during naviga-
tions, by capturing an image every 0.033 seconds us-
ing a custom-made navigation application on a smart-
phone. We intentionally introduced misalignment by
VISAPP 2024 - 19th International Conference on Computer Vision Theory and Applications
328

temporarily obstructing the camera and later resum-
ing the navigation.
4 EXPERIMENTS
In this section, we report experiments on the proposed
dataset. To evaluate our settings, we used the follow-
ing metrics: Accuracy, Precision, Recall, F1 score,
and the Area Under the ROC Curve (AUC). The ROC
curve is calculated by varying the decision threshold
and measuring the true positive rate against the false
positive rate.
4.1 Approach
We model the problem of misalignment detection as
the process of detecting when a floor segmentation
mask (representing a walkable area for a navigation
app) aligns with the observed RGB scene. We assume
that, besides the input RGB image, a floor segmen-
tation mask inferred by the navigation system based
on its internal map is available for processing. We
hence posit our detection problem as a binary clas-
sification task which takes as input an (RGB image,
binary segmentation mask) pair. We expect the mask
not to be coherent with the RGB image when the in-
ternal map of the navigation system is not aligned to
the real world, as previously illustrated in Figure 1.
We train CNN-based models to solve the binary
classification problem on our synthetic dataset. Mod-
els are tested on both the synthetic data and the real
one to assess performance both in an in-domain sce-
nario (models trained and tested on synthetic data)
and in an out-of-domain scenario (models trained on
synthetic data, but tested on real data). We also report
the results of our method when temporal smoothing is
considered to improve predictions on real test videos.
We employed different configurations of a pre-
trained ResNet18 on ImageNet (Deng et al., 2009).
Specifically, we experimented with two approaches:
blending the segmentation mask on top of the RGB
frame as input for our network, so a 3-channel in-
put (referred to as “Blended Mask”), and stacking the
mask on the RGB image by adding an extra channel,
a 4-channel input (referred to as “Mask Channel”).
While analyzing frame-wise predictions in the ac-
quired videos, we identified isolated false positives
attributed to imperfections in the virtual floor or mi-
nor misalignments caused by human movement. To
address this issue, we utilized the output from our
best-performing neural network, computed frame by
frame, with a temporal sliding window. The purpose
of this window was to classify the current state of the
Table 2: Cross-domain result on synthetic data. Best results
per-column are highlighted in bold. Results are reported in
percentage.
Input Modality Normalization Accuracy F1 Precision Recall
Blended Mask ✗ 92.17 92.37 89.74 92.17
Blended Mask ✓ 91.94 92.14 89.43 91.94
Mask Channel ✗ 91.16 91.50 87.48 91.16
Mask Channel ✓ 87.11 88.06 81.53 87.11
system, effectively mitigating potential misbehavior
and suppressing isolated false positives.
4.2 Experimental Settings
We trained each model for 6k iterations using a learn-
ing rate of 0.01 and a batch size of 64 on an Ubuntu
server equipped with 2 CPU Intel(R) Xeon(R) E5-
2620 v3 @ 2.40GHz, 32GB RAM Memory, 1 Nvidia
Tesla K80 GPU.
The synthetic dataset was acquired using a lap-
top equipped with 1 CPU Intel(R) Core(TM) i9-
10980HK @ 3.1GHz, 32GB RAM Memory, 1
NVIDIA GeForce RTX 2070 Super GPU.
Real navigation videos were acquired using a
smartphone Google Pixel 6a, with a resolution of
1080 × 2400 and a frame rate of 30.
4.3 Results
We conducted three different types of experiments.
In the first scenario, we performed tests in a cross-
domain virtual setting, using data from environments
that were never seen during training. In the second
scenario, we considered the “University” target en-
vironment, for which both synthetic data and real-
world videos are available. In this case, we carried
out training on the synthetic training set, followed by
fine-tuning using synthetic data specific to the target
“University” environment (not included in the train-
ing set) and testing on real frames. In the third sce-
nario, we tested the model on real-world videos to as-
sess its ability to generalize across the transition from
the virtual to the real world.
4.3.1 Scenario 1: Cross Domain Setting with
Synthetic Data
These experiments aim to assess the ability of the sys-
tem to generalize to never-seen virtual environments.
Networks were trained on the synthetic training set
previously described and tested on the synthetic test
set. In the proposed experiments, we used both nor-
malized (ImageNet standard) and unnormalized in-
puts. Table 2 summarizes the results. As can be noted,
we obtain best results (92.17% accuracy and 92.37%
F1 score - first row) when passing the RGB image
World-Map Misalignment Detection for Visual Navigation Systems
329
(b) Aligned
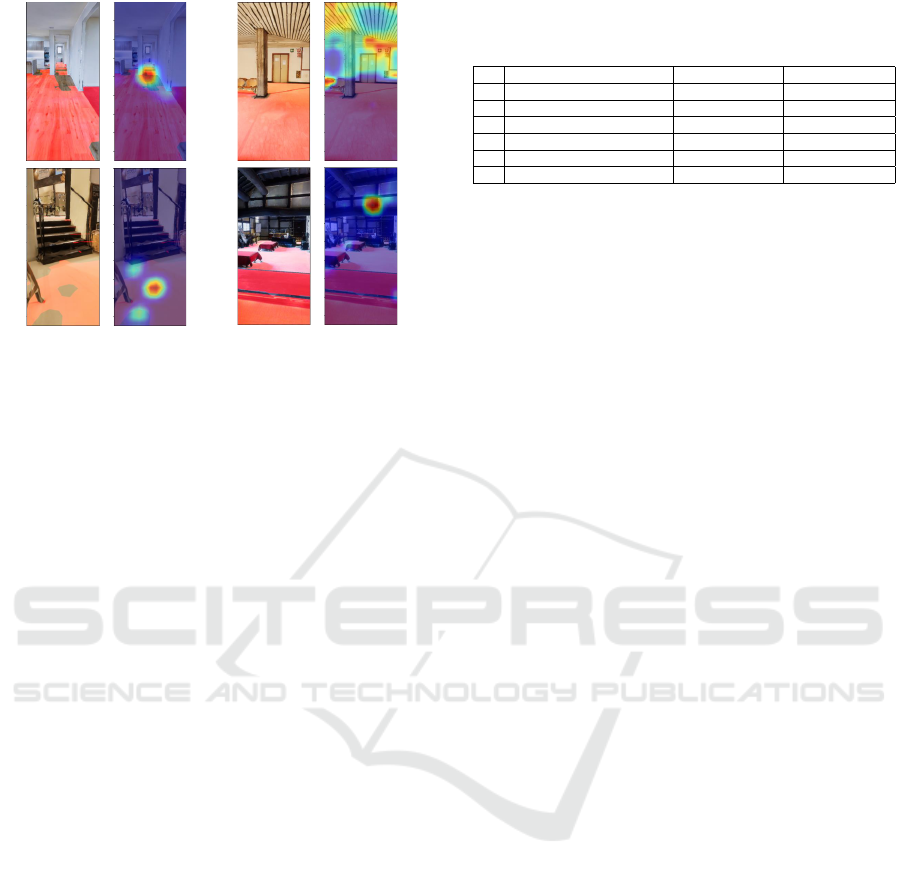
(a) Misaligned
Figure 4: GradCAM visualizations for (a) a “misaligned”
example and (b) an “aligned” examples. As can be noted,
the model focuses on inconsistencies between the floor seg-
mentation and the RGB image (a) or on various structural
elements when no inconsistency is found (b).
blended with the floor segmentation mask as input and
avoiding data normalization. Results are marginally
worse when data normalization is considered (second
row) and when the mask is passed as a separate chan-
nel (rows 3-4). We speculate that, since blending the
mask with the image or adding a separate channel
changes the distribution of the input data, applying the
data normalization using standard parameters derived
from the pre-trained models is detrimental to perfor-
mance in these settings. In detail, we obtained an ac-
curacy of 92.83% on hard examples, 94.91% on the
medium, and 98.77% on the easy ones. We consider
the “Blended Mask” configurations for the rest of the
experiments.
Figure 4 reports GradCAM visualizations (Sel-
varaju et al., 2019) for two test examples.
As can be noted, when misaligned examples are
correctly detected, the model focuses on the inconsis-
tencies between the floor segmentation and the RGB
image, such as the gap in the top-left image. Models
focus on different elements of the scene when there is
no inconsistency between the floor segmentation and
the RGB image as depicted in the top-right image.
4.3.2 Scenario 2: Inference on “University” Real
Frames
This set of experiments aims to evaluate the ability
of the model to generalize to real frames. Starting
from the best performing models discussed in the pre-
vious section, we applied various fine-tuning config-
urations on the “University” virtual environment and
then evaluated the network on the proposed real test
set. Initially, we evaluated our networks without any
Table 3: F1 (%) on the real-world test frames with different
finetuning setups. Best results per-column are highlighted
in bold.
ID Configuration Normalization ✗ Normalization ✓
1 No Finetuning 40.11 40.39
2 Last Layer 35.23 21.22
3 All Layers 38.52 38.27
4 3 + Augmentation 49.80 43.78
5 3+4+Hard examples 74.30 72.95
6 3+4+5+ Medium examples 61.31 58.05
fine-tuning. Following this, we conducted fine-tuning
experiments, in which we either froze all layers ex-
cept the last one or left them unfrozen. We also in-
troduced data augmentations using heavy transforms
like Gaussian blur, colour jitter and contrast stretching
to reduce overfitting and achieve a more robust rep-
resentation. We experimented with including “hard”
misalignment examples in the negative (“aligned”)
class for training as a way to relax the prediction con-
straints. Additionally, “medium” examples were in-
cluded in the “aligned” class. Table 3 reports the re-
sults of these experiments.
From the table, we note that finetuning to syn-
thetic data, that represents the real scenario, is not
enough to improve results both (compare experiment
1 with 2). Finetuning the full network, incorporat-
ing augmentations, enhances the model’s robustness,
and prevents overfitting to a single scenario (com-
pare 3 to 4). Including hard examples in the nega-
tive class (row 5) consents to improve results by ig-
noring small misalignments. Conversely, introducing
“medium” examples in the negative class leads to the
opposite result (row 6). We achieved an F1 score of
74.30% by training the entire network, adding aug-
mentations, and treating “hard” examples as aligned,
using an unnormalized input. This configuration en-
ables our network to learn a robust representation of
the input through extensive augmentations and to rec-
ognize that minor misalignments can be ignored.
4.3.3 Scenario 3: Inference on “University” Real
Videos
This set of experiments aims to assess the results of
the model in a real-world scenario in which a whole
video is passed as input. We used the previously de-
scribed temporal approach to mitigate isolated predic-
tion errors, introducing a delay in the predictions as
the window size increases. Table 4 compares the re-
sults when no smoothing is considered (first row) and
when different filters (mean and median) and different
sliding window sizes (ranging from 17 to 121 frames)
are considered. As can be seen, initially, F1 score and
AUC increase according to the window size, but at
a certain point, increasing the window size is detri-
mental to detection performances. We obtained an F1
VISAPP 2024 - 19th International Conference on Computer Vision Theory and Applications
330
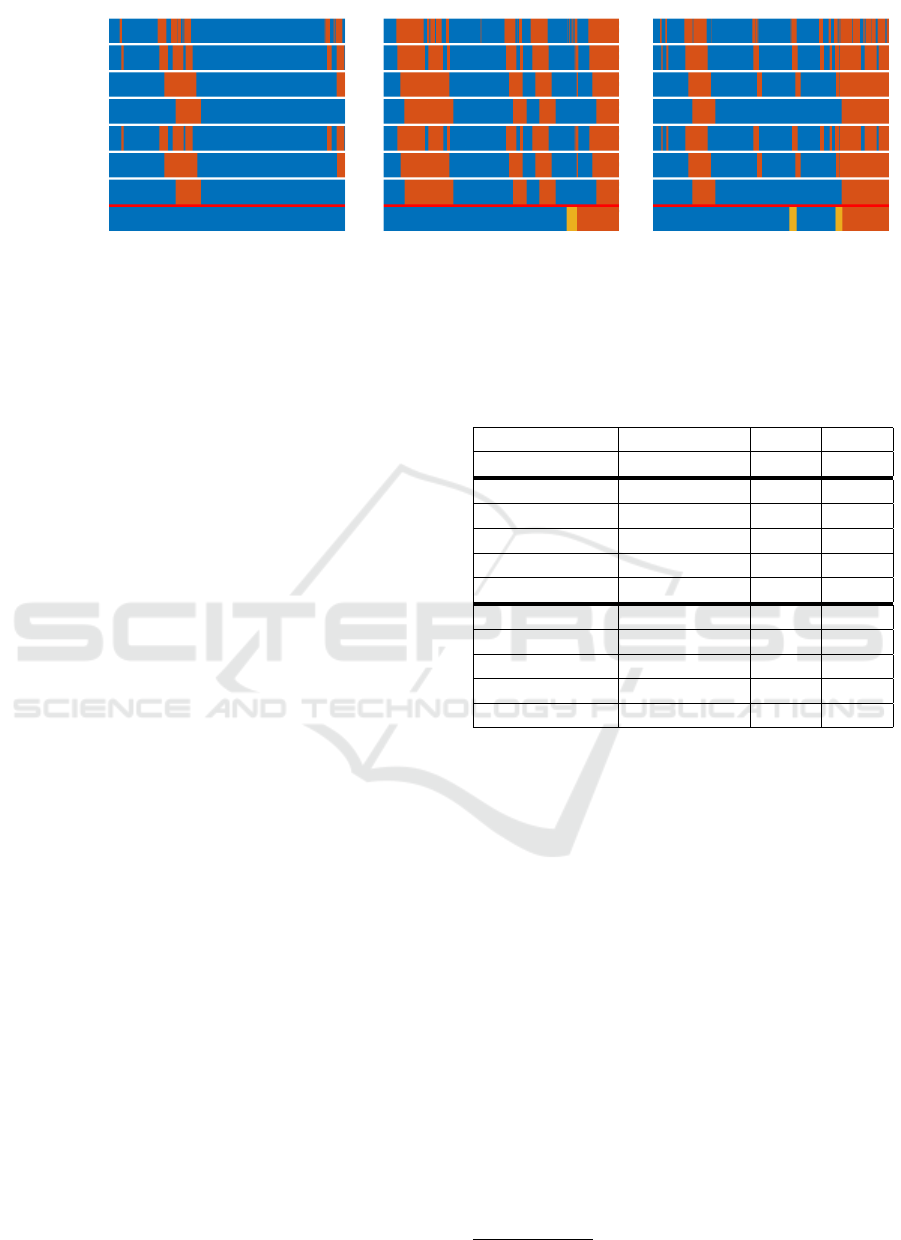
No Smoothing
Median 17 frames
Median 61 frames
Median 121 frames
Mean 17 frames
Mean 61 frames
Mean 121 frames
Groundtruth
(a) (b) (c)
Figure 5: Qualitative results on three different real videos. The aligned frames are depicted in blue, while the misaligned ones
are in orange. Yellow frames represent the unknown class, instances where no floor segmentation is present in the image.
score of 75.42% from the mean and median filter with
a window size of 31, and an AUC of 82.90% using a
median filter with a window size of 61. We also pro-
vide qualitative examples in Figure 5, showing that as
the window size increases, many of the isolated mis-
predictions are eliminated. These videos were cate-
gorized with 3 labels: the aligned ones in blue, the
misaligned ones in orange, and the “Unknown” class
in yellow, which represents when a misalignment is in
progress and consequently, there is no floor segmen-
tation available. Frames categorized as “Unknown”
are excluded for the evaluations. It should be noted
that, in an online scenario, increasing the window size
results in a delay of w/2 frames in misalignment pre-
diction, where w is the window size. Based on these
experiments, we selected a frame size of 61 frames,
equivalent to 2 seconds of video, and applied a me-
dian filter. This resulted in an F1 score of 75.27%
and an Area Under the ROC Curve of 82.90%. In an
online scenario, this configuration brings a prediction
delay of about 1 second, which is acceptable in many
applications.
5 CONCLUSION
We investigated the problem of world-map misalign-
ment in indoor navigation. Given the high cost and
time associated with labelling real-world data, we de-
veloped a tool to generate synthetic navigation data,
with associated floor segmentation masks. To miti-
gate the domain gap, we integrated a randomization
module and a high-definition render pipeline. We
acquired 70,000 examples, with half of them be-
ing aligned and the other half misaligned, covering
15 different environments. In addition, we acquired
and labelled 5 videos from which we extracted 8,000
frames in a real scenario. We adopted an approach
based on different ResNet18 configurations, obtain-
ing an F1 score of 74.30% on real frames. We also
Table 4: Results obtained on proposed real navigation
videos using temporal smoothing on the per-frame predic-
tions with sliding windows of different sizes. Best per-
column results are reported in bold.
Filter Window size F1 AUC
No Smoothing ✗ 74.30 78.38
Median 17 74.92 81.67
Median 31 75.42 82.56
Median 61 75.27 82.90
Median 91 75.13 82.86
Median 121 73.62 81.36
Mean 17 74.89 81.64
Mean 31 75.42 82.56
Mean 61 75.22 82.87
Mean 91 75.15 82.87
Mean 121 73.63 81.37
tried temporal smoothing sliding window approach on
the acquired videos obtaining an F1 score of 75,27%
and an AUC of 82.90%, suppressing isolated false
positive predictions. This tool can serve as a valuable
module within an indoor navigation system to detect
misalignments even for real-time applications.
ACKNOWLEDGEMENTS
This research has been supported by Next Vision
8
s.r.l. and by Research Program PIAno di inCEntivi
per la Ricerca di Ateneo 2020/2022 — Linea di Inter-
vento 3 “Starting Grant” - University of Catania.
REFERENCES
Andrea Orlando, S., Furnari, A., and Farinella, G. M.
(2020). Egocentric visitor localization and artwork de-
8
https://www.nextvisionlab.it/
World-Map Misalignment Detection for Visual Navigation Systems
331

tection in cultural sites using synthetic data. Pattern
Recognition Letters, 133:17–24.
Borkman, S., Crespi, A., Dhakad, S., Ganguly, S., Hogins,
J., Jhang, Y.-C., Kamalzadeh, M., Li, B., Leal, S.,
Parisi, P., Romero, C., Smith, W., Thaman, A., War-
ren, S., and Yadav, N. (2021). Unity perception: Gen-
erate synthetic data for computer vision.
Chen, L.-H., Wu, E. H.-K., Jin, M.-H., and Chen, G.-H.
(2014). Intelligent fusion of wi-fi and inertial sensor-
based positioning systems for indoor pedestrian navi-
gation. IEEE Sensors Journal, 14:4034–4042.
Deng, J., Dong, W., Socher, R., Li, L.-J., Li, K., and Fei-
Fei, L. (2009). Imagenet: A large-scale hierarchical
image database. In 2009 IEEE Conference on Com-
puter Vision and Pattern Recognition, pages 248–255.
DeTone, D., Malisiewicz, T., and Rabinovich, A. (2018).
Superpoint: Self-supervised interest point detection
and description.
Dong, J., Noreikis, M., Xiao, Y., and Yl
¨
a-J
¨
a
¨
aski, A. (2019).
Vinav: A vision-based indoor navigation system for
smartphones. IEEE Transactions on Mobile Comput-
ing, 18(6):1461–1475.
Ebadi, S. E., Jhang, Y.-C., Zook, A., Dhakad, S., Crespi, A.,
Parisi, P., Borkman, S., Hogins, J., and Ganguly, S.
(2022). Peoplesanspeople: A synthetic data generator
for human-centric computer vision.
Frid-Adar, M., Klang, E., Amitai, M., Goldberger, J., and
Greenspan, H. (2018). Synthetic data augmentation
using gan for improved liver lesion classification. In
2018 IEEE 15th International Symposium on Biomed-
ical Imaging (ISBI 2018), pages 289–293.
He, K., Zhang, X., Ren, S., and Sun, J. (2015). Deep resid-
ual learning for image recognition.
Huang, X., Mei, G., Zhang, J., and Abbas, R. (2021). A
comprehensive survey on point cloud registration.
Ishihara, T., Vongkulbhisal, J., Kitani, K. M., and Asakawa,
C. (2017). Beacon-guided structure from motion for
smartphone-based navigation. In 2017 IEEE Win-
ter Conference on Applications of Computer Vision
(WACV), pages 769–777.
Jeon, K. E., She, J., Soonsawad, P., and Ng, P. C. (2018).
Ble beacons for internet of things applications: Sur-
vey, challenges, and opportunities. IEEE Internet of
Things Journal, 5(2):811–828.
Kunhoth, J., Karkar, A., Al-Maadeed, S. A., and Al-Ali,
A. K. (2020). Indoor positioning and wayfinding sys-
tems: a survey. Human-centric Computing and Infor-
mation Sciences, 10:1–41.
Lee, T., Lee, B.-U., Shin, I., Choe, J., Shin, U., Kweon, I. S.,
and Yoon, K.-J. (2022). Uda-cope: Unsupervised do-
main adaptation for category-level object pose estima-
tion.
Leonardi, R., Ragusa, F., Furnari, A., and Farinella, G. M.
(2022). Egocentric human-object interaction detection
exploiting synthetic data.
Manlises, C., Yumang, A. N., Marcelo, M. W., Adriano, A.,
and Reyes, J. (2016). Indoor navigation system based
on computer vision using camshift and d* algorithm
for visually impaired. 2016 6th IEEE International
Conference on Control System, Computing and Engi-
neering (ICCSCE), pages 481–484.
Middelberg, S., Sattler, T., Untzelmann, O., and Kobbelt,
L. (2014). Scalable 6-dof localization on mobile de-
vices. In Computer Vision–ECCV 2014: 13th Euro-
pean Conference, Zurich, Switzerland, September 6-
12, 2014, Proceedings, Part II 13, pages 268–283.
Springer.
Mikhaylov, K., Tikanm
¨
aki, A., Pet
¨
aj
¨
aj
¨
arvi, J., H
¨
am
¨
al
¨
ainen,
M., and Kohno, R. (2016). On the selection of proto-
col and parameters for uwb-based wireless indoors lo-
calization. In 2016 10th International Symposium on
Medical Information and Communication Technology
(ISMICT), pages 1–5. IEEE.
Orlando, S., Furnari, A., Battiato, S., and Farinella, G.
(2019). Image based localization with simulated ego-
centric navigations. pages 305–312.
Quattrocchi, C., Di Mauro, D., Furnari, A., and Farinella,
G. M. (2022). Panoptic segmentation in industrial en-
vironments using synthetic and real data. In Sclaroff,
S., Distante, C., Leo, M., Farinella, G. M., and
Tombari, F., editors, Image Analysis and Processing
– ICIAP 2022, pages 275–286, Cham. Springer Inter-
national Publishing.
Saleh, F. S., Aliakbarian, M. S., Salzmann, M., Peters-
son, L., and Alvarez, J. M. (2018). Effective use of
synthetic data for urban scene semantic segmentation.
In Proceedings of the European Conference on Com-
puter Vision (ECCV), pages 84–100.
Sankaranarayanan, S., Balaji, Y., Jain, A., Lim, S. N., and
Chellappa, R. (2018). Learning from synthetic data:
Addressing domain shift for semantic segmentation.
In Proceedings of the IEEE conference on computer
vision and pattern recognition, pages 3752–3761.
Selvaraju, R. R., Cogswell, M., Das, A., Vedantam, R.,
Parikh, D., and Batra, D. (2019). Grad-CAM: Visual
explanations from deep networks via gradient-based
localization. International Journal of Computer Vi-
sion, 128(2):336–359.
Tobin, J., Fong, R., Ray, A., Schneider, J., Zaremba, W., and
Abbeel, P. (2017). Domain randomization for transfer-
ring deep neural networks from simulation to the real
world. In 2017 IEEE/RSJ International Conference on
Intelligent Robots and Systems (IROS), pages 23–30.
Wu, Y., Yuan, Y., and Wang, Q. (2022). Learning from
synthetic data for crowd instance segmentation in the
wild. In 2022 IEEE International Conference on Im-
age Processing (ICIP), pages 2391–2395.
Zhang, R., Li, Y., Yan, Y., Zhang, H., Wu, S., Yu, T., and
Gu, Z. (2016). Control of a wheelchair in an indoor
environment based on a brain–computer interface and
automated navigation. IEEE Transactions on Neural
Systems and Rehabilitation Engineering, 24:128–139.
Zheng, Y., Shen, G., Li, L., Zhao, C., Li, M., and Zhao,
F. (2014). Travi-navi: Self-deployable indoor naviga-
tion system. IEEE/ACM Transactions on Networking,
25:2655–2669.
VISAPP 2024 - 19th International Conference on Computer Vision Theory and Applications
332
