
Spiral Drawing Test and Explainable Convolutional Neural Networks for
Parkinson’s Disease Detection
Francesco Mercaldo
1,3
, Luca Brunese
1
, Mario Cesarelli
2
, Fabio Martinelli
3
and Antonella Santone
1
1
Department of Medicine and Health Sciences “Vincenzo Tiberio”, University of Molise, Campobasso, Italy
2
Department of Engineering, University of Sannio, Benevento, Italy
3
Institute for Informatics and Telematics, National Research Council of Italy (CNR), Pisa, Italy
mcesarelli@unisannio.it
Keywords:
Parkinson, Spiral, Machine Learning, Deep Learning, Explainability.
Abstract:
There is no definitive test for Parkinson’s disease, and the rate of misdiagnosis, particularly when made by in-
dividuals without specialized training, is significantly elevated. The spiral drawing test is a clinical assessment
tool used to evaluate fine motor skills, hand-eye coordination, and tremor in individuals, particularly those
with neurological disorders such as Parkinson’s disease. In this test, a person is typically asked to trace or
draw a spiral pattern on a piece of paper or a digital tablet. The test measures the smoothness and steadiness of
their hand movements. Any irregularities or tremors in the drawn spiral can provide valuable information to
healthcare professionals in diagnosing or monitoring conditions like Parkinson’s disease, essential tremors, or
other movement disorders. In this paper, we provide a method aimed at automatically analyse spiral drawing
tests to understand whether a subject is affected by Parkinson’s disease. We employ two different Convolu-
tional Neural Networks: DenseNet and ResNet50, by obtaining an accuracy equal to 0.96 in the evaluation
of a dataset composed of 3,991 spiral drawing tests, thus showing the effectiveness of the proposed method.
Moreover, with the aim to provide a kind of explainability behind the model prediction, the proposed method
is able to visualise, directly on the spiral drawing test image, the areas of the test image that from the model
point of view are related to Parkinson’s disease.
1 INTRODUCTION AND
RELATED WORK
Parkinson’s disease (PD) is a neurodegenerative dis-
order that primarily affects movement (Balestrino and
Schapira, 2020). It is a chronic and progressive con-
dition that typically develops slowly over time. The
main features of Parkinson’s disease include:
• Tremors. Resting tremors are a common symp-
tom, typically starting in one hand and often de-
scribed as a ”pill-rolling” tremor.
• Bradykinesia. This refers to slowness of move-
ment. People with PD may have difficulty initiat-
ing and completing voluntary movements, leading
to a gradual reduction in their ability to perform
everyday tasks.
• Muscle Rigidity. Stiffness of the muscles can
make it difficult for individuals with Parkinson’s
to move smoothly.
• Postural Instability. Balance problems can lead to
a greater risk of falls and other injuries.
In addition to motor symptoms, PD can also cause
a range of non-motor symptoms, including:
• Cognitive Changes. Some individuals may ex-
perience cognitive impairment, which can range
from mild memory problems to more severe is-
sues like dementia.
• Mood Disorders. Depression and anxiety are
common in people with Parkinson’s disease.
• Sleep Disturbances. Sleep problems, such as in-
somnia or excessive daytime sleepiness, can oc-
cur.
• Autonomic Dysfunction. This can lead to is-
sues with blood pressure regulation, digestion,
and other bodily functions.
The exact cause of PD is not fully understood
(Poewe et al., 2017), but it is believed to involve
a combination of genetic and environmental factors.
Mercaldo, F., Brunese, L., Cesarelli, M., Martinelli, F. and Santone, A.
Spiral Drawing Test and Explainable Convolutional Neural Networks for Parkinson’s Disease Detection.
DOI: 10.5220/0012407100003636
Paper published under CC license (CC BY-NC-ND 4.0)
In Proceedings of the 16th International Conference on Agents and Artificial Intelligence (ICAART 2024) - Volume 2, pages 443-452
ISBN: 978-989-758-680-4; ISSN: 2184-433X
Proceedings Copyright © 2024 by SCITEPRESS – Science and Technology Publications, Lda.
443

There is currently no cure for PD, but there are treat-
ments available to manage its symptoms. Medi-
cations, physical therapy, occupational therapy, and
lifestyle modifications can all help improve the qual-
ity of life for individuals with Parkinson’s disease.
In some cases, surgical interventions like deep
brain stimulation may be considered to alleviate
symptoms, particularly for those who do not respond
well to medication.
It is important for individuals with PD to work
closely with healthcare professionals, such as neurol-
ogists and physical therapists, to develop a personal-
ized treatment plan and receive the necessary support
for managing the condition.
PD is currently the second most common neurode-
generative disorder after Alzheimer’s disease. Ac-
cording to the Parkinson’s Foundation
1
, nearly one
million people in the U.S. are living with PD. This
number is expected to rise to 1.2 million by 2030.
Moreover, nearly 90,000 people in the U.S. are di-
agnosed with PD each year.
Its prevalence tends to increase with age. It is esti-
mated that about 1% of the population over the age of
60 is affected by PD. As a matter of fact, while PD can
affect people of all ages, it is most commonly diag-
nosed in people over the age of 60. It is relatively rare
in younger individuals and it is more common in men
than in women. Men are about 1.5 times more likely
to develop the condition. The incidence of new cases
of PD is estimated to be around 20 cases per 100,000
people per year. PD is a progressive condition, and its
rate of progression can vary from person to person.
Some individuals may experience a relatively slow
progression, while others may progress more quickly.
it can significantly impact an individual’s quality of
life and it can lead to difficulties in performing daily
activities, increased healthcare costs, and a decreased
ability to work. Moreover, while PD itself is not typ-
ically considered a direct cause of death, complica-
tions related to the condition, such as falls and pneu-
monia, can increase mortality risk. It can also impose
a substantial economic burden on individuals, fami-
lies, and healthcare systems. Costs associated with
medical care, medications, and lost productivity can
be significant.
Currently, there is no objective test available for
PD, and the rate of misdiagnosis, especially when
made by non-specialists, is quite high, with the like-
lihood of an incorrect diagnosis reaching up to 20%
(Rizzo et al., 2016). While a careful analysis of pri-
mary symptoms like tremors, bradykinesia, and rigid-
ity can enhance diagnostic accuracy, clinical assess-
ments may still be influenced by the subjectivity of
1
https://www.parkinson.org/
the physician. To address this issue, the use of med-
ical decision support tools is of great interest as they
can increase objectivity and aid in early diagnosis.
This early diagnosis is crucial as it paves the way
for the development of tailored treatments for PD-
affected patients (Ammenwerth et al., 2013; Dreiseitl
and Binder, 2005). An important objective in neu-
rodegenerative disease research is the identification of
precise biomarkers (Mattison et al., 2012).
In the scientific literature, there is a wide array of
studies dedicated to PD detection through speech pro-
cessing (Lahmiri and Shmuel, 2019; G
´
omez-Garc
´
ıa
et al., 2019), where the diagnosis is based on sus-
tained vowels and natural speech. Additionally, mo-
tor symptoms can be detected and monitored by mod-
eling patient movements and gait (Viteckova et al.,
2018; San-Segundo et al., 2019).
One of the initial signs often observed in PD is
alterations in the kinematics of handwriting. McLen-
nan et al. (Letanneux et al., 2014) found that around
5% of PD patients exhibited micrographia (abnor-
mally small letter size), and 30% reported deterio-
rating handwriting before the onset of motor symp-
toms. The motor symptoms associated with PD, such
as stiffness, bradykinesia, and tremors, result in three
primary changes in writing (Zham et al., 2017a): the
size of writing (Potgieser et al., 2015) (micrographia
(Drot
´
ar et al., 2016)), pen-pressure (Letanneux et al.,
2014), and kinematics. Various tools have been devel-
oped for the analysis of handwriting related to PD pa-
tients (Chatterjee and Kordower, 2019). It is not just
the static aspects but also the dynamic ones that are
of interest, including speed and pen-pressure reduc-
tion during writing (Drot
´
ar et al., 2016; Rosenblum
et al., 2013).
Several recent review papers on this topic have
been published (Impedovo and Pirlo, 2019; Impedovo
and Pirlo, 2018). It is important to note that an in-
dividual’s handwriting can be influenced by their vi-
sual capability (Potgieser et al., 2015), writing style,
or language skills, leading to significant variability
among individuals. An alternative to handwriting
analysis is the use of drawings, for instance, the spiral
drawing test.
In this direction, Kotsavasiloglou et al. (Kot-
savasiloglou et al., 2017) employed a pen-and-tablet
device to examine differences in hand movement and
muscle coordination between healthy individuals and
PD patients. They used five metrics, including mean
horizontal velocity, normalized velocity variability (in
units per second), standard deviation of horizontal ve-
locity, and entropies of horizontal and vertical signal
components. Their evaluation of various classifica-
tion algorithms resulted in the best accuracy equal to
ICAART 2024 - 16th International Conference on Agents and Artificial Intelligence
444

0.88. Zham et al. (Zham et al., 2017a) assessed 10
features, combining static and dynamic information,
using the Na
¨
ıve Bayes algorithm for classification,
achieving an accuracy of 0.83. Both of these previ-
ous papers (Zham et al., 2017a; Kotsavasiloglou et al.,
2017) made decisions at intervals of approximately 2
seconds for each drawing.
Gallicchio et al. (Gallicchio et al., 2018) proposed
the utilization of DeepESNs, achieving an accuracy
of 0.89. Meanwhile, Khatamino et al. (Khatamino
et al., 2018) employed a Convolutional Neural Net-
work (CNN) inspired by the AlexNet architecture
(Krizhevsky et al., 2012), which consisted of two
main components (convolutional layers for feature ex-
traction and fully connected layers for classification).
A test that involves drawing a spiral on a sheet of
paper could be used to diagnose early PD i.e., the so-
called Spiral Drawing Test (Chakraborty et al., 2020).
The Spiral Drawing Test is a neuropsychological
test used to assess fine motor skills, coordination, and
dexterity, particularly in the context of neurological
and motor function evaluations(Stanley et al., 2010).
It is a relatively simple test that involves asking an
individual to draw a spiral or a series of spirals on a
piece of paper. The evaluator may provide specific in-
structions, such as starting from the center and work-
ing outward or starting at a particular point on the pa-
per (San Luciano et al., 2016).
The Spiral Drawing Test can be used in various
clinical settings, including assessing neurological dis-
orders such as Parkinson’s disease. In such cases, it
can help evaluate fine motor control and detect any
abnormalities or tremors in the drawing pattern. For
example, people with Parkinson’s disease may pro-
duce spirals with more visible tremors or irregulari-
ties, which can be indicative of their motor control
issues (Kamble et al., 2021).
This test is also used in research and clinical as-
sessments to evaluate other conditions, such as essen-
tial tremor, multiple sclerosis, and stroke, which can
affect motor skills and coordination.
The Spiral Drawing Test is just one tool in a bat-
tery of assessments used by healthcare profession-
als to diagnose and monitor neurological and motor
function disorders. When used alongside other clin-
ical evaluations, medical history, and imaging tests,
it can provide valuable insights into a patient’s con-
dition and aid in treatment planning and monitoring
(Gil-Mart
´
ın et al., 2019).
In recent years, deep learning has demonstrated
remarkable capabilities in the field of image classifi-
cation(Cimitile et al., 2017; Bacci et al., 2018; Huang
et al., 2023; Mercaldo and Santone, 2021). CNNs are
a specific class of deep learning models that have been
particularly successful in biomedical image classifica-
tion tasks (Huang et al., 2022). Despite the possibil-
ity of deep learning being highly successful in image
classification, it is important to note that it requires
substantial computational resources, large datasets,
and specialized hardware (such as GPUs) for train-
ing. Additionally, the explainability of deep learning
models can be challenging, which is a topic of ongo-
ing research and development that limits the applica-
tion of deep learning in the real-world domain, with
particular regard to healthcare (Huang et al., 2021).
For these reasons, in this paper, we propose an ex-
plainable method aimed at detecting whether a patient
is affected by PD by analysing the Spiral Drawing
Test. We consider several CNNs for the classifica-
tion task (aimed to discriminate between healthy and
unhealthy patients).
The paper proceeds as follows: in the next sec-
tion, we present the proposed method for explainable
PD detection from the spiral drawing test, in Section
3 the experimental analysis results are presented and,
finally, in the last section, conclusion and future re-
search directions are drawn.
2 THE METHOD
As mentioned in the previous section, the pro-
posed approach employs supervised machine learn-
ing, specifically delving into deep learning techniques
through the utilization of CNNs. CNNs stand out as
a type of artificial neural network exceptionally well-
suited for tasks involving image classification, mak-
ing them particularly relevant in the realm of diag-
nosing brain cancer.
In this approach, CNNs are subjected to training
using a labeled dataset encompassing images of both
spiral drawing tests drawn by healthy subjects and
from subjects affected by PD. The network gleans
knowledge from these instances and distills meaning-
ful characteristics from the images to discern between
patterns associated with healthy subjects and those in-
dicative of PD. The training procedure involves iter-
atively fine-tuning the network’s parameters to mini-
mize classification errors and enhance its precision in
distinguishing between the two categories.
Once the CNN has been sufficiently trained, it can
be applied to categorize new, previously unseen brain
images as either healthy or cancer-affected, based on
the knowledge it has acquired. The network assesses
the input image using its learned filters and identifies
pertinent features to make a prediction.
It is essential to acknowledge that the effective-
ness and accuracy of the proposed approach depend
Spiral Drawing Test and Explainable Convolutional Neural Networks for Parkinson’s Disease Detection
445
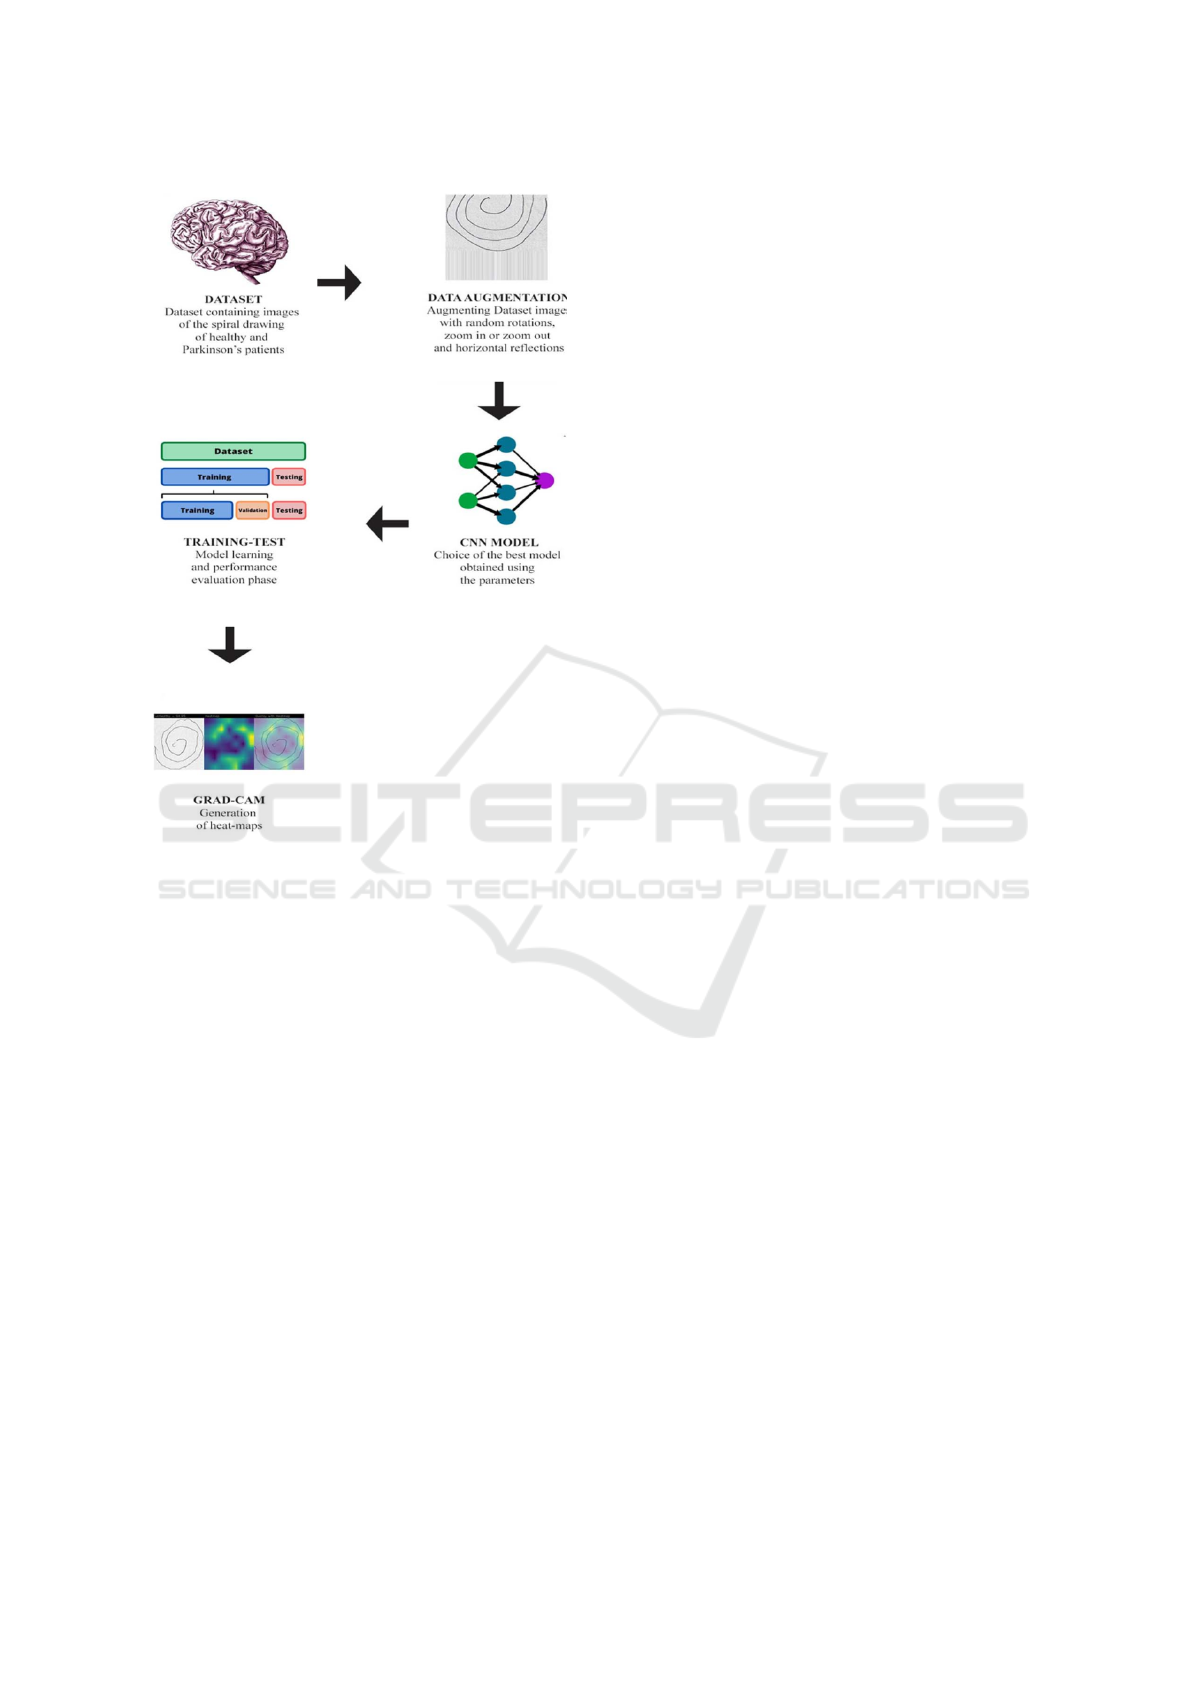
Figure 1: The workflow of the proposed method for explain-
able PD detection through spiral draw testing.
on various factors, including the quality and repre-
sentativeness of the training data, the architecture
and configurations of the CNN, and the methods em-
ployed for validation and testing.
The workflow of the proposed method is shown in
Figure 1.
The proposed method comprises five distinct
phases:
1. Dataset. An essential element in developing an
effective model for brain cancer diagnosis is the
dataset used in machine learning. It is crucial
to possess a meticulously annotated dataset that
encompasses both images of spiral drawing tests
obtained from healthy subjects and subjects with
PD. Ensuring the model’s robustness and general-
ization capability requires a diverse and represen-
tative dataset.
2. Data Augmentation. Once the dataset is obtained,
it is crucial to preprocess the images to stan-
dardize and remove biases introduced by various
imaging settings. Common preprocessing tech-
niques include brightness adjustment during train-
ing, which mitigates intensity variations. In the
proposed paper we consider the following data
augmentation techniques: random rotations, hori-
zontal and vertical reflections, zoom in and zoom
out, random cropping, scaling, contrast, bright-
ness, and saturation adjustments. As a matter
of fact, data Augmentation, especially for small-
sized datasets, can generate new data examples
from existing ones, preserving the same general
characteristics but with random variations that can
enhance the model’s generalization ability. These
techniques aim to enhance data consistency and
algorithm effectiveness.
3. CNN Model. After data collection and augmenta-
tion, the next step involves selecting deep learning
models. We consider a binary classification task,
where a spiral drawing test can be classified as be-
longing to a healthy patient or to a patient affected
by PD. Consideration extends beyond accuracy:
explainability is essential, particularly in medical
applications. Choosing appropriate hyperparame-
ters, such as the number of epochs, batch size, and
learning rate, requires careful consideration and
experimentation. In this paper, two of the most
widespread deep learning architectures based on
CNNs are exploited: Densely Connected Con-
volutional Networks (DenseNet) (Huang et al.,
2019) and Residual Networks (ResNet) (He et al.,
2016). Both of which have made significant con-
tributions to the field of computer vision and im-
age classification (Zhang et al., 2021; Li et al.,
2020; Liu et al., 2021; Chen et al., 2022). The fol-
lowing is a brief description of each architecture
we exploited in this paper:
• The key innovation in DenseNet is its dense
connectivity pattern. In traditional CNN ar-
chitectures, each layer typically receives inputs
only from the previous layer. In DenseNet,
each layer is connected to all subsequent lay-
ers. This dense connectivity encourages fea-
ture reuse and gradient flow throughout the net-
work, making it more efficient and reducing the
risk of vanishing gradients. DenseNet is com-
posed of dense blocks, each containing a se-
ries of convolutional layers, batch normaliza-
tion, and non-linear activation functions. Skip
connections from earlier layers are concate-
nated with the feature maps in the current layer.
The dense connectivity allows for more effi-
cient parameter usage, enabling the construc-
tion of deep networks with relatively fewer pa-
rameters.
• The central idea behind ResNet is the use of
residual connections, which allow for very deep
networks to be trained effectively. A residual
ICAART 2024 - 16th International Conference on Agents and Artificial Intelligence
446

block contains a shortcut connection (skip con-
nection) that bypasses one or more convolu-
tional layers. The residual block reformulates
the learning problem as learning the residual of
the identity mapping. This makes it easier to
train deep networks, as the network can learn to
adjust the output from a previous layer. ResNet
architectures come in various depths, such as
ResNet18, ResNet50, ResNet101, and more,
where the numbers indicate the number of lay-
ers in the network. In this paper, we experi-
ment with the ResNet50 architecture. ResNet’s
use of residual connections has been instru-
mental in enabling the training of extremely
deep networks, leading to significant improve-
ments in performance on image classification
tasks. ResNet has also been widely adopted
and adapted for various computer vision tasks,
including object detection and image segmen-
tation.
Both DenseNet and ResNet are deep neural net-
work architectures that have had a profound im-
pact on the field of computer vision. DenseNet
focuses on dense connectivity, while ResNet uti-
lizes residual connections to enable the training of
very deep networks, leading to improved perfor-
mance in various image analysis tasks: these are
the reasons why we experiment with both of them
in this paper.
4. Training-Test. in this step, we consider Model
training and testing, involving computing met-
rics like Accuracy, Precision, and Recall to as-
sess prediction efficiency. If results are unsatis-
factory, different combinations of hyperparame-
ters are considered to achieve desired outcomes
(Mercaldo and Santone, 2021).
5. Grad-CAM. The Grad-CAM (Gradient-weighted
Class Activation Mapping) algorithm is utilized to
create heatmaps, offering visual explanations for
model predictions. Beyond prediction accuracy,
the model’s ability to highlight areas in the input
image that influenced the classification is evalu-
ated. The aim of the Grad-CAM is to extract
gradients from the model’s convolutional layers
to provide these visual explanations, offering in-
sights into the decision-making process.
3 EXPERIMENTAL EVALUATION
With the aim of validating the proposed method, we
exploit a dataset containing 3,991 images related to
spiral drawing tests, with 1,995 images correspond-
Figure 2: Spiral drawing tests related to a healthy (on the
left) and an unhealthy patient (on the right).
ing to patients diagnosed with PD and the remain-
ing 1,996 images representing individuals without the
disease condition (Zham et al., 2017b). This dataset,
referred to as ”Parkinson’s Drawings” is accessible
for research purposes on the Kaggle website and can
be freely obtained
2
. As discussed in the previous sec-
tion, we consider a binary classification task, where
each image obtained from a spiral drawing test can be
classified as belonging to a PD-affected patient or to
a healthy one.
Figure 2 shows two examples of spiral drawing
tests (belonging to the analysed dataset): the test on
the left is related to a healthy patient, while the one
on the right is drawn by a PD-affected subject.
As shown in Figure 2, we can note that in the case
of the patient PD-affected on the left, the spiral lines
are less linear than in the case on the left of the healthy
patient, due to the trembling caused by the disease.
The dataset is later divided into an 80:10:10 ratio
for the training, validation, and testing datasets, re-
sulting in the selection of 1,579 images for training
(790 associated with healthy patients and the remain-
ing 789 with PD patients), 200 images for validation
(100 from each group), and the remaining 200 images
for testing (100 from each group).
With the aim of understanding the effectiveness of
the models in the discrimination between spiral draw-
ing tests related to healthy and PD-affected patients,
the following metrics are computed:
• Loss. The loss, also known as the cost or ob-
jective function, quantifies the error between the
predicted values generated by a machine learn-
ing model and the actual ground truth values in
the dataset. The goal is to minimize this error
during training. Various loss functions, such as
mean squared error (MSE), cross-entropy loss,
and hinge loss, are used depending on the prob-
lem type (e.g., regression or classification).
• Accuracy. Accuracy is a classification metric that
measures the proportion of correctly predicted in-
2
https://www.kaggle.com/datasets/kmader/parkinson
s-drawings
Spiral Drawing Test and Explainable Convolutional Neural Networks for Parkinson’s Disease Detection
447

stances in a dataset. It’s calculated as the number
of correct predictions divided by the total num-
ber of predictions. High accuracy indicates that a
model is making correct predictions for most of
the data.
• Precision. Precision is a metric used in binary
classification. It measures the accuracy of positive
predictions made by a model. It is calculated as
the number of true positives divided by the sum of
true positives and false positives. Precision helps
assess the model’s ability to avoid false positives.
• Recall. Recall, also known as sensitivity or true
positive rate, measures the ability of a model to
correctly identify positive instances from the to-
tal number of actual positives. It is calculated as
the number of true positives divided by the sum of
true positives and false negatives. Recall is essen-
tial for understanding how well a model captures
all relevant instances.
• F-Measure. The F-Measure is a metric that com-
bines both precision and recall into a single value.
It is the harmonic mean of precision and recall and
provides a balance between them. A higher F1
Score indicates a model that has good precision
and recall.
• Area Under the ROC Curve (AUC). AUC is a met-
ric used to evaluate the performance of a binary
classification model. It measures the ability of the
model to distinguish between positive and nega-
tive classes across different classification thresh-
olds. The ROC (Receiver Operating Character-
istic) curve is a graphical representation of the
trade-off between true positive rate (recall) and
false positive rate as the decision threshold varies.
The AUC is the area under this ROC curve. A
higher AUC signifies better model performance,
with a value of 1 indicating perfect classification.
Next, we proceed with the training of the deep
learning models. To ensure replicability, in the fol-
lowing, we show the hyperparameters we used for
training the DenseNet and MobileNet models in Ta-
ble 1.
Table 1: Hyper-parameters setting.
Batch size Learning rate Image size
32 0.01 224x224x3
The results of the experimental analysis are dis-
played in Table 2.
As shown in Table 2 we ran several experiments:
the first ones with a number of epochs equal to 20:
with this number of epochs we obtained an accuracy
equal to 0.86 with the DenseNet network and an accu-
racy of 0.75 by exploiting the ResNet50 one. Consid-
ering that from these two experiments, the DenseNet
network demonstrated better performances in the dis-
crimination of PD-affected patients and healthy ones,
we consider the DenseNet model for additional exper-
iments with a different number of epochs: 50 and 100.
With a number of epochs of 50 we obtain an accuracy
equal to 0.96, while when the number of epochs is
increased to 100, the accuracy obtained is 0.89.
Thus, from the results shown in Table 2, it
emerges that the model obtaining the best perfor-
mances in PD-affected patients is the DenseNet one,
trained with a number of epochs equal to 50, with an
accuracy, a precision and a recall equal to 0.96.
With the aim to show how the proposed method
can provide a kind of explainability behind the model
prediction, we show four different examples of Grad-
CAM applications (in Figures 3, 4, 5 and 6), belong-
ing to two healthy patients (Figures 3, 4) and to two
subjects PD affected (Figures 5, 6), obtained with the
best model i.e., the DenseNet one, trained with for 50
epochs.
For instance, in Figure 3 there is an example of
localization provided by the Grad-CAM algorithm re-
lated to a healthy patient (correctly predicted with a
percentage equal to 92.3%). In particular, the pixels
highlighted in yellow relate to areas that were of par-
ticular interest for the model to make the predictions,
the green areas are areas of interest for the model, but
of lesser interest than the areas highlighted in yellow.
The areas in purple are the areas that are not of in-
terest to the model for the purposes of the prediction
made.
For this reason, in Figure 3 we can note that the
areas of interest from the model point of view are the
ones related to the smallest part of the spiral and some
areas on the left of the image (as we can note from the
yellow areas in the overlay with heatmap image).
Figure 4 shows another example of prediction re-
lated to a healthy patient.
In the Grad-CAM generated for the spiral draw-
ing test shown in Figure 4 we can note that the areas
of interest from the model point of view are several
areas, all focused on the outermost spiral curves com-
pared to the previous example. The fact that different
areas of the spiral are highlighted on a different image
is a symptom that the model has learned to generalize
the distinctive features of a spiral written by a healthy
user, regardless of the area of the spiral or sheet where
it was written, demonstrating, therefore, a good model
generalization ability, fundamental in machine learn-
ing problems to avoid models capable of identifying
only certain types of cases (and therefore poorly gen-
eralizable).
ICAART 2024 - 16th International Conference on Agents and Artificial Intelligence
448
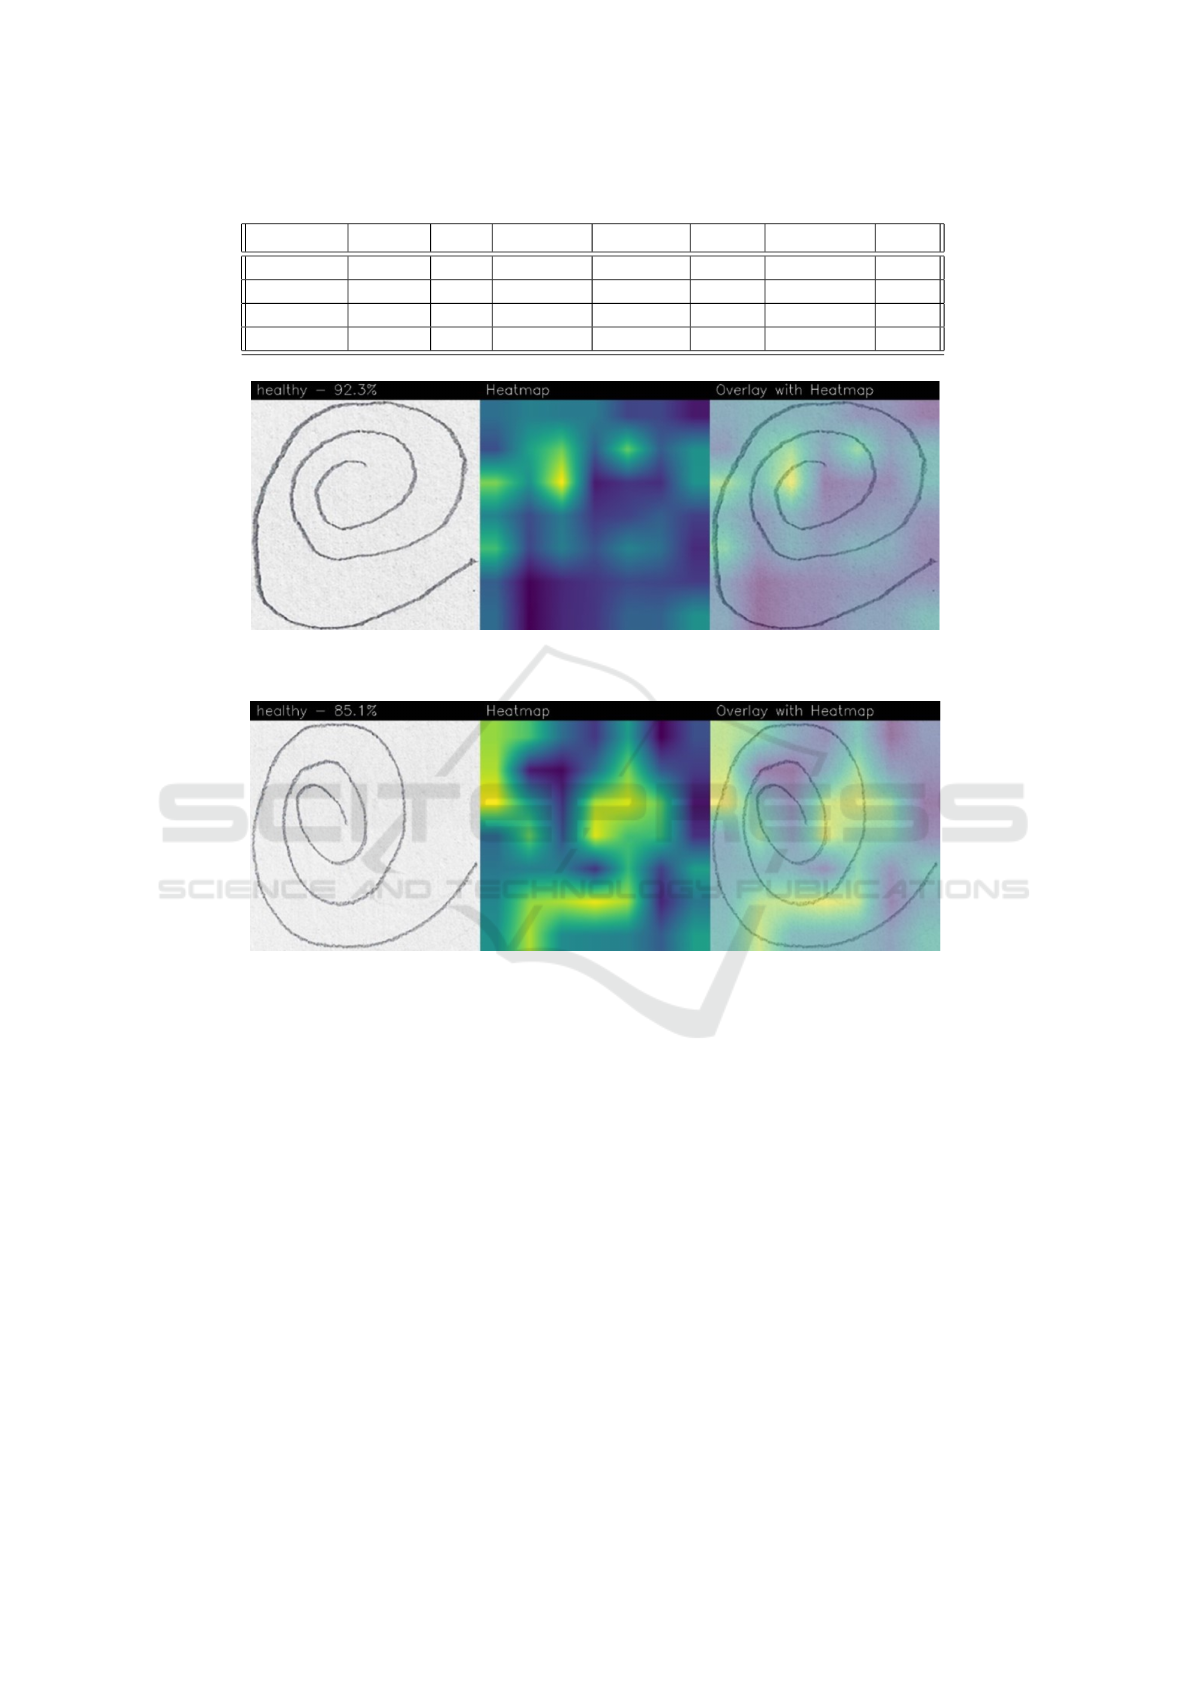
Table 2: The experimental analysis results obtained with the DenseNet and the ResNet50 models.
Model Epochs Loss Accuracy Precision Recall F-Measure AUC
DenseNet 20 0.34 0.86 0.86 0.86 0.86 0.93
DenseNet 50 0.17 0.96 0.96 0.96 0.96 0.98
DenseNet 100 0.51 0.89 0.89 0.89 0.89 0.94
ResNet50 20 0.48 0.75 0.75 0.75 0.75 0.84
Figure 3: An example of localization provided by the Grad-CAM algorithm related to a healthy patient predicted with a
percentage equal to 92.3%.
Figure 4: An example of localization provided by the Grad-CAM algorithm related to a healthy patient predicted with a
percentage equal to 85.1%.
Figure 5 shows an example of prediction related to
an unhealthy patient (i.e., PD-affected) predicted with
a percentage equal to 94.9%.
In this prediction example, we can see that the
area of interest of the model (highlighted by the Grad-
CAM in yellow) is related to different areas of the spi-
ral, therefore the model recognized different areas of
the spiral as symptomatic of the presence of PD.
Figure 6 shows another example of a (correct) pre-
diction of a patient PD-affected, detected with a per-
centage equal to 100%.
In this last case, we can see how the spiral is de-
cidedly different in its features compared to the ex-
amples of healthy patients (shown in Figures 3 and
4) but also compared to the PD-affected patient ana-
lyzed in the previous example (i.e., in Figure 5): as
a matter of fact, the features of the spiral are decid-
edly less linear, and this is symptomatic of a patient
who is evidently suffering from severe trembling, one
of the main symptoms of PD. In this case, the areas
of interest for Grad-CAM are those in which the non-
linearity of the spiral curves is greater, therefore in
the innermost part of the spiral we can see how there
is a concentration of yellow areas. The model pre-
dicted the test with a percentage equal to 100% as the
presence of the tremor appears decidedly more evi-
dent than in the case of the PD patient analyzed pre-
viously.
Also in this case the model highlighted different
areas of the image, demonstrating that the distinc-
tive features of the disease were identified regardless
of the area of the image in which they were present,
showing the generability of the model trained through
the DenseNet network.
Spiral Drawing Test and Explainable Convolutional Neural Networks for Parkinson’s Disease Detection
449
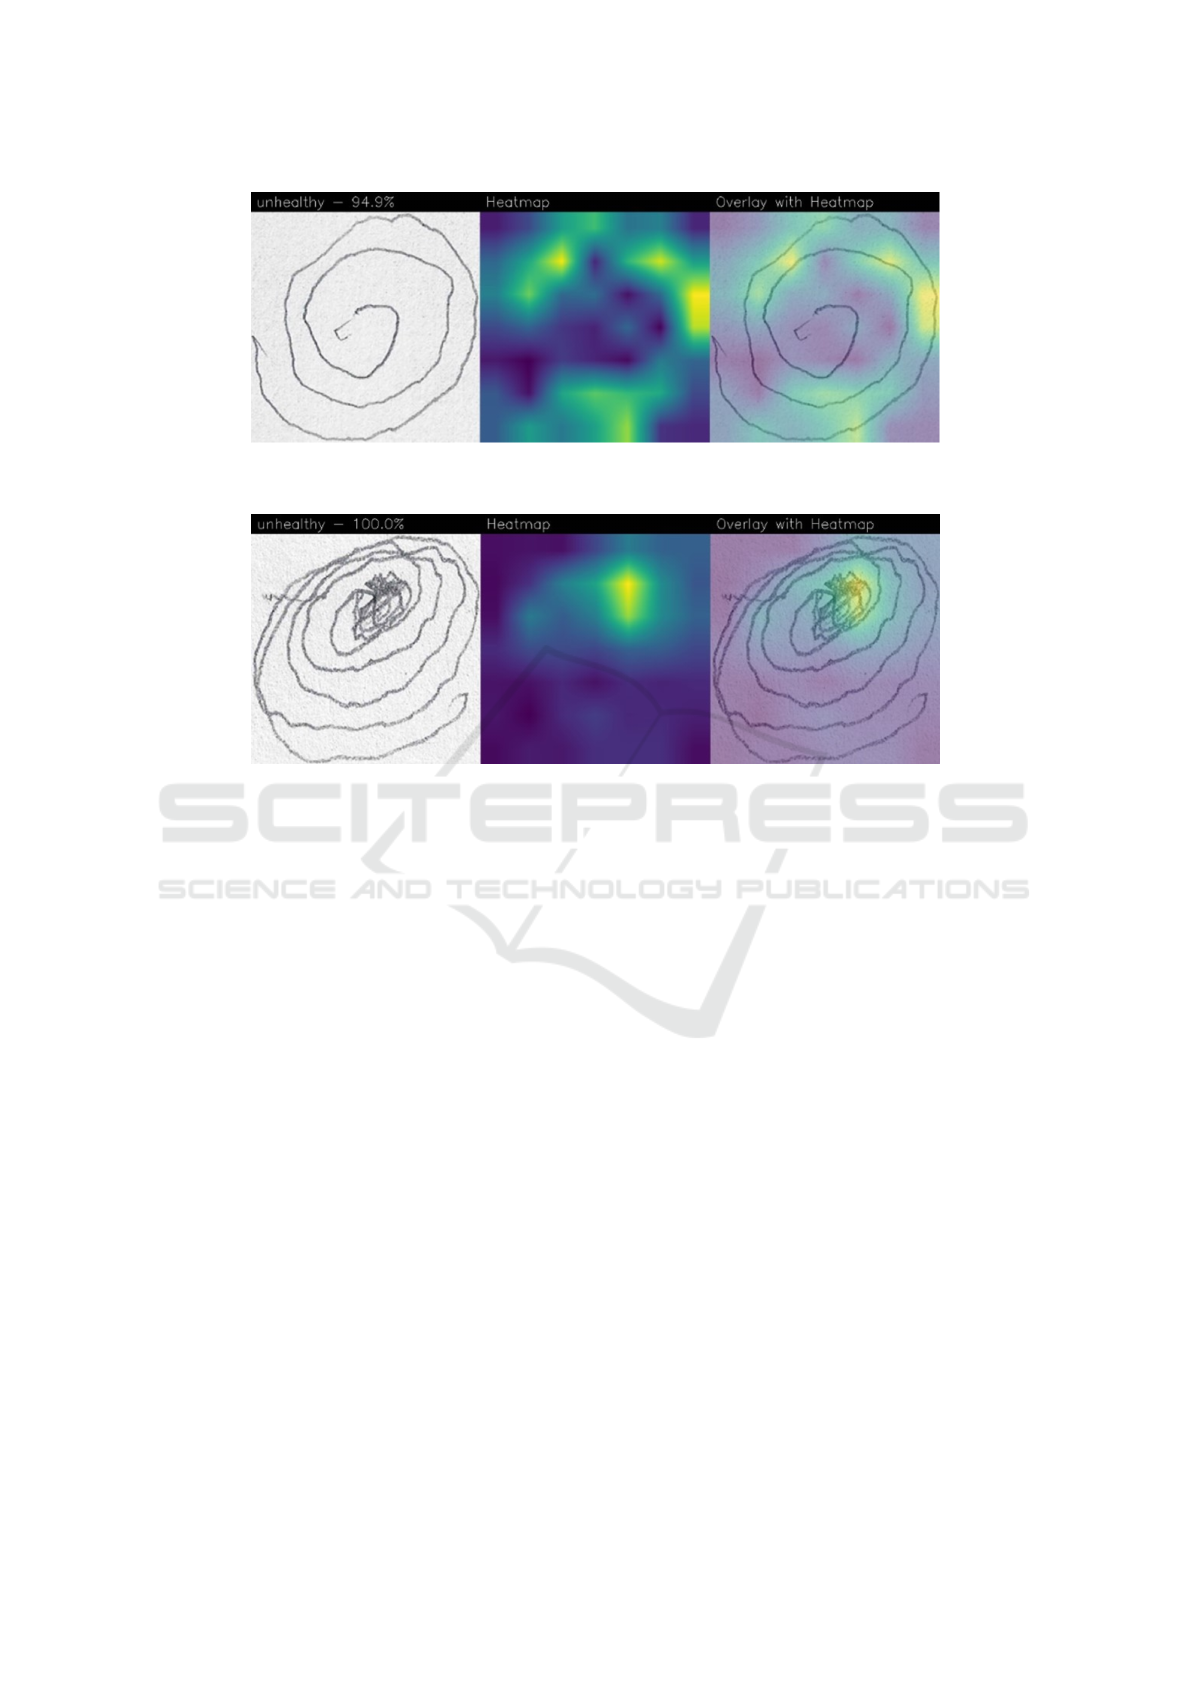
Figure 5: An example of localization provided by the Grad-CAM algorithm related to an unhealthy patient (i.e., PD-affected)
predicted with a percentage equal to 94.9%.
Figure 6: An example of localization provided by the Grad-CAM algorithm related to an unhealthy patient (i.e., PD-affected)
correctly predicted with a percentage equal to 100%.
4 CONCLUSIONS AND FUTURE
WORK
Considering that there is no definitive diagnostic test
available for PD diagnosis, and the likelihood of mis-
diagnosis is notably higher, particularly when the
diagnosis is made by individuals lacking special-
ized training, in this paper we proposed a method
aimed to discriminate between PD-affected patients
and healthy subjects. For this task, we consider differ-
ent CNN models trained by exploiting images related
to spiral drawing tests. Two different CNNs are con-
sidered: ResNet50 and DenseNet. The experimen-
tal results analysis demonstrated that the DenseNet
model is able to obtain better performances if com-
pared with the ResNet50 one: as a matter of fact,
accuracy, precision, recall, and F-Measure equal to
0.96 are obtained, in the evaluation of a dataset re-
lated to 3,991 different images related to spiral draw-
ing tests, with 1,995 images corresponding to patients
PD-affected and the remaining 1,996 images repre-
senting individuals without the PD condition (i.e.,
healthy subjects). Moreover, with the aim to pro-
vide prediction explainability, we take into account
the Grad-CAM algorithm, able to highlight (with a
heatmap) the areas on the spiral drawing test image
symptomatic of a certain prediction, thus providing a
kind of rationale behind the model decision, by show-
ing the areas on the image responsible for the predic-
tion. In this way, we think that CNNs can be really
employed in real-world clinical decisions, as a mat-
ter of fact, due to the lack of prediction explainability
medical staff do not have a strong trust in the predic-
tion provided by machine learning models.
In future work, we plan to consider additional
CNN-based architectures, with the aim of improving
the obtained performances. Moreover, we will con-
sider not only images related to spiral drawing tests
but also images related to wave tests, another kind of
geometric drawing used to understand whether there
is the presence of PD. We will investigate to under-
stand if by exploiting wave images we are able to
obtain better PD detection than spiral ones, or if the
combination of spiral and wave images can help to
obtain better performances.
ICAART 2024 - 16th International Conference on Agents and Artificial Intelligence
450

ACKNOWLEDGEMENTS
This work has been partially supported by EU DUCA,
EU CyberSecPro, SYNAPSE, PTR 22-24 P2.01 (Cy-
bersecurity) and SERICS (PE00000014) under the
MUR National Recovery and Resilience Plan funded
by the EU - NextGenerationEU projects.
REFERENCES
Ammenwerth, E., Nyk
¨
anen, P., Rigby, M., and de Keizer,
N. (2013). Clinical decision support systems: need
for evidence, need for evaluation.
Bacci, A., Bartoli, A., Martinelli, F., Medvet, E., and Mer-
caldo, F. (2018). Detection of obfuscation techniques
in android applications. In Proceedings of the 13th In-
ternational Conference on Availability, Reliability and
Security, pages 1–9.
Balestrino, R. and Schapira, A. (2020). Parkinson disease.
European journal of neurology, 27(1):27–42.
Chakraborty, S., Aich, S., Han, E., Park, J., Kim, H.-C.,
et al. (2020). Parkinson’s disease detection from spi-
ral and wave drawings using convolutional neural net-
works: A multistage classifier approach. In 2020 22nd
International Conference on Advanced Communica-
tion Technology (ICACT), pages 298–303. IEEE.
Chatterjee, D. and Kordower, J. H. (2019). Immunother-
apy in parkinson’s disease: Current status and future
directions. Neurobiology of disease, 132:104587.
Chen, H., Liu, J., Hua, C., Feng, J., Pang, B., Cao, D., and
Li, C. (2022). Accurate classification of white blood
cells by coupling pre-trained resnet and densenet with
scam mechanism. BMC bioinformatics, 23(1):1–20.
Cimitile, A., Martinelli, F., Mercaldo, F., et al. (2017). Ma-
chine learning meets ios malware: Identifying mali-
cious applications on apple environment. In ICISSP,
pages 487–492.
Dreiseitl, S. and Binder, M. (2005). Do physicians value de-
cision support? a look at the effect of decision support
systems on physician opinion. Artificial intelligence
in medicine, 33(1):25–30.
Drot
´
ar, P., Mekyska, J., Rektorov
´
a, I., Masarov
´
a, L.,
Sm
´
ekal, Z., and Faundez-Zanuy, M. (2016). Evalu-
ation of handwriting kinematics and pressure for dif-
ferential diagnosis of parkinson’s disease. Artificial
intelligence in Medicine, 67:39–46.
Gallicchio, C., Micheli, A., and Pedrelli, L. (2018). Deep
echo state networks for diagnosis of parkinson’s dis-
ease. arXiv preprint arXiv:1802.06708.
Gil-Mart
´
ın, M., Montero, J. M., and San-Segundo, R.
(2019). Parkinson’s disease detection from draw-
ing movements using convolutional neural networks.
Electronics, 8(8):907.
G
´
omez-Garc
´
ıa, J. A., Moro-Vel
´
azquez, L., and Godino-
Llorente, J. I. (2019). On the design of automatic
voice condition analysis systems. part ii: Review of
speaker recognition techniques and study on the ef-
fects of different variability factors. Biomedical Sig-
nal Processing and Control, 48:128–143.
He, K., Zhang, X., Ren, S., and Sun, J. (2016). Deep resid-
ual learning for image recognition. In Proceedings of
the IEEE conference on computer vision and pattern
recognition, pages 770–778.
Huang, G., Liu, Z., Pleiss, G., Van Der Maaten, L., and
Weinberger, K. Q. (2019). Convolutional networks
with dense connectivity. IEEE transactions on pat-
tern analysis and machine intelligence, 44(12):8704–
8716.
Huang, P., He, P., Tian, S., Ma, M., Feng, P., Xiao, H.,
Mercaldo, F., Santone, A., and Qin, J. (2022). A vit-
amc network with adaptive model fusion and multiob-
jective optimization for interpretable laryngeal tumor
grading from histopathological images. IEEE Trans-
actions on Medical Imaging, 42(1):15–28.
Huang, P., Tan, X., Zhou, X., Liu, S., Mercaldo, F., and
Santone, A. (2021). Fabnet: fusion attention block
and transfer learning for laryngeal cancer tumor grad-
ing in p63 ihc histopathology images. IEEE Journal
of Biomedical and Health Informatics, 26(4):1696–
1707.
Huang, P., Zhou, X., He, P., Feng, P., Tian, S., Sun, Y., Mer-
caldo, F., Santone, A., Qin, J., and Xiao, H. (2023).
Interpretable laryngeal tumor grading of histopatho-
logical images via depth domain adaptive network
with integration gradient cam and priori experience-
guided attention. Computers in Biology and Medicine,
154:106447.
Impedovo, D. and Pirlo, G. (2018). Dynamic handwriting
analysis for the assessment of neurodegenerative dis-
eases: a pattern recognition perspective. IEEE reviews
in biomedical engineering, 12:209–220.
Impedovo, D. and Pirlo, G. (2019). Online handwriting
analysis for the assessment of alzheimer’s disease and
parkinson’s disease: overview and experimental in-
vestigation. Frontiers In Pattern Recognition And Ar-
tificial Intelligence, pages 113–128.
Kamble, M., Shrivastava, P., and Jain, M. (2021). Digi-
tized spiral drawing classification for parkinson’s dis-
ease diagnosis. Measurement: Sensors, 16:100047.
Khatamino, P., Cant
¨
urk,
˙
I., and
¨
Ozyılmaz, L. (2018). A
deep learning-cnn based system for medical diagno-
sis: An application on parkinson’s disease handwrit-
ing drawings. In 2018 6th International Conference
on Control Engineering & Information Technology
(CEIT), pages 1–6. IEEE.
Kotsavasiloglou, C., Kostikis, N., Hristu-Varsakelis, D., and
Arnaoutoglou, M. (2017). Machine learning-based
classification of simple drawing movements in parkin-
son’s disease. Biomedical Signal Processing and Con-
trol, 31:174–180.
Krizhevsky, A., Sutskever, I., and Hinton, G. E. (2012). Im-
agenet classification with deep convolutional neural
networks. Advances in neural information processing
systems, 25.
Lahmiri, S. and Shmuel, A. (2019). Detection of parkin-
son’s disease based on voice patterns ranking and op-
Spiral Drawing Test and Explainable Convolutional Neural Networks for Parkinson’s Disease Detection
451

timized support vector machine. Biomedical Signal
Processing and Control, 49:427–433.
Letanneux, A., Danna, J., Velay, J.-L., Viallet, F., and Pinto,
S. (2014). From micrographia to parkinson’s disease
dysgraphia. Movement Disorders, 29(12):1467–1475.
Li, Z., Lin, Y., Elofsson, A., Yao, Y., et al. (2020). Protein
contact map prediction based on resnet and densenet.
BioMed research international, 2020.
Liu, T., Chen, T., Niu, R., and Plaza, A. (2021). Land-
slide detection mapping employing cnn, resnet, and
densenet in the three gorges reservoir, china. IEEE
Journal of Selected Topics in Applied Earth Observa-
tions and Remote Sensing, 14:11417–11428.
Mattison, H. A., Stewart, T., and Zhang, J. (2012). Apply-
ing bioinformatics to proteomics: Is machine learning
the answer to biomarker discovery for pd and msa?
Movement Disorders, 27(13):1595–1597.
Mercaldo, F. and Santone, A. (2021). Transfer learning for
mobile real-time face mask detection and localization.
Journal of the American Medical Informatics Associ-
ation, 28(7):1548–1554.
Poewe, W., Seppi, K., Tanner, C. M., Halliday, G. M.,
Brundin, P., Volkmann, J., Schrag, A.-E., and Lang,
A. E. (2017). Parkinson disease. Nature reviews Dis-
ease primers, 3(1):1–21.
Potgieser, A. R., Roosma, E., Beudel, M., de Jong, B. M.,
et al. (2015). The effect of visual feedback on writ-
ing size in parkinson’s disease. Parkinson’s Disease,
2015.
Rizzo, G., Copetti, M., Arcuti, S., Martino, D., Fontana,
A., and Logroscino, G. (2016). Accuracy of clinical
diagnosis of parkinson disease: a systematic review
and meta-analysis. Neurology, 86(6):566–576.
Rosenblum, S., Samuel, M., Zlotnik, S., Erikh, I., and
Schlesinger, I. (2013). Handwriting as an objective
tool for parkinson’s disease diagnosis. Journal of neu-
rology, 260:2357–2361.
San Luciano, M., Wang, C., Ortega, R. A., Yu, Q.,
Boschung, S., Soto-Valencia, J., Bressman, S. B.,
Lipton, R. B., Pullman, S., and Saunders-Pullman,
R. (2016). Digitized spiral drawing: A possible
biomarker for early parkinson’s disease. PloS one,
11(10):e0162799.
San-Segundo, R., Navarro-Hell
´
ın, H., Torres-S
´
anchez, R.,
Hodgins, J., and De la Torre, F. (2019). Increasing ro-
bustness in the detection of freezing of gait in parkin-
son’s disease. Electronics, 8(2):119.
Stanley, K., Hagenah, J., Br
¨
uggemann, N., Reetz, K., Sev-
ert, L., Klein, C., Yu, Q., Derby, C., Pullman, S.,
and Saunders-Pullman, R. (2010). Digitized spi-
ral analysis is a promising early motor marker for
parkinson disease. Parkinsonism & related disorders,
16(3):233–234.
Viteckova, S., Kutilek, P., Svoboda, Z., Krupicka, R.,
Kauler, J., and Szabo, Z. (2018). Gait symmetry mea-
sures: A review of current and prospective methods.
Biomedical Signal Processing and Control, 42:89–
100.
Zham, P., Arjunan, S. P., Raghav, S., and Kumar, D. K.
(2017a). Efficacy of guided spiral drawing in the
classification of parkinson’s disease. IEEE journal of
biomedical and health informatics, 22(5):1648–1652.
Zham, P., Kumar, D. K., Dabnichki, P., Poosapadi Arjunan,
S., and Raghav, S. (2017b). Distinguishing different
stages of parkinson’s disease using composite index of
speed and pen-pressure of sketching a spiral. Frontiers
in neurology, page 435.
Zhang, C., Benz, P., Argaw, D. M., Lee, S., Kim, J.,
Rameau, F., Bazin, J.-C., and Kweon, I. S. (2021).
Resnet or densenet? introducing dense shortcuts to
resnet. In Proceedings of the IEEE/CVF winter con-
ference on applications of computer vision, pages
3550–3559.
ICAART 2024 - 16th International Conference on Agents and Artificial Intelligence
452
