
Mapping Seismocardiogram Characteristics to Hemorrhage Status and
Vascular Pressure: A Novel Approach for Triage Assessment
Zeynep Deniz Gundogan
1
and Beren Semiz
2 a
1
Department of Electrical Engineering, Istanbul Technical University, Istanbul, Turkey
2
Department of Electrical and Electronics Engineering, Koc University, Istanbul, Turkey
Keywords:
Seismocardiogram, Hemorrhage, Vascular Pressure, Biomedical Signal Processing.
Abstract:
When a mass incident occurs, determining the severity of injuries and arranging the hospital triage are of great
importance to increase the survival rates. This study aims to develop a seismocardiogram (SCG)-based triage
assessment system by (i) distinguishing between different levels of exsanguination, and (ii) estimating the vas-
cular pressure values recorded from various body locations for prioritizing the triage processes and monitor-
ing vital parameters. In this project, publicly available Wearable and Catheter-based Cardiovascular Signals
During Progressive Exsanguination in a Porcine Model of Hemorrhage dataset, which includes cardiovascular
signals acquired through a catheter-based system and wearable sensors during progressive exsanguination, was
used. First, temporal and spectral features were extracted from the SCG signals taken at different blood-loss
levels from six Yorkshire swines. Hemorrhage severity assessment was then performed through multi-class
classification leveraging one vs. all approach. As the second step, four different regression models were
trained for each of the right atria, aortic root, femoral artery and pulmonary capillary locations to estimate
the corresponding vascular pressure values. For hemorrhage severity assessment, the accuracy, sensitivity,
precision and f1-score values were all calculated to be 0.96 for the best performing model (XGBoost). For
the vascular pressure estimation, (mean-absolute-error and R
2
) pairs were calculated to be (1.54, 0.94), (2.76,
0.58), (1.29, 0.87) and (0.95, 0.90) for aortic root, femoral artery, right atrium and pulmonary capillary models,
respectively. Overall, this study introduced new use areas for the SCG signal, which can potentially be utilized
in the development of continuous and non-invasive monitoring systems to prioritize the triage processes and
track vital parameters.
1 INTRODUCTION
When a mass incident, such as an earthquake or pub-
lic transport accident, occurs, determining the sever-
ity of injuries and arranging the hospital triage (i.e.
order of treatment) are of great importance to increase
the survival rates. Considering that the number of first
responders and provided resources are limited, pro-
viding immediate and timely treatment to all victims
is often not possible. Additionally, it is extremely
important to monitor and detect deterioration risks
in health status for preventing any follow-up com-
plications. Therefore, there is a need for innovative
approaches that can offer continuous hemodynamic
monitoring to enable appropriate triage assessment.
As physiological signals emerge directly from the
body, they hold valuable clinical information about
the underlying physiological conditions and irreg-
a
https://orcid.org/0000-0002-7544-5974
ularities. In wearable device design, three of the
most commonly used physiological signals can be
listed as the electrocardiogram (ECG), photoplethys-
mogram (PPG), and seismocardiogram (SCG) wave-
forms. The SCG represents the mechanical activity of
the heart resulting from the cardiac ejection and con-
traction, whereas the ECG acquires the electrical sig-
nal of the heart to assess rhythm and rate (Inan et al.,
2014). Recent studies have shown that SCG signal
can potentially be used in heart failure classification
(Inan et al., 2018), myocardial contraction assessment
(Tavakolian et al., 2012), respiration phase analysis
(Imirzalioglu and Semiz, 2022; Pandia et al., 2012),
valvular heart disease assessment (Erin and Semiz,
2023), metabolic equivalent of task score estimation
(Tokmak and Semiz, 2022), systolic time interval and
hemodynamic parameter estimation (Shandhi et al.,
2019; Semiz et al., 2020). On the other hand, fluc-
tuations in arterial blood volume during the cardiac
646
Gundogan, Z. and Semiz, B.
Mapping Seismocardiogram Characteristics to Hemorrhage Status and Vascular Pressure: A Novel Approach for Triage Assessment.
DOI: 10.5220/0012406700003657
Paper published under CC license (CC BY-NC-ND 4.0)
In Proceedings of the 17th International Joint Conference on Biomedical Engineering Systems and Technologies (BIOSTEC 2024) - Volume 1, pages 646-655
ISBN: 978-989-758-688-0; ISSN: 2184-4305
Proceedings Copyright © 2024 by SCITEPRESS – Science and Technology Publications, Lda.

cycle cause variations in the light absorption within
the arteries, leading to the generation of PPG. Indeed,
previous studies have shown that blood pressure, oxy-
gen saturation and vascular resistance assessment can
highly benefit from PPG analysis (cheol Jeong et al.,
2018).
Among these signals, the researchers have re-
cently found that the SCG signal is the most important
modality in predicting decomposition (Kimball et al.,
2021). Although there have been several studies on
electronic triage tag development leveraging breath-
ing rate, oxygen saturation, blood pressure, temper-
ature, and heart rate assessment (Sakanushi et al.,
2013; Rodriguez et al., 2014; Park, 2021; Gr
¨
unerbel
et al., 2023), there is no study focusing on the assess-
ment of different levels of blood loss and correspond-
ing vascular pressure values using solely the SCG sig-
nals. Hence, in this work, the fundamental aims were
to investigate the relationship between blood loss lev-
els and SCG signals, and to map the SCG signal char-
acteristics to the vascular pressure values recorded
from various body locations for prioritizing the triage
processes and monitoring vital parameters.
The contributions of this study are threefold: For
the first time, (i) SCG signal characteristics have been
leveraged to distinguish between different levels of
exsanguination, which can potentially accelerate the
triage processes, (ii) SCG signal characteristics have
been used to estimate the femoral artery, aortic root,
right atrium and pulmonary capillary wedge pressure
values to achieve continuous vascular pressure moni-
toring, (iii) it has been shown that the temporal char-
acteristics of the SCG signal has relatively higher im-
portance compared to the spectral ones in the case
of hemorrhage assessment. Overall, the study intro-
duces new use areas for the SCG signal, which can
potentially be utilized in the development of continu-
ous and non-invasive monitoring systems to prioritize
the triage processes and track vital parameters.
2 MATERIALS AND METHODS
2.1 Dataset Description
2.1.1 Experimental Protocol
In this project, publicly available Wearable and
Catheter-based Cardiovascular Signals During Pro-
gressive Exsanguination in a Porcine Model of
Hemorrhage dataset was used (Zia et al., 2020a).
The dataset contains cardiovascular signals acquired
through a catheter-based system and wearable sensors
during progressive exsanguination in a porcine model
of hemorrhage. The signals from the wearable sen-
sors (seismocardiogram, electrocardiogram and pho-
toplethysmogram) were acquired through BIOPAC
MP160 system (BIOPAC Systems, Inc., Goleta, CA,
USA). On the other hand, vascular pressure values
from the aortic arch, femoral artery, right atrium and
pulmonary capillary locations were collected with the
catheter-based setup. Data from the catheters were
acquired through the ADInstruments Powerlab 8/35
system. All signals were sampled at 2 kHz.
The study was conducted on 6 Yorkshire swines
(3 castrated female, 3 male, weight: 51.5-71.4 kg,
age: 114-150 days). Each swine underwent a health
assessment examination and no other exclusion crite-
ria was designated in the study. Anesthesia was ad-
ministered with xylazine and telazol, and sustained
via inhaled isoflurane during mechanical ventilation.
During the experimental protocol, blood was drained
through an arterial line at four levels (7%, 14%, 21%,
and 28%) to induce hypovolemia. After every stage
of blood loss, the process of exsanguination was tem-
porarily halted for nearly 5-10 minutes so that the
cardiovascular functions could return to normal. It
should be noted that the experimental protocol was
terminated at different blood levels for each pig as
cardiovascular collapse was reached at different lev-
els. More specifically, pig 5 reached 14% blood vol-
ume loss; pigs 1, 3, and 4 reached 21% blood volume
loss; and pigs 2 and 6 reached 28% blood volume loss.
These levels were visualized in Fig. 1(b).
2.1.2 Pre-Processing and Data Preparation
First, the signals were filtered with finite impulse re-
sponse (FIR) band-pass filters with the following cut-
off frequencies: SCG (1-40 Hz), ECG (0.5-40 Hz),
PPG and catheter-based pressure signals (0.5-10 Hz).
The signals were then segmented into individual beats
using the R-peak locations of the ECG signal. Re-
sulting segments were truncated into a length of 1000
samples (500 ms), except the third pig (1500 samples,
750 ms) due to relatively longer left ventricular ejec-
tion time. The catheter-based pressure signals were
also truncated in a similar way.
Analysis pipeline is presented in Fig. 1(a). Two
different analyses, hemorrhage severity assessment
and vascular pressure estimation, were performed us-
ing the SCG signals taken from the dorso-ventral axis.
For hemorrhage severity assessment, blood-loss lev-
els at the time of each SCG beat were available as
a separate vector. For the vascular pressure estima-
tion analysis, the average of 1000 pressure samples
was taken to have one single value for each pressure
location. By this way, each SCG beat could be rep-
resented by one pressure value for each of the aortic
Mapping Seismocardiogram Characteristics to Hemorrhage Status and Vascular Pressure: A Novel Approach for Triage Assessment
647
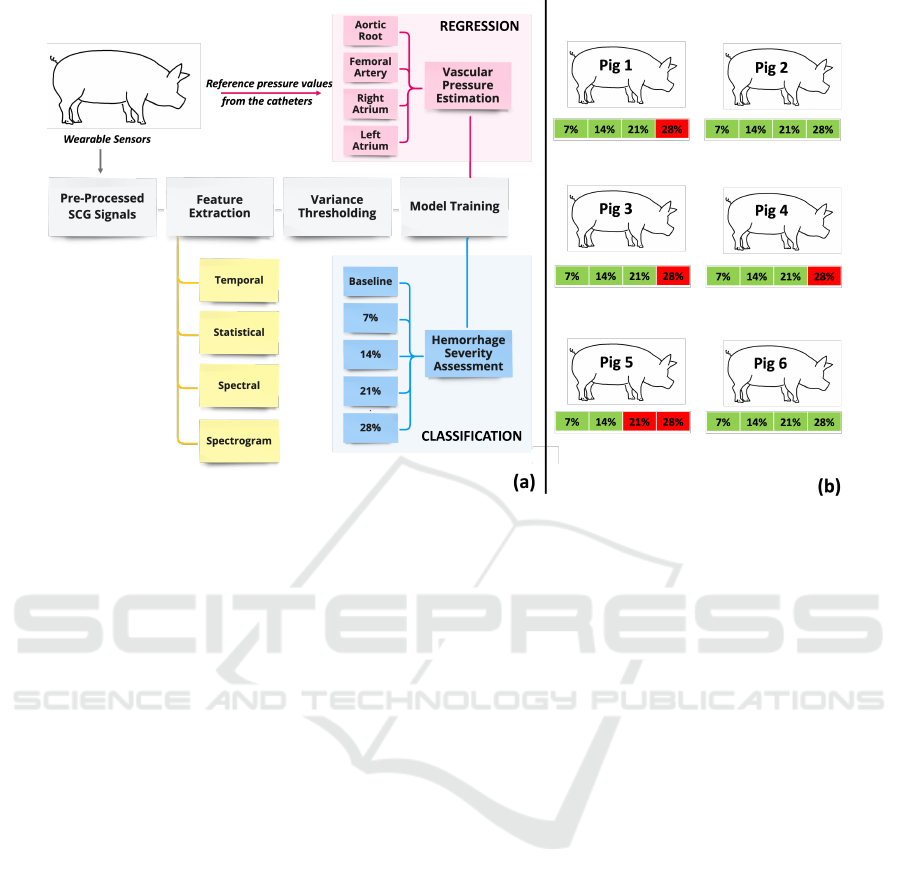
Figure 1: (a) Analysis pipeline (b) Green color: Blood loss levels that the pigs could reach, Red color: Blood loss levels that
the pigs could not reach due to cardiovascular collapse.
arch, femoral artery, right atrium and pulmonary cap-
illary locations.
2.2 Feature Extraction
Based on the previous studies, SCG analysis can
highly benefit from time domain analysis, as val-
leys and peaks correspond to specific cardiovascular
events in cardiac cycle (such as mitral closing (MC),
aortic opening (AO), etc.) (Semiz et al., 2020). On the
other hand, recent studies have revealed that spectral
content of the SCG signals also contains salient in-
formation regarding underlying physiological events
and pathologies (Erin and Semiz, 2023). Hence, each
SCG signal segment was analyzed both in temporal
and spectral domains. The sets of features are detailed
in the following subsections.
2.2.1 Temporal Domain Analysis
For temporal domain analysis, energy, zero crossing
rate, entropy and peak-location features were com-
puted for each SCG segment. While energy corre-
sponds to the total energy (i.e. sum of squared mag-
nitudes of the samples), energy entropy assesses the
abrupt changes observed in the signal energy. On
the other hand, zero crossing rate measures the sign-
change rate and used to evaluate the overall noise
level. In addition to these three temporal features, the
first three minima and maxima locations and ampli-
tudes were computed. This step resulted in an ad-
ditional 12 features (6 amplitude and 6 location val-
ues). In the analysis, the valleys and peaks were
not associated with particular cardiac events such as
AO, MC, etc. This is due to two reasons - first, the
SCG signals exhibit significant variability among dif-
ferent subjects, making it challenging to detect those
points precisely. Second, the shape of the SCG sig-
nal changes depending on the sensor’s location or the
subject’s posture (Hersek et al., 2019).
Additionally, statistical features were calculated
for each segment. As statistical features, mean, root
mean square, variance, satandard deviation, skewness
and kurtosis were extracted. After computing the
aforementioned features, a matrix T
i
was generated
for time domain features where each row corresponds
to one segment, i, and each column represents one
feature for each segment i. Overall, there were 21
temporal features extracted from each segment.
2.2.2 Spectral Domain Analysis
Following temporal analysis, spectral analysis was
performed on the SCG segments. To that aim, spec-
tral entropy, rolloff, spread and centroid values were
computed for each segment i. While spectral entropy
represents the complexity of the spectrum rolloff cor-
responds to the frequency below which a certain per-
centage of the signal energy is accumulated. Con-
versely, spectral centroid and spread pertain to the
BIOSIGNALS 2024 - 17th International Conference on Bio-inspired Systems and Signal Processing
648

center of mass and frequency distribution of the spec-
trum, respectively.
In addition to the aforementioned four spectral
features, spectrogram analysis was employed. Spec-
trogram is used to investigate how the frequency
characteristics of a non-stationary signal change with
time. As the original function outputs frequency, time
and coefficient values together, the average coeffi-
cients for each frequency band were computed over
time and then stored as a vector. In total 129 spec-
trogram coefficients were extracted from each seg-
ment. After computing the aforementioned features, a
matrix S
i
was generated for spectral domain features
where each row corresponds to one segment, i, and
each column represents one feature for each segment
i. Overall, there were 133 spectral features extracted
from each segment.
2.2.3 Dataframe Generation
In total, there were 154 features (21 temporal and
133 spectral) extracted from each SCG segment. For
convenience of feature selection and model training,
one single data frame was created using these fea-
tures. In the dataframe, each row was correspond-
ing to one SCG segment i, whereas the columns
were including the extracted features (time domain
T
i
and spectral domain S
i
matrices). In addition to
the feature columns, five additional columns were
added to include blood-loss level labels (b
i
) and
the reference aortic root (p1
i
), femoral artery (p2
i
),
right atria (p3
i
) and pulmonary capillary wedge (p4
i
)
pressure values. Blood-loss levels were determined
as 0, 1, 2, 3, 4 representing 0% (baseline), 7%,
14%, 21%, and 28% blood-loss levels, respectively.
Overall, the dataframe was structured as follows:
[T
i
, S
i
, b
i
, p1
i
, p2
i
, p3
i
, p4
i
].
2.2.4 Variance Thresholding
To prevent curse of dimensionality caused by high
number of features, feature selection was applied on
the 154 features extracted. As the feature selection
method, variance thresholding, which seeks to elim-
inate features with variance values that fall below a
specific threshold, was chosen. Since any feature’s
variance and level of predictive ability are correlated,
features with smaller variance convey relatively less
information (Bommert et al., 2020). In accordance
with the previous study, threshold value was deter-
mined as 0.0001 (Erin and Semiz, 2023). Features be-
low this threshold were masked as False and dropped,
whereas the remaining features (which were above
the threshold) were masked as True and kept in the
analysis.
2.3 Model Training
Under model training, two different tasks were im-
plemented: hemorrhage severity assessment and vas-
cular pressure estimation. As detailed in Sec. 2.2.3,
for hemorrhage severity classification, blood-loss lev-
els were determined as 0, 1, 2, 3, 4 representing 0%
(baseline), 7%, 14%, 21%, and 28% blood-loss lev-
els, respectively. On the other hand, for vascular
pressure estimation, four different regression models
were trained for each of the aortic root, right atrium,
femoral artery and pulmonary capillary wedge pres-
sure estimation tasks. Both for hemorrhage sever-
ity assessment and vascular pressure assessment, four
different models were trained and corresponding per-
formance values were compared. It should be noted
that machine learning models were leveraged instead
of deep learning approaches due to the limited sample
size.
• Multi Layer Perceptron (MLP): MLP falls un-
der artificial neural networks composed of multi-
ple layers of neurons (i.e., nodes), which are inter-
connected via weighted connections. From input
layer to output layer, hidden layers perform com-
plex transformations on the data. More specif-
ically, each neuron in hidden layers computes
weighted sum of the inputs, employs non-linear
activation function and transfers the result to the
following layer. The weights of these neuron con-
nections are learned and updated during training
through back-propagation (Bishop et al., 1995).
• Support Vector Machines (SVM): SVM aims to
find the best separating hyperplane while maxi-
mizing the margin between the classes. In this
context, the margin corresponds to the distance
between the hyperplane and closest data points
from different classes. SVM can also be used
in regression tasks where the aim is to find the
best hyperplane that minimizes the sum of the
distances between the predicted and actual values
(Noble, 2006).
• Random Forest (RF): RF is a type of ensemble
methods where instead of using a single tree, it in-
volves generating multiple trees by randomly se-
lecting subsets from the original dataset. These
trees are trained separately and in parallel, and
their individual predictions are combined by av-
eraging them to produce the final predicted target
value (Breiman, 2001).
• Extreme Gradient Boosting (XGBoost): XG-
Boost also belongs to the ensemble methods cat-
egory, more specifically the gradient boosting al-
gorithm. This approach involves using multiple
Mapping Seismocardiogram Characteristics to Hemorrhage Status and Vascular Pressure: A Novel Approach for Triage Assessment
649

estimators simultaneously instead of a single esti-
mator to predict a variable. The algorithm trains
numerous decision trees in a sequential manner,
enabling the model to forecast the leftover errors
from the previous round and enhance its perfor-
mance progressively (Chen and Guestrin, 2016;
Friedman, 2001).
2.3.1 Hemorrhage Severity Assessment
In the classification task, the idea was to assess the
performance of the features extracted from the SCG
signal in distinguishing between different blood loss
levels. Using the features remained following vari-
ance thresholding, four different classification mod-
els were trained using MLP, SVM, RF and XGBoost.
As explained in Section 2.1.1 and Fig. 1(b), the ex-
perimental protocol was terminated at different blood
levels as each pig reached cardiovascular collapse at
different levels. While pigs 1, 3, and 4 reached 21%
blood volume loss, pigs 2 and 6 could reach 28%
blood volume loss, and pig 5 could only reach 14%
blood volume loss. Thus, there was an imbalance
within the dataset: pigs 2 and 6 indeed had data corre-
sponding to each phase, whereas the other pigs were
missing one or two labels. Hence, instead of building
a leave-one-subject-out cross-validation framework,
k-fold cross validation was employed during model
training to prevent the bias that will occur across
folds.
The data was first split into k number of sub-
groups (folds). In each iteration, one fold was left
out for testing and the model was trained with the
remaining (k-1) folds. The iterations continued un-
til every split was used for testing. In this project,
k was set to 5. On the other hand, the depth value
used in XGBoost and RF classifiers were chosen as
10 through grid search. Indeed this value was in ac-
cordance with the one used in (Zia et al., 2020b). For
severity classification, one vs. all approach was lever-
aged and the models’ performance was assessed using
accuracy, recall, precision and f1-scores. The corre-
sponding equations were listed in Equations 1, 2, 3,
4, respectively (TN: true negatives, TP: true positives,
FN: false negatives, FP: false positives).
Accuracy =
T P + T N
T P + T N + FP + FN
(1)
Recall =
T P
T P + FN
(2)
Precision =
T P
T P + FP
(3)
f
1
score = 2 ∗
precision ∗ recall
precision + recall
(4)
2.3.2 Vascular Pressure Estimation
In the regression part, the relationship between the
catheter-based pressure values and SCG-based fea-
tures was examined. Similar to the classification task,
MLP, SVM, RF and XGBoost were used to estimate
the vascular pressures from different locations. Model
validation was again employed through 5-fold cross
validation and the depth value used in XGBoost and
RF regressors were determined using grid search. The
best option for right atrium pressure, aortic root pres-
sure, and pulmonary capillary wedge pressure was
found to be 10, whereas the best depth option for
femoral artery pressure was determined as 8. The
performance of the regressors was evaluated through
mean absolute error (MAE) and coefficient of deter-
mination (R
2
) metrics. The corresponding equations
were listed in Equations 5 and 6, respectively (y
true
:
actual values, y
pred
: predicted values, y
mean
: mean of
the actual values).
MAE =
∑
n
i=1
|y
pred,i
− y
true,i
|
n
(5)
R
2
= 1 −
∑
n
i=1
(y
true,i
− y
pred,i
)
2
∑
n
i=1
(y
true,i
− y
mean
)
2
(6)
2.4 Feature Importance Ranking
To gain a better understanding of which features are
most important for classification, it is necessary to
calculate the relative weight of each feature in the
model. This can directly be achieved through the use
of decision trees trained by the XGBoost classifier as
the features to split are determined based on the great-
est reduction in loss. Each decision tree ranks the fea-
tures based on their importance in the resulting clas-
sification algorithm. After running all the trees in the
model, the relative importance of the features can thus
be determined by averaging the importance scores ob-
tained from each tree. These scores are then used to
obtain the final relative feature importance ranking.
As the best performing model was XGBoost, it
was used to evaluate which features among the re-
maining ones were most relevant for distinguishing
between different blood loss levels. To that aim, a
second XGBoost classifier was trained, this time us-
ing data from all pigs. The resulting model was then
used to calculate the feature importance scores. Since
the objective was not to assess the model’s ability to
generalize, no separate testing set was required.
BIOSIGNALS 2024 - 17th International Conference on Bio-inspired Systems and Signal Processing
650
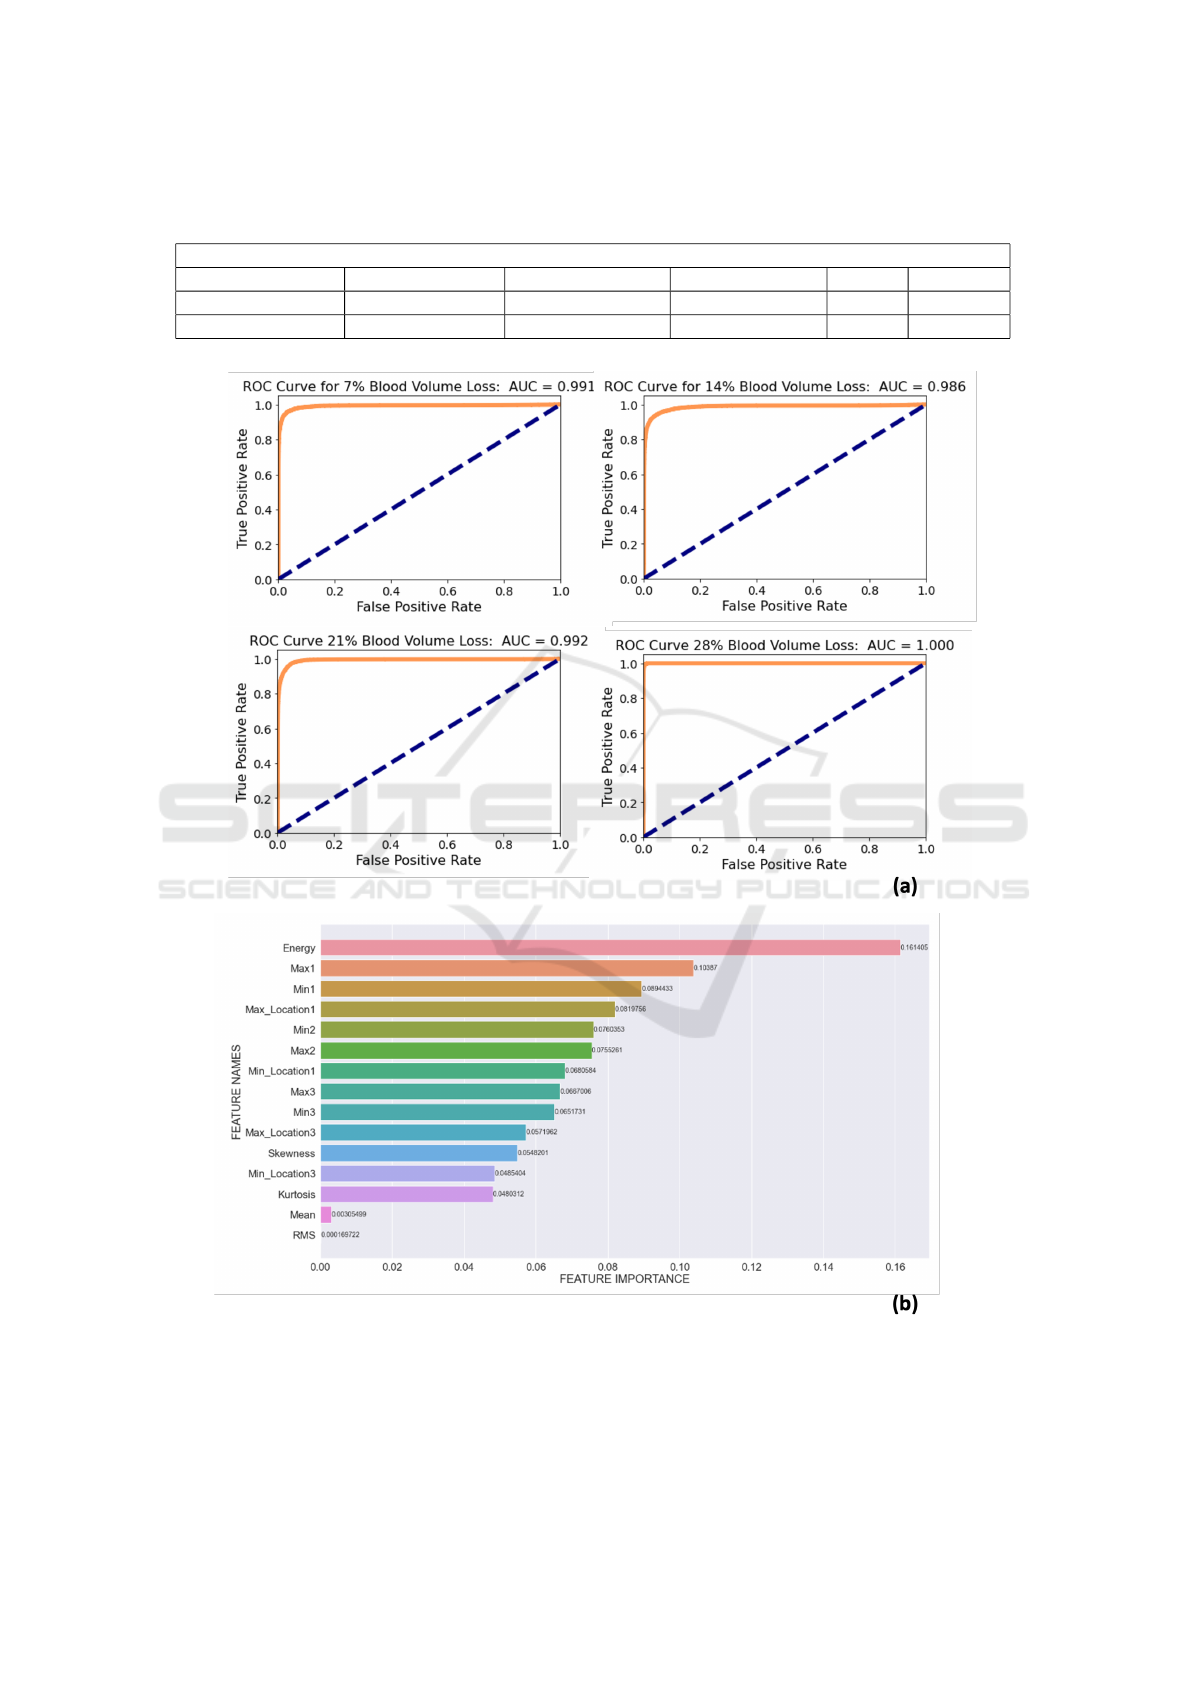
Table 1: Remaining features after variance thresholding (max: maximum, min: minimum, amp: amplitude, loc: location, rms:
root mean square).
Remaining 17 Features
First Max Amp First Max Loc First Min Amp First Min Loc Energy Skewness
Second Max Amp Second Max Loc Second Min Amp Second Min Loc RMS Kurtosis
Third Max Amp Third Max Loc Third Min Amp Third Min Loc Mean
Figure 2: (a) Receiver Operating Characteristic (ROC) Curves for different blood volume loss stages. (b) Normalized feature
importance values for the first 15 features out of 17 (max: maximum, min: minimum, amp: amplitude, rms: root mean square).
Mapping Seismocardiogram Characteristics to Hemorrhage Status and Vascular Pressure: A Novel Approach for Triage Assessment
651

Table 2: Performance metrics for different machine learning models.
Classification (Accuracy)
Random Forest XGBoost MLP SVM
Blood-Level Classification 0.92 0.96 0.55 0.45
Regression (R
2
)
Random Forest XGBoost MLP SVM
Right Atrium Pressure 0.86 0.87 0.56 0.24
Aortic Root Pressure 0.90 0.94 0.56 0.25
Femoral Artery Pressure 0.60 0.58 0.32 0.14
Pulmonary Capillary Wedge Pressure 0.85 0.90 0.34 0.21
Table 3: XGBoost classification and regression results.
XGBoost Classification
Accuracy Precision Recall F1-Score
Blood-Level Classification
0.96 0.96 0.96 0.96
XGBoost Regression
R
2
Mean Absolute Error
Right Atrium Pressure
0.87 1.29
Aortic Root Pressure
0.94 1.54
Femoral Artery Pressure
0.58 2.76
Pulmonary Capillary Wedge Pressure
0.90 0.95
3 RESULTS
3.1 Feature Selection with Variance
Thresholding
In this project, both temporal and spectral domain
analyses were leveraged as previous studies have
shown the success of each in various applications.
In total there were 154 features and this number de-
creased to 17 following variance thresholding. The
remaining features are presented in Table 1. As seen,
only the temporal ones, i.e. time domain and statis-
tical features, appeared in the remaining 17 features
and none of the spectral features were included in the
resulting set.
3.2 Hemorrhage Severity Assessment
As detailed in Section 2.3.1, four classification mod-
els were trained using the remaining 17 features for
hemorrhage severity assessment. The models’ perfor-
mance was first evaluated with the accuracy metric.
As reported in Table 2, RF, XGBoost, MLP and SVM
models resulted in an accuracy of 0.92, 0.96, 0.55 and
0.45, respectively. Out of the four models, XGBoost
was found to be the best performing one. For the XG-
Boost classifier, each of the accuracy, recall, preci-
sion and f1-score was also calculated to be 0.96, as
reported in Table 3.
To investigate how the model behaves for differ-
ent threshold values, receiver operating characteristic
(ROC) curve for each blood level was plotted. For
7%, 14%, 21% and 28% blood loss levels, the area un-
der curve (AUC) values were calculated to be 0.991,
0.986, 0.992 and 1.000, respectively (Fig. 2(a)).
3.3 Vascular Pressure Estimation
Under the vascular pressure estimation task, regres-
sion models were trained for each of the aortic root,
femoral artery, right atrium and pulmonary capillary
wedge pressure values. For each location, four dif-
ferent models, RF, XGBoost, MLP and SVM were
leveraged similar to the classification task. For the
right atrium, aortic root and pulmonary capillary lo-
cations, XGBoost resulted in the best accuracy val-
ues (0.87, 0.94 and 0.90, respectively). On the other
hand, for the femoral artery pressure estimation, RF
slightly outperformed XGBoost (0.60 vs. 0.58). Still,
XGBoost was selected as the final model for all four
locations. As presented in Table 3, MAE values were
calculated to be 1.29, 1.54, 2.76 and 0.95 for right
atrium, aortic root, femoral artery and pulmonary cap-
illary models, respectively. The scatter plots repre-
senting the predicted and actual vascular pressure val-
ues with the corresponding R
2
results are presented in
Fig. 3.
BIOSIGNALS 2024 - 17th International Conference on Bio-inspired Systems and Signal Processing
652
Figure 3: Regression plots for each pressure location. Black lines correspond to the best fit lines.
3.4 Feature Importance Ranking
As explained in Section 2.4, feature importance rank-
ing was applied using the XGBoost model on the re-
maining 17 temporal features. The normalized impor-
tance scores of the first fifteen out of seventeen fea-
tures are shown in Fig. 2(b). As seen, energy, first
maximum amplitude (Max 1) and first minimum am-
plitude (Min 1) appeared as the top three most im-
portant features. On the other hand, the statistical
features appeared in the lower end on the importance
ranking.
4 DISCUSSION
4.1 Model Training and Interpretation
Both for the hemorrhage severity assessment and
vascular pressure estimation tasks, 5-fold cross-
validation was leveraged instead of leave-one-subject-
out cross-validation (LOSO-CV). Since the pigs
reached cardiovascular collapse at different blood-
loss levels, some pigs did not have any data relating to
21% or 28% blood loss, as previously shown in Fig.
1(a). Due to this imbalance, the models would not be
able to learn properly if LOSO-CV was used; hence,
5-fold cross-validation was employed in all tasks.
Overall, for both classification and regression
tasks, high performance metrics were obtained.
Among different vascular pressure values, the worst
performing model was the one estimating the femoral
Mapping Seismocardiogram Characteristics to Hemorrhage Status and Vascular Pressure: A Novel Approach for Triage Assessment
653

artery pressure. Considering that the accelerometer
acquiring the SCG signal was placed on the mid-
sternum of the pig, femoral artery was at a rela-
tively distal location compared to remaining three
pressure locations. Indeed, when the pressure mea-
surements are taken further from the aorta, a rela-
tively higher systolic pressure, lower end diastolic
pressure and later arrival of pulse have been observed
(Chambers et al., 2019). Hence, collecting the SCG
signals from the mid-sternum and trying to estimate
femoral artery pressure would naturally be prone to
more intra-subject variability compared to other three
locations.
4.2 Feature Interpretation
As previously explained, the temporal features out-
performed spectral features in terms of relative impor-
tance in hemorrhage assessment. Having amplitude-
related features as the most important ones was indeed
consistent with the underlying physiological events.
It has previously been shown that there is salient in-
formation regarding stroke volume in SCG amplitude
characteristics as the SCG signal represents the local
vibrations originating from ejection of blood in each
contraction (Semiz et al., 2020). Similarly, in another
study, it has been shown that the percent change in
post-hemorrhage cardiac output and percent reduc-
tion in blood volume had a linear relationship (Chien
and Billig, 1961). Based on these studies, having am-
plitude features as the most important ones in distin-
guishing between different blood-loss levels was in-
deed consistent with the literature.
4.3 Limitations and Future Work
There were several limitations in the proposed work.
First, the dataset size was relatively small (including
6 pigs). In addition, there was an imbalance in the
number of samples available for each blood-loss level
as the experimental protocol was terminated at differ-
ent blood levels for each pig. Hence, future work will
focus on testing the proposed features and pipelines
in larger datasets for assessing the generalizability of
the models.
5 CONCLUSION
The main objectives of this study were to explore
how blood loss levels relate to the SCG signals, and
to establish a correlation between the characteristics
of SCG signals and the vascular pressure values ob-
tained from various parts of the body. It was hypoth-
esized that such a system could be useful in prioritiz-
ing triage processes and monitoring critical parame-
ters. For hemorrhage severity classification, SCG data
taken during different blood loss levels were classi-
fied using one vs. all approach. Each of the precision,
recall and f1-score was calculated to be 0.96, and tem-
poral features outperformed spectral ones in terms of
added information. On the other hand, for vascular
pressure assessment, MAE values were calculated to
be 1.29, 1.54, 2.76 and 0.95 for right atrium, aortic
root, femoral artery and pulmonary capillary models,
respectively. Out of these pressure locations, femoral
artery pressure estimation resulted in the worst per-
formance with an R
2
value of 0.58 due to its distal lo-
cation relative to mid-sternum. Overall, this study in-
troduced new use areas for the SCG signal, which can
be utilized in the development of continuous and non-
invasive monitoring systems to prioritize the triage
processes and track vital parameters.
REFERENCES
Bishop, C. M. et al. (1995). Neural networks for pattern
recognition. Oxford university press.
Bommert, A., Sun, X., Bischl, B., Rahnenf
¨
uhrer, J., and
Lang, M. (2020). Benchmark for filter methods
for feature selection in high-dimensional classifica-
tion data. Computational Statistics & Data Analysis,
143:106839.
Breiman, L. (2001). Random forests. Machine learning,
45:5–32.
Chambers, D., Huang, C., and Matthews, G. (2019). Arte-
rial Pressure Waveforms, page 155–157. Cambridge
University Press, 2 edition.
Chen, T. and Guestrin, C. (2016). Xgboost: A scalable
tree boosting system. In Proceedings of the 22nd acm
sigkdd international conference on knowledge discov-
ery and data mining, pages 785–794.
cheol Jeong, I., Bychkov, D., and Searson, P. C. (2018).
Wearable devices for precision medicine and health
state monitoring. IEEE Transactions on Biomedical
Engineering, 66(5):1242–1258.
Chien, S. and Billig, S. (1961). Effect of hemorrhage on
cardiac output of sympathectomized dogs. American
Journal of Physiology-Legacy Content, 201(3):475–
479.
Erin, E. and Semiz, B. (2023). Spectral analysis of cardio-
genic vibrations to distinguish between valvular heart
diseases.
Friedman, J. H. (2001). Greedy function approximation: a
gradient boosting machine. Annals of statistics, pages
1189–1232.
Gr
¨
unerbel, L., Heinrich, F., Zett, O., Axelsson, K., and
Schumann, M. (2023). Towards an intelligent triage
bracelet: A conceptual study of a semi-automated pre-
BIOSIGNALS 2024 - 17th International Conference on Bio-inspired Systems and Signal Processing
654

hospital triage algorithm and the integration of blood
pressure measurement.
Hersek, S., Semiz, B., Shandhi, M. M. H., Orlandic, L.,
and Inan, O. T. (2019). A globalized model for map-
ping wearable seismocardiogram signals to whole-
body ballistocardiogram signals based on deep learn-
ing. IEEE journal of biomedical and health informat-
ics, 24(5):1296–1309.
Imirzalioglu, M. and Semiz, B. (2022). Quantifying respira-
tion effects on cardiac vibrations using teager energy
operator and gradient boosted trees. In 2022 44th An-
nual International Conference of the IEEE Engineer-
ing in Medicine & Biology Society (EMBC), pages
1935–1938. IEEE.
Inan, O. T., Baran Pouyan, M., Javaid, A. Q., Dowling, S.,
Etemadi, M., Dorier, A., Heller, J. A., Bicen, A. O.,
Roy, S., De Marco, T., et al. (2018). Novel wearable
seismocardiography and machine learning algorithms
can assess clinical status of heart failure patients. Cir-
culation: Heart Failure, 11(1):e004313.
Inan, O. T., Migeotte, P.-F., Park, K.-S., Etemadi, M.,
Tavakolian, K., Casanella, R., Zanetti, J., Tank, J.,
Funtova, I., Prisk, G. K., et al. (2014). Ballistocardio-
graphy and seismocardiography: A review of recent
advances. IEEE journal of biomedical and health in-
formatics, 19(4):1414–1427.
Kimball, J. P., Zia, J. S., An, S., Rolfes, C., Hahn, J.-O.,
Sawka, M. N., and Inan, O. T. (2021). Unifying the
estimation of blood volume decompensation status in
a porcine model of relative and absolute hypovolemia
via wearable sensing. IEEE Journal of Biomedical
and Health Informatics, 25(9):3351–3360.
Noble, W. S. (2006). What is a support vector machine?
Nature biotechnology, 24(12):1565–1567.
Pandia, K., Inan, O. T., Kovacs, G. T., and Giovangrandi, L.
(2012). Extracting respiratory information from seis-
mocardiogram signals acquired on the chest using a
miniature accelerometer. Physiological measurement ,
33(10):1643.
Park, J. Y. (2021). Real-time monitoring electronic triage
tag system for improving survival rate in disaster-
induced mass casualty incidents. In Healthcare, vol-
ume 9, page 877. MDPI.
Rodriguez, D., Heuer, S., Guerra, A., Stork, W., Weber, B.,
and Eichler, M. (2014). Towards automatic sensor-
based triage for individual remote monitoring dur-
ing mass casualty incidents. In 2014 IEEE interna-
tional conference on bioinformatics and biomedicine
(BIBM), pages 544–551. IEEE.
Sakanushi, K., Hieda, T., Shiraishi, T., Ode, Y., Takeuchi,
Y., Imai, M., Higashino, T., and Tanaka, H. (2013).
Electronic triage system for continuously monitoring
casualties at disaster scenes. Journal of Ambient Intel-
ligence and Humanized Computing, 4:547–558.
Semiz, B., Carek, A. M., Johnson, J. C., Ahmad, S.,
Heller, J. A., Vicente, F. G., Caron, S., Hogue, C. W.,
Etemadi, M., and Inan, O. T. (2020). Non-invasive
wearable patch utilizing seismocardiography for peri-
operative use in surgical patients. IEEE journal of
biomedical and health informatics, 25(5):1572–1582.
Shandhi, M. M. H., Semiz, B., Hersek, S., Goller, N.,
Ayazi, F., and Inan, O. T. (2019). Performance
analysis of gyroscope and accelerometer sensors for
seismocardiography-based wearable pre-ejection pe-
riod estimation. IEEE journal of biomedical and
health informatics, 23(6):2365–2374.
Tavakolian, K., Portacio, G., Tamddondoust, N. R., Jahns,
G., Ngai, B., Dumont, G. A., and Blaber, A. P. (2012).
Myocardial contractility: A seismocardiography ap-
proach. In 2012 Annual International Conference of
the IEEE Engineering in Medicine and Biology Soci-
ety, pages 3801–3804. IEEE.
Tokmak, F. and Semiz, B. (2022). Unveiling the relation-
ships between seismocardiogram signals, physical ac-
tivity types and metabolic equivalent of task scores.
IEEE Transactions on Biomedical Engineering.
Zia, J., Kimball, J., Hahn, J.-O., Rolfes, C., and Inan, O.
(2020a). Wearable- and catheter-based cardiovascular
signals during progressive exsanguination in a porcine
model of hemorrhage.
Zia, J., Kimball, J., Rolfes, C., Hahn, J.-O., and Inan, O. T.
(2020b). Enabling the assessment of trauma-induced
hemorrhage via smart wearable systems. Science ad-
vances, 6(30):eabb1708.
Mapping Seismocardiogram Characteristics to Hemorrhage Status and Vascular Pressure: A Novel Approach for Triage Assessment
655
