
DGDNN: Decoupled Graph Diffusion Neural Network for Stock
Movement Prediction
Zinuo You
1
, Zijian Shi
1
, Hongbo Bo
1,3
, John Cartlidge
2
, Li Zhang
4
and Yan Ge
2
1
School of Computer Science, University of Bristol, Bristol, U.K.
2
School of Engineering Mathematics and Technology, University of Bristol, Bristol, U.K.
3
NIHR Innovation Observatory, Population Health Sciences Institute, Newcastle University, Newcastle, U.K.
4
Department of Engineering Science, University of Oxford, U.K.
Keywords:
Stock Prediction, Graph Neural Network, Graph Structure Learning, Information Propagation.
Abstract:
Forecasting future stock trends remains challenging for academia and industry due to stochastic inter-stock dy-
namics and hierarchical intra-stock dynamics influencing stock prices. In recent years, graph neural networks
have achieved remarkable performance in this problem by formulating multiple stocks as graph-structured
data. However, most of these approaches rely on artificially defined factors to construct static stock graphs,
which fail to capture the intrinsic interdependencies between stocks that rapidly evolve. In addition, these
methods often ignore the hierarchical features of the stocks and lose distinctive information within. In this
work, we propose a novel graph learning approach implemented without expert knowledge to address these
issues. First, our approach automatically constructs dynamic stock graphs by entropy-driven edge generation
from a signal processing perspective. Then, we further learn task-optimal dependencies between stocks via
a generalized graph diffusion process on constructed stock graphs. Last, a decoupled representation learning
scheme is adopted to capture distinctive hierarchical intra-stock features. Experimental results demonstrate
substantial improvements over state-of-the-art baselines on real-world datasets. Moreover, the ablation study
and sensitivity study further illustrate the effectiveness of the proposed method in modeling the time-evolving
inter-stock and intra-stock dynamics.
1 INTRODUCTION
The stock market has long been an intensively dis-
cussed research topic by investors pursuing profitable
trading opportunities and policymakers attempting to
gain market insights. Recent research advancements
have primarily concentrated on exploring the poten-
tial of deep learning models, driven by their ability
to model complex non-linear relationships (Bo et al.,
2023) and automatically extract high-level features
from raw data (Akita et al., 2016; Shi and Cartlidge,
2022). These abilities further enable the capture of
intricate patterns in stock market data that traditional
statistical methods might omit. However, the effi-
cient market theory (Malkiel, 2003) and the random
walk nature of stock prices make it challenging to
predict exact future prices with high accuracy (Adam
et al., 2016). As a result, research efforts have shifted
towards the more robust task of anticipating stock
movements (Jiang, 2021).
Early works (Roondiwala et al., 2017; Bao et al.,
2017) commonly adopt deep learning techniques to
extract temporal features from historical stock data
and predict stock movements accordingly. However,
these methods assume independence between stocks,
neglecting their rich connections. In reality, stocks
are often interrelated from which valuable informa-
tion can be derived. These complicated relations be-
tween stocks are crucial for understanding the stock
markets (Deng et al., 2019; Feng et al., 2019b; Feng
et al., 2022).
To bridge this gap, some deep learning models at-
tempt to model the interconnections between stocks
by integrating textual data (Sawhney et al., 2020),
such as tweets (Xu and Cohen, 2018) and news (Li
et al., 2020b). Nevertheless, these models heavily rely
on the quality of embedded extra information, result-
ing in highly volatile performance. Meanwhile, the
transformer-based methods introduce different atten-
tion mechanisms to capture inter-stock relations based
on multiple time series (i.e., time series of stock indi-
cators, such as open price, close price, highest price,
You, Z., Shi, Z., Bo, H., Cartlidge, J., Zhang, L. and Ge, Y.
DGDNN: Decoupled Graph Diffusion Neural Network for Stock Movement Prediction.
DOI: 10.5220/0012406400003636
Paper published under CC license (CC BY-NC-ND 4.0)
In Proceedings of the 16th International Conference on Agents and Artificial Intelligence (ICAART 2024) - Volume 2, pages 431-442
ISBN: 978-989-758-680-4; ISSN: 2184-433X
Proceedings Copyright © 2024 by SCITEPRESS – Science and Technology Publications, Lda.
431

lowest price, and trading volume) (Yoo et al., 2021;
Ding et al., 2021). Despite this advancement, these
methods often lack explicit modeling of temporal in-
formation of these time series, such as temporal order
and inter-series information (Zhu et al., 2021; Wen
et al., 2022).
Recently, Graph Neural Networks (GNNs) have
shown promising performance in analyzing various
real-world networks or systems by formulating them
as graph-structured data, such as transaction net-
works (Pareja et al., 2020), traffic networks (Wang
et al., 2020), and communication networks (Li et al.,
2020a). Typically, these networks possess multiple
entities interacting over time, and time series data
can characterize each entity. Analyzing stock markets
as complex networks is a natural choice, as previous
works indicate (Liu and Arunkumar, 2019; Shahzad
et al., 2018). Moreover, various interactive mech-
anisms (e.g., transmitters and receivers (Shahzad
et al., 2018)) that exist between stocks can be eas-
ily represented by edges (Cont and Bouchaud, 2000).
Therefore, these properties make GNNs powerful
candidates for explicitly grasping inter-stock rela-
tions and capturing intra-stock patterns with stock
graphs (Sawhney et al., 2021a; Xiang et al., 2022).
However, existing GNN-based models face two
fundamental challenges for stock movement predic-
tion: representing complicated time-evolving inter-
stock dependencies and capturing hierarchical fea-
tures of stocks. First, specific groups of related stocks
are affected by various factors, which change stochas-
tically over time (Huynh et al., 2023). Most graph-
based models (Kim et al., 2019; Ye et al., 2021;
Sawhney et al., 2021b) construct time-invariant stock
graphs, which are contrary to the stochastic and time-
evolving nature of the stock market (Adam et al.,
2016). For instance, inter-stock relations are com-
monly pre-determined by sector or firm-specific rela-
tionships (e.g., belonging to the same industry (Sawh-
ney et al., 2021b) or sharing the same CEO (Kim
et al., 2019)). Besides, artificially defined graphs for
specific tasks may not be versatile or applicable to
other tasks. Sticking to rigid graphs risks introduc-
ing noise and task-irrelevant patterns to models (Chen
et al., 2020). Therefore, generating appropriate stock
graphs and learning task-relevant topology remains a
preliminary yet critical part of GNN-based methods in
predicting stock movements. Second, stocks possess
distinctive hierarchical features (Mantegna, 1999;
Sawhney et al., 2021b) that remain under-exploited
(e.g., overall market trends, group-specific dynamics,
and individual trading patterns (Huynh et al., 2023)).
Previous works indicate that these hierarchical intra-
stock features could distinguish highly related stocks
from different levels and be utilized for learning bet-
ter and more robust representations (Huynh et al.,
2023; Mantegna, 1999). However, in the conventional
GNN-based methods, representation learning is com-
bined with the message-passing process between im-
mediate neighbors in the Euclidean space. As a re-
sult, node representations become overly similar as
the message passes, severely distorting the distinc-
tive individual node information (Huang et al., 2020;
Rusch et al., 2023; Liu et al., 2020). Hence, preserv-
ing these hierarchical intra-stock features is necessary
for GNN-based methods in predicting stock move-
ments.
In this paper, we propose the Decoupled Graph
Diffusion Neural Network (DGDNN) to address the
abovementioned challenges. Overall, we treat stock
movement prediction as a temporal node classifica-
tion task and optimize the model toward identifying
movements (classes) of stocks (nodes) on the next
trading day. The main contributions of this paper are
summarised as follows:
• We exploit the information entropy of nodes as
their pair-wise connectivities with ratios of node
energy as weights, enabling the modeling of in-
trinsic time-varying relations between stocks from
the view of information propagation.
• We extend the layer-wise update rule of conven-
tional GNNs to a decoupled graph diffusion pro-
cess. This allows for learning the task-optimal
graph topology and capturing the hierarchical fea-
tures of multiple stocks.
• We conduct extensive experiments on real-world
stock datasets with 2,893 stocks from three mar-
kets (NASDAQ, NYSE, and SSE). The experi-
mental results demonstrate that DGDNN signif-
icantly outperforms state-of-the-art baselines in
predicting the next trading day movement, with
improvements of 9.06% in classification accuracy,
0.09 in Matthew correlation coefficient, and 0.06
in F1-Score.
2 RELATED WORK
This section provides a brief overview of relevant
studies.
2.1 GNN-Based Methods for Modeling
Multiple Stocks
The major advantage of applying GNNs lies in
their graphical structure, which allows for explic-
itly modeling the relations between entities. For in-
ICAART 2024 - 16th International Conference on Agents and Artificial Intelligence
432

stance, STHAN-SR (Sawhney et al., 2021a), which
is similar to the Graph Attention Neural Networks
(GATs) (Veli
ˇ
ckovi
´
c et al., 2018), adopts a spatial-
temporal attention mechanism on a hypergraph with
industry and corporate edges to capture inter-stock re-
lations on the temporal domain and spatial domain.
HATS (Kim et al., 2019) predicts the stock movement
by a GAT-based method that the immediate neighbor
nodes are selectively aggregated with learned weights
on manually crafted multi-relational stock graphs.
Moreover, HyperStockGAT (Sawhney et al., 2021b)
leverages graph learning in hyperbolic space to cap-
ture the heterogeneity of node degree and hierarchical
nature of stocks on an industry-related stock graph.
This method illustrates that the node degree of stock
graphs is not evenly distributed. Nonetheless, these
methods directly correlate the stocks by empirical
assumptions or expert knowledge to construct static
stock graphs, contradicting the time-varying nature of
the stock market.
2.2 Graph Topology Learning
To address the constraint of GNNs relying on the
quality of raw graphs, researchers have proposed
graph structure learning to optimize raw graphs for
improved performance in downstream tasks. These
methods can be broadly categorized into direct pa-
rameterizing approaches and neural network ap-
proaches. In the former category, methods treat the
adjacency matrix of the target graph as free param-
eters to learn. Pro-GNN, for instance, demonstrates
that refined graphs can gain robustness by learning
perturbed raw graphs guided by critical properties of
raw graphs (Jin et al., 2020). GLNN (Gao et al.,
2020) integrates sparsity, feature smoothness, and ini-
tial connectivity into an objective function to obtain
target graphs. In contrast, neural network approaches
employ more complex neural networks to model edge
weights based on node features and representations.
For example, SLCNN utilizes two types of convolu-
tional neural networks to learn the graph structure at
both the global and local levels (Zhang et al., 2020).
GLCN integrates graph learning and convolutional
neural networks to discover the optimal graph struc-
ture that best serves downstream tasks (Jiang et al.,
2019). Despite these advancements, direct parameter-
izing approaches often necessitate complex and time-
consuming alternating optimizations or bi-level opti-
mizations, and neural network approaches may over-
look the unique characteristics of graph data or lose
the positional information of nodes.
2.3 Decoupled Representation Learning
Various networks or systems exhibit unique character-
istics that are challenging to capture within the con-
straints of Euclidean space, particularly when rely-
ing on manually assumed prior knowledge (Huynh
et al., 2023; Sawhney et al., 2021b). In addressing
this challenge, DAGNN (Liu et al., 2020) offers the-
oretical insights, emphasizing that the entanglement
between representation transformation and message
propagation can hinder the performance of message-
passing GNNs. SHADOW-GNN (Zeng et al., 2021),
on the other hand, concentrates on decoupling the
representation learning process both in depth and
scope. By learning on multiple subgraphs with arbi-
trary depth, SHADOW-GNN preserves the distinctive
information of localized subgraphs instead of globally
smoothing them into white noise. Another approach,
MMP (Chen et al., 2022), transforms updated node
messages into self-embedded representations. It then
selectively aggregates these representations to form
the final graph representation, deviating from the di-
rect use of representations from the message-passing
process.
3 PRELIMINARY
In this section, we present the fundamental notations
used throughout this paper and details of the problem
setting. Nodes represent stocks, node features repre-
sent their historical stock indicators, and edges repre-
sent interconnections between stocks.
3.1 Notation
Let G
t
(V , E
t
) represents a weighted and directed
graph on trading day t, where V is the set of nodes
(stocks) {v
1
,..., v
N
} with the number of nodes as
|V | = N, and E
t
is the set of edges (inter-stock re-
lations). Let A
t
∈ R
N×N
represents the adjacency ma-
trix and its entry (A
t
)
i, j
represents an edge from v
i
to v
j
. The node feature matrix is denoted as X
t
∈
R
N×(τM)
, where M represents the number of stock in-
dicators (i.e., open price, close price, highest price,
lowest price, trading volume, etc), and τ represents
the length of the historical lookback window. The fea-
ture vector of v
i
on trading day t is denoted as x
t,i
. Let
c
t,i
represent the label of v
i
on trading day t, where
C
t
∈ R
N×1
is the label matrix on trading day t.
DGDNN: Decoupled Graph Diffusion Neural Network for Stock Movement Prediction
433

1
3
6
4
2
Entropy-driven
Edge
Generation
5
1
3
6
4
2
5
1
3
6
4
2
5
.
.
.
.
.
.
Generalized
Graph
Diffusion
Multi-head
Attention
Multi-Layer
Perceptron
Concatenation Concatenation
H
0
H
l-1
Unconnected
Connected
Generalized
Graph
Diffusion
Generalized
Graph
Diffusion
H
'
0
H
1
.
.
.
x
t,0
x
t,1
x
t,i
Signal
Energy
Information
Entropy
Minimizing
C
t+1
H
'
l
Generalized
Graph
Diffusion
H
l
Multi-head
Attention
Multi-head
Attention
Multi-head
Attention
Figure 1: The DGDNN framework consists of three steps: (1) constructing the raw stock graph G
t
(see Section 4.1); (2) learn-
ing the task-optimal graph topology by generalized graph diffusion (see Section 4.2); (3) applying a hierarchical decoupled
representation learning scheme (see Section 4.3).
3.2 Problem Setting
Since we are predicting future trends of multiple
stocks by utilizing their corresponding stock indica-
tors, we transform the regression task of predicting
exact stock prices into a temporal node classifica-
tion task. Similar to previous works on stock move-
ment prediction (Kim et al., 2019; Xiang et al., 2022;
Sawhney et al., 2021a; Xu and Cohen, 2018; Li et al.,
2021), we refer to this common and important task
as next trading day stock trend classification. Given
a set of stocks on the trading day t, the model learns
from a historical lookback window of length τ (i.e.,
[t −τ+1,t]) and predicts their labels in the next times-
tamp (i.e., trading day t + 1). The mapping relation-
ship of this work is expressed as follows,
f (G
t
(V , E
t
)) −→ C
t+1
. (1)
Here, f (·) represents the proposed method DGDNN.
4 METHODOLOGY
In this section, we detail the framework of the pro-
posed DGDNN in depth, as depicted in Fig 1.
4.1 Entropy-Driven Edge Generation
Defining the graph structure is crucial for achieving
reasonable performance for GNN-based approaches.
In terms of stock graphs, traditional methods often es-
tablish static relations between stocks through human
labeling or natural language processing techniques.
However, recent practices have proven that generating
dynamic relations based on historical stock indicators
is more effective (Li et al., 2021; Xiang et al., 2022).
These indicators, as suggested by previous financial
studies (Dessaint et al., 2019; Cont and Bouchaud,
2000; Liu and Arunkumar, 2019), can be treated as
noisy temporal signals. Simultaneously, stocks can
be viewed as transmitters or receivers of informa-
tion signals, influencing other stocks (Shahzad et al.,
2018; Ferrer et al., 2018). Additionally, stock markets
exhibit significant node-degree heterogeneity, with
highly influential stocks having relatively large node
degrees (Sawhney et al., 2021b; Arora et al., 2006).
Consequently, we propose to model interdepen-
dencies between stocks by treating the stock market as
a communication network. Prior research (Yue et al.,
2020) generates the asymmetric inter-stock relations
based on transfer entropy. Nonetheless, the complex
estimation process of transfer entropy and the limited
consideration of edge weights hamper the approxima-
tion of the intrinsic inter-stock connections.
To this end, we quantify the links between nodes
by utilizing the information entropy as the directional
connectivity and signal energy as its intensity. On the
one hand, if the information can propagate between
entities within real-world systems, the uncertainty or
randomness is reduced, resulting in a decrease in en-
tropy and an increase in predictability at the receiving
entities (Jaynes, 1957; Csisz
´
ar et al., 2004). On the
other hand, the energy of the signals reflects their in-
tensity during propagation, which can influence the
received information at the receiver. The entry (A
t
)
i, j
is defined by,
(A
t
)
i, j
=
E(x
t,i
)
E(x
t, j
)
(e
S(x
t,i
)+S(x
t, j
)−S(x
t,i
,x
t, j
)
− 1). (2)
Here, E(·) denotes the signal energy, and S(·) denotes
the information entropy. The signal energy of v
i
is
obtained by,
E(x
t,i
) =
τM−1
∑
n=0
|x
t,i
[n]|
2
. (3)
The information entropy of v
i
is obtained by,
S(x
t,i
) = −
∑
j=0
p(s
j
)ln p(s
j
), (4)
where {s
0
,..., s
j
} denotes the non-repeating sequence
of x
t,i
and p(s
j
) represents the probability of value s
j
.
By definition, we can obtain p(s
j
) by,
p(s
j
) =
∑
τM−1
n=0
δ(s
j
− x
t,i
[n])
τM
. (5)
Here δ(·) denotes the Dirac delta function.
ICAART 2024 - 16th International Conference on Agents and Artificial Intelligence
434

4.2 Generalized Graph Diffusion
However, simply assuming constructed graphs are
perfect for performing specific tasks can lead to dis-
cordance between given graphs and task objectives,
resulting in sub-optimal model performance (Chen
et al., 2020). Several methods have been proposed
to mitigate this issue, including AdaEdge (Chen et al.,
2020) and DropEdge (Rong et al., 2019). These meth-
ods demonstrate notable improvements in node clas-
sification tasks by adding or removing edges to per-
turb graph topologies, enabling models to capture and
leverage critical topological information.
With this in mind, we propose to utilize a general-
ized diffusion process on the constructed stock graph
to learn the task-optimal topology. It enables more ef-
fective capture of long-range dependencies and global
information on the graph by diffusing information
across larger neighborhoods (Klicpera et al., 2019).
The following equation defines the generalized
graph diffusion at layer l,
Q
l
=
K−1
∑
k=0
θ
l,k
T
l,k
,
K−1
∑
k=0
θ
l,k
= 1. (6)
Here Q
l
denotes the diffusion matrix, K denotes the
maximum diffusion step, θ
l,k
denotes the weight coef-
ficients, and T
l,k
denotes the column-stochastic tran-
sition matrix. Specifically, generalized graph diffu-
sion transforms the given graph structure into a new
one while keeping node signals neither amplified nor
reduced. Consequently, the generalized graph diffu-
sion turns the information exchange solely between
adjacent connected nodes into broader unconnected
areas of the graph.
Notably, θ
l,k
and T
l,k
can be determined in ad-
vance (Klicpera et al., 2019). For instance, we can
use the heat kernel or the personalized PageRank to
define θ
l,k
, and the random walk transition matrix or
symmetric transition matrix to define T
l,k
. Although
these pre-defined mappings perform well in some
datasets (e.g., CORA, CiteSeer, and PubMed) with
time-invariant relations (Zhao et al., 2021), they are
not feasible for tasks that require considering chang-
ing relationships.
Therefore, we make θ
l,k
as trainable parameters,
T
l,k
as trainable matrices, and K as a hyperparame-
ter. Furthermore, we introduce a neighborhood ra-
dius (Zhao et al., 2021) to control the effectiveness
of the generalized graph diffusion. The neighborhood
radius at layer l is expressed as,
r
l
=
∑
K−1
k=0
θ
l,k
k
∑
K−1
k=0
θ
l,k
, r
l
> 0 (7)
Generalized Graph Diffusion Hierarchical Representation Learning
X
t
, A
t
Generalized
Graph Diffusion
. . .
Generalized
Graph Diffusion
Cat Attention
Cat Attention
. . .
H
0
H
l
layer 0
layer l
. . .
H
'
l
Figure 2: The component-wise layout of hierarchical de-
coupled representation learning with input X
t
, A
t
.
Here, large r
l
indicates the model explores more on
distant nodes and vice versa.
4.3 Hierarchical Decoupled
Representation Learning
Theoretically, GNNs update nodes by continuously
aggregating direct one-hop neighbors, producing the
final representation. However, this can lead to a high
distortion of the learned representation. It is proba-
bly because the message-passing and representation
transformation do not essentially share a fixed neigh-
borhood in the Euclidean space (Liu et al., 2020; Xu
et al., 2018; Chen et al., 2020). To address this is-
sue, decoupled GNNs have been proposed (Liu et al.,
2020; Xu et al., 2018), aiming to decouple these two
processes and prevent the loss of distinctive local in-
formation in learned representation. Similarly, meth-
ods such as HyperStockGAT (Sawhney et al., 2021b)
have explored learning graph representations in hy-
perbolic spaces with attention mechanisms to capture
temporal features of stocks at different levels.
Inspired by these methods, we adopt a hierarchi-
cal decoupled representation learning strategy to cap-
ture hierarchical intra-stock features. Each layer in
DGDNN comprises a Generalized Graph Diffusion
layer and a Cat Attention layer in parallel, as depicted
in Fig. 2. The layer-wise update rule is defined by,
H
l
= σ
(Q
l
⊙ A
t
)H
l−1
W
0
l
,
H
′
l
= σ
ζ(H
l
||H
′
l−1
)W
1
l
+ b
1
l
. (8)
Here, H
′
l
denote the node representation of l − th
layer, σ(·) is the activation function, ζ(·) denotes the
multi-head attention, || denotes the concatenation, and
W
l
denotes the layer-wise trainable weight matrix.
4.4 Objective Function
According to Eq. 1, Eq. 6, and Eq. 7, we formulated
the objective function of DGDNN as follows,
DGDNN: Decoupled Graph Diffusion Neural Network for Stock Movement Prediction
435

J =
1
B
B−1
∑
t=0
L
CE
(C
t+1
, f (X
t
,A
t
)) − α
L−1
∑
l=0
r
l
+
L−1
∑
l=0
(
K−1
∑
k=0
θ
l,k
− 1). (9)
Here, L
CE
(·) denotes the cross-entropy loss, B de-
notes the batch size, L denotes the number of infor-
mation propagation layers, and α denotes the weight
coefficient controlling the neighborhood radius.
5 EXPERIMENT
The experiments are conducted on 3x Nvidia Tesla
T4, CUDA version 11.2. Datasets and source code
are available
1
.
5.1 Dataset
Following previous works (Kim et al., 2019; Xiang
et al., 2022; Sawhney et al., 2021a; Li et al., 2021), we
evaluate DGDNN on three real-world datasets from
two US stock markets (NASDAQ and NYSE) and one
China stock market (SSE). We collect historical stock
indicators from Yahoo Finance and Google Finance
for all the selected stocks. We choose the stocks that
span the S&P 500 and NASDAQ composite indices
for the NASDAQ dataset. We select the stocks that
span the Dow Jones Industrial Average, S&P 500, and
NYSE composite indices for the NYSE dataset. We
choose the stocks that compose the SSE 180 for the
SSE dataset. The details of the three datasets are pre-
sented in Table 1.
5.2 Model Setting
Based on grid search, hyperparameters are selected
using sensitivity analysis over the validation period
(see Section 5.6). For NASDAQ, we set α = 2.9 ×
10
−3
, τ = 19, K = 9, and L = 8. For NYSE, we set
α = 2.7 × 10
−3
, τ = 22, K = 10, and L = 9. For SSE,
we set α = 8.6 ×10
−3
, τ = 14, K = 3, and L = 5. The
training epoch is set to 1200. Adam is the optimizer
with a learning rate of 2 × 10
−4
and a weight decay
of 1.5 × 10
−5
. The number of layers of Muti-Layer
Perceptron is set to 3, the number of heads of Cat At-
tention layers is set to 3, the embedding dimension is
set to 128, and full batch training is selected.
1
https://github.com/pixelhero98/DGDNN
5.3 Baseline
To evaluate the performance of the proposed model,
we compared DGDNN with the following baseline
approaches:
Table 1: Statistics of NASDAQ, NYSE, and SSE.
NASDAQ NYSE SSE
Train Period 05/2016-06/2017 05/2016-06/2017 05/2016-06/2017
Validation Period 07/2017-12/2017 07/2017-12/2017 07/2017-12/2017
Test Period 01/2018-12/2019 01/2018-12/2019 01/2018-12/2019
# Days Tr:Val:Test 252:64:489 252:64:489 299:128:503
# Stocks 1026 1737 130
# Stock Indicators 5 5 4
# Label per trading day 2 2 2
5.3.1 RNN-Based Baseline
• DA-RNN (Qin et al., 2017). A dual-stage
attention-based RNN model with an encoder-
decoder structure. The encoder utilizes an atten-
tion mechanism to extract the input time-series
feature, and the decoder utilizes a temporal atten-
tion mechanism to capture the long-range tempo-
ral relationships among the encoded series.
• Adv-ALSTM (Feng et al., 2019a). An LSTM-
based model that leverages adversarial training to
improve the generalization ability of the stochas-
ticity of price data and a temporal attention mech-
anism to capture the long-term dependencies in
the price data.
5.3.2 Transformer-Based Baseline
• HMG-TF (Ding et al., 2021). A transformer
method for modeling long-term dependencies of
financial time series. The model proposes multi-
scale Gaussian priors to enhance the locality, or-
thogonal regularization to avoid learning redun-
dant heads in multi-head attention, and trading
gap splitter to learn the hierarchical features of
high-frequency data.
• DTML (Yoo et al., 2021). A multi-level context-
based transformer model learns the correlations
between stocks and temporal correlations in an
end-to-end way.
5.3.3 GNN-Based Baseline
• HATS (Kim et al., 2019). A GNN-based model
with a hierarchical graph attention mechanism.
It utilizes LSTM and GRU layers to extract the
temporal features as the node representation, and
ICAART 2024 - 16th International Conference on Agents and Artificial Intelligence
436

Table 2: ACC, MCC, and F1-Score of proposed DGDNN and other baselines on next trading day stock trend classification
over the test period. Bold numbers denote the best results.
Method
NASDAQ NYSE SSE
ACC(%) MCC F1-Score ACC(%) MCC F1-Score ACC(%) MCC F1-Score
DA-RNN (Qin et al., 2017) 57.59±0.36 0.05±1.47×10
−3
0.56±0.01 56.97±0.13 0.06±1.12×10
−3
0.57±0.02 56.19±0.23 0.04±1.24×10
−3
0.52±0.02
Adv-ALSTM (Feng et al., 2019a) 51.16±0.42 0.04±3.88×10
−3
0.53±0.02 53.42±0.30 0.05±2.30×10
−3
0.53±0.02 52.41±0.56 0.03±6.01×10
−3
0.51±0.01
HMG-TF (Ding et al., 2021) 57.18±0.17 0.11±1.64×10
−3
0.59±0.01 58.49±0.12 0.09±2.03×10
−3
0.59±0.02 58.88±0.20 0.12±1.71×10
−3
0.59±0.01
DTML (Yoo et al., 2021) 58.27±0.79 0.07±2.75×10
−3
0.58±0.01 59.17±0.25 0.07±3.07×10
−3
0.60±0.01 59.25±0.38 0.11±4.79×10
−3
0.59±0.02
HATS (Kim et al., 2019) 51.43±0.49 0.01±5.66×10
−3
0.48±0.01 52.05±0.82 0.02±7.42×10
−3
0.50±0.03 53.72±0.59 0.02±3.80×10
−3
0.49±0.01
STHAN-SR (Sawhney et al., 2021a) 55.18±0.34 0.03±4.11×10
−3
0.56±0.01 54.24±0.50 0.01±5.73×10
−3
0.58±0.02 55.01±0.11 0.03±3.09×10
−3
0.57±0.01
GraphWaveNet (Wu et al., 2019) 59.57±0.27 0.07±2.12×10
−3
0.60±0.02 58.11±0.66 0.05±2.21×10
−3
0.59±0.02 60.78±0.23 0.06±1.93×10
−3
0.57±0.01
HyperStockGAT (Sawhney et al., 2021b)
58.23±0.68 0.06±1.23×10
−3
0.59±0.02 59.34±0.19 0.04±5.73×10
−3
0.61±0.02 57.36±0.10 0.09±1.21×10
−3
0.58±0.02
DGDNN 65.07±0.25 0.20±2.33×10
−3
0.63±0.01 66.16±0.14 0.14±1.67×10
−3
0.65±0.01 64.30±0.32 0.19±4.33×10
−3
0.64±0.02
the message-passing is achieved by selectively ag-
gregating the representation of directly adjacent
nodes according to their edge type at each level.
• STHAN-SR (Sawhney et al., 2021a). A GNN-
based model operated on a hypergraph with two
types of hyperedges: industrial hyperedges and
Wikidata corporate hyperedges. The node fea-
tures are generated by temporal Hawkes attention,
and weights of hyperedges are generated by hy-
pergraph attention. The spatial hypergraph con-
volution achieves representation and information-
spreading.
• GraphWaveNet (Wu et al., 2019). A spatial-
temporal graph modeling method that captures the
spatial-temporal dependencies between multiple
time series by combining graph convolution with
dilated casual convolution.
• HyperStockGAT (Sawhney et al., 2021b). A
graph attention network utilizing the hyperbolic
graph representation learning on Riemannian
manifolds to predict the rankings of stocks on the
next trading day based on profitability.
5.4 Evaluation Metric
Following approaches taken in previous works (Kim
et al., 2019; Xiang et al., 2022; Deng et al., 2019;
Sawhney et al., 2021a; Sawhney et al., 2021b), F1-
Score, Matthews Correlation Coefficient (MCC), and
Classification Accuracy (ACC) are utilized to evalu-
ate the performance of the models.
5.5 Evaluation Result
The experimental results are presented in Table 2. Our
model outperforms baseline methods regarding ACC,
MCC, and F1-score over three datasets. Specifically,
DGDNN exhibits average improvements of 10.78%
in ACC, 0.13 in MCC, and 0.10 in F1-Score compared
to RNN-based baseline methods. In comparison to
Transformer-based methods, DGDNN shows average
improvements of 7.78% in ACC, 0.07 in MCC, and
0.05 in F1-Score. Furthermore, when contrasted with
GNN-based models, DGDNN achieves average im-
provements of 7.16% in ACC, 0.12 in MCC, and 0.07
in F1-Score.
We can make the following observations based on
experimental results. First, models such as Graph-
WaveNet, DTML, HMG-TF, DA-RNN, and DGDNN
that obtain the interdependencies between entities
during the learning process perform better in most of
the metrics than those methods (HATS, STHAN-SR,
HyperStockGAT, and Adv-ALSTM) with pre-defined
relationships (e.g., industry and corporate edges) or
without considering dependencies between entities.
Second, regarding the GNN-based models, Hyper-
StockGAT and DGDNN, which learn the graph rep-
resentations in different latent spaces, perform bet-
ter than those (STHAN-SR and HATS) in Euclidean
space.
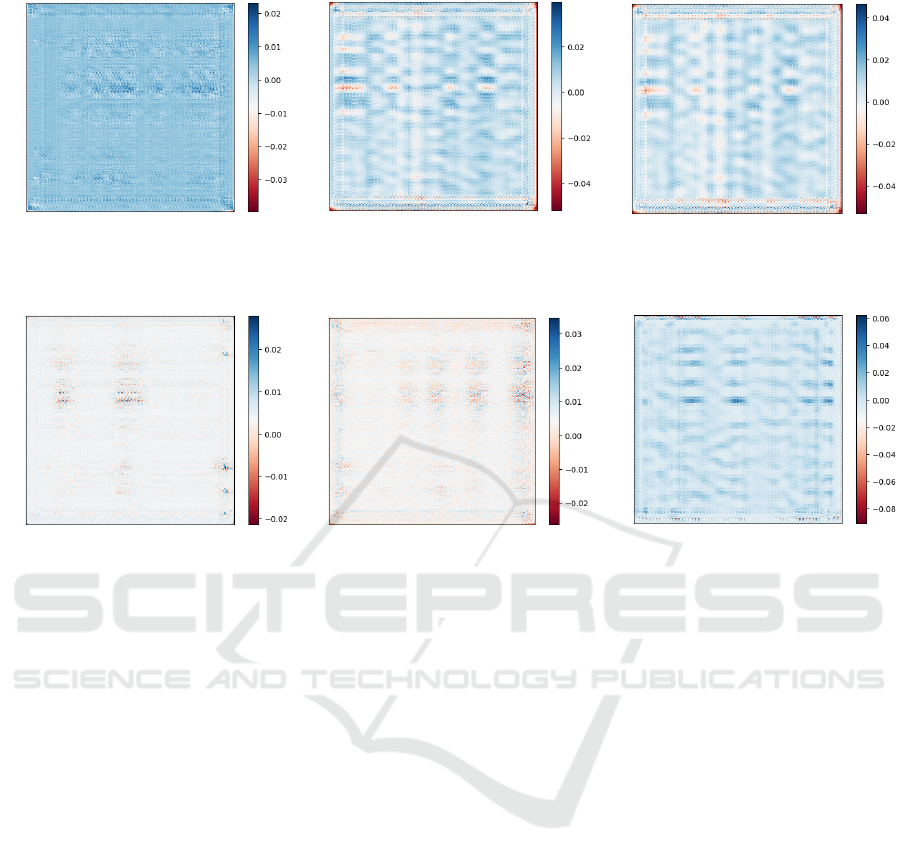
Fig. 3 presents visualizations of diffusion matri-
ces across three consecutive trading days, with col-
ors representing normalized weights. We make the
following three observations. First, stocks from con-
secutive trading days do not necessarily exhibit sim-
ilar patterns in terms of information diffusion. The
distributions of edge weights change rapidly between
Fig. 3a and Fig. 3b, and between Fig. 3e and Fig. 3f.
Second, shallow layers tend to disseminate informa-
tion across a broader neighborhood. A larger number
of entries in the diffusion matrices are not zero and are
distributed across the matrices in Fig 3a to Fig. 3c. In
contrast, deeper layers tend to focus on specific lo-
cal areas. The entries with larger absolute values are
more centralized in Fig. 3d to Fig. 3f). Third, even
though the initial patterns from consecutive test trad-
ing days are similar (as shown in Fig. 3b and Fig. 3c),
differences in local structures result in distinctive pat-
terns as the layers deepen (Fig. 3e and Fig. 3f), i.e.,
the weights of edges can show similar distributions
globally, but local areas exhibit different patterns. For
DGDNN: Decoupled Graph Diffusion Neural Network for Stock Movement Prediction
437
Diffusion Matrix
Node Index
Node Index
(a) Q
0
,t − 2.
Diffusion Matrix
Node Index
Node Index
(b) Q
0
,t − 1.
Diffusion Matrix
Node Index
Node Index
(c) Q
0
,t.
Diffusion Matrix
Node Index
Node Index
(d) Q
L−1
,t − 2.
Diffusion Matrix
Node Index
Node Index
(e) Q
L−1
,t − 1.
Diffusion Matrix
Node Index
Node Index
(f) Q
L−1
,t.
Figure 3: Example normalized color maps of diffusion matrices from different layers on the NYSE dataset. t = 03/06/2016.
instance, in Fig. 3f, some dark blue clusters are distin-
guished from light blue clusters in shape and weight,
which might be crucial local graph structures.
These results suggest that the complex relation-
ships between stocks are not static but evolve rapidly
over time, and the domain knowledge does not suf-
ficiently describe the intrinsic interdependencies be-
tween multiple entities. The manually crafted fixed
stock graph assumes that the stocks of the same
class are connected (Livingston, 1977), neglecting the
possibility that stocks change to different classes as
time changes. Besides, some stocks are more criti-
cal than others in exhibiting the hierarchical nature
of intra-stock dynamics (Mantegna, 1999; Sawhney
et al., 2021b), which is hard to capture in Euclidean
space by directly aggregating representations as the
message-passing process does.
5.6 Hyperparameter Sensitivity
In this section, we explore the sensitivity of two im-
portant hyperparameters: the historical lookback win-
dow size τ and the maximum diffusion step K. These
hyperparameters directly affect the model’s ability to
model the relations between multiple stocks. The sen-
sitivity results of τ and K are shown in Fig. 5. Based
on the sensitivity results, DGDNN consistently per-
forms better on the three datasets when the histori-
cal lookback window size τ ∈ [14,24]. This coincides
with the 20-day (i.e., monthly) professional financial
strategies (Adam et al., 2016). Moreover, the opti-
mal K of DGDNN varies considerably with differ-
ent datasets. On the one hand, the model’s perfor-
mance generally improves as K grows on the NAS-
DAQ dataset and the NYSE dataset, achieving the
optimal when K ∈ {9, 10}. On the other hand, the
model’s performance on the SSE dataset reaches the
peak when K = 3 and retains a slightly worse perfor-
mance as K grows. Intuitively, the stock graph of the
SSE dataset is smaller than the NASDAQ dataset and
the NYSE dataset, resulting in a smaller K.
5.7 Ablation Study
The proposed DGDNN consists of three critical com-
ponents: entropy-driven edge generation, generalized
graph diffusion, and hierarchical decoupled represen-
tation learning. We further verify the effectiveness of
each component by removing it from DGDNN. The
ablation study results are shown in Fig. 4.
ICAART 2024 - 16th International Conference on Agents and Artificial Intelligence
438
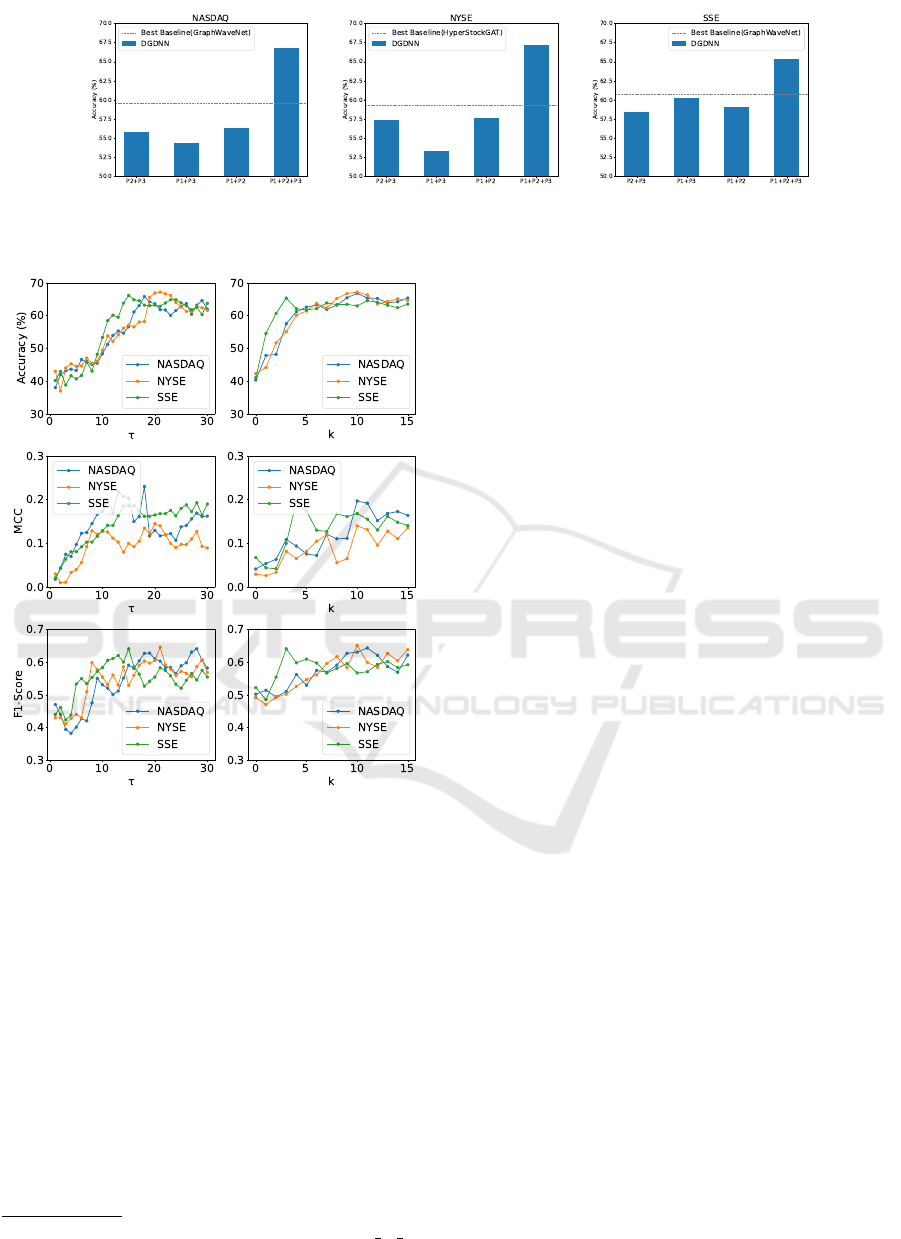
Figure 4: Results of the ablation study. Blue: P1 denotes entropy-driven edge generation, P2 denotes generalized graph
diffusion, and P3 denotes hierarchical decoupled representation learning. Gray dot line: best baseline accuracy.
Figure 5: Sensitivity study of the historical lookback win-
dow length τ and the maximum diffusion step K over vali-
dation period.
5.7.1 Entropy-Driven Edge Generation
To demonstrate the effectiveness of constructing dy-
namic relations from the stock signals, we replace the
entropy-driven edge generation with the commonly
adopted industry-corporate stock graph using Wiki-
data
2
(Feng et al., 2019b). We observe that apply-
ing the industry and corporate relationships leads to
an average performance reduction of classification ac-
curacy by 9.23%, reiterating the importance of con-
sidering temporally evolving dependencies between
stocks. Moreover, when testing on the NYSE dataset
and the SSE dataset, the degradation of model per-
formance is slightly smaller than on the NASDAQ
2
https://www.wikidata.org/wiki/Wikidata:List of pro
perties
dataset. According to financial studies (Jiang et al.,
2011; Schwert, 2002), the NASDAQ market tends to
be more unstable than the other two. This might in-
dicate that the injection of expert knowledge works
better in less noisy and more stable markets.
5.7.2 Generalized Graph Diffusion
We explore the impact of utilizing the generalized
graph diffusion process. Results of the ablation study
show that DGDNN performs worse without general-
ized graph diffusion on all datasets, with classifica-
tion accuracy reduced by 10.43% on average. This
indicates that the generalized graph diffusion facil-
itates information exchange better than immediate
neighbors with invariant structures. While the per-
formance degradation on the SSE dataset is about
38% of the performance degradation on the NASDAQ
dataset and the NYSE dataset. Since the size of the
stock graphs (130 stocks) of the SSE dataset is much
smaller than the other two (1026 stocks and 1737
stocks), the graph diffusion process has limited im-
provements through utilizing larger neighborhoods.
5.7.3 Hierarchical Decoupled Representation
Learning
The ablation experiments demonstrate that the model
coupling the two processes deteriorates with a reduc-
tion of classification accuracy by 9.40% on the NAS-
DAQ dataset, 8.55% on the NYSE dataset, and 5.23%
on the SSE dataset. This observation empirically val-
idates that a decoupled GNN can better capture the
hierarchical characteristic of stocks. Meanwhile, this
suggests that the representation transformation is not
necessarily aligned with information propagation in
Euclidean space. It is because different graphs ex-
hibit various types of inter-entities patterns and intra-
entities features, which do not always follow the as-
sumption of smoothed node features (Liu et al., 2020;
Xu et al., 2018; Li et al., 2018).
DGDNN: Decoupled Graph Diffusion Neural Network for Stock Movement Prediction
439

6 CONCLUSION
In this paper, we propose DGDNN, a novel graph
learning approach for predicting the future trends of
multiple stocks based on their historical indicators.
Traditionally, stock graphs are crafted based on do-
main knowledge (e.g., firm-specific and industrial re-
lations) or generated by alternative information (e.g.,
news and reports). To make stock graphs appropri-
ately represent complex time-variant inter-stock re-
lations, we dynamically generate raw stock graphs
from a signal processing view considering financial
theories of stock markets. Then, we propose lever-
aging the generalized graph diffusion process to opti-
mize the topologies of raw stock graphs. Eventually,
the decoupled representation learning scheme cap-
tures and preserves the hierarchical features of stocks,
which are often overlooked in prior works. The ex-
perimental results demonstrate performance improve-
ments of the proposed DGDNN over baseline meth-
ods. The ablation study results prove the effective-
ness of each module in DGDNN. Besides financial
applications, the proposed method can be easily trans-
ferred to tasks that involve multiple entities exhibit-
ing interdependent and time-evolving features. One
limitation of DGDNN is that it generates an overall
dynamic relationship from multiple stock indicators
without sufficiently considering the interplay between
them. Notwithstanding the promising results, we plan
to learn multi-relational dynamic stock graphs and al-
low information to be further diffused across different
relational stock graphs in future work.
REFERENCES
Adam, K., Marcet, A., and Nicolini, J. P. (2016). Stock mar-
ket volatility and learning. The Journal of Finance,
71(1):33–82.
Akita, R., Yoshihara, A., Matsubara, T., and Uehara, K.
(2016). Deep learning for stock prediction using nu-
merical and textual information. In IEEE/ACIS 15th
International Conference on Computer and Informa-
tion Science, pages 1–6.
Arora, N., Narayanan, B., and Paul, S. (2006). Financial
influences and scale-free networks. In Computational
Science–ICCS 2006: Lecture Notes in Computer Sci-
ence, volume 3991, pages 16–23. Springer, Berlin,
Heidelberg.
Bao, W., Yue, J., and Rao, Y. (2017). A deep learning
framework for financial time series using stacked au-
toencoders and long-short term memory. PloS one,
12(7):e0180944.
Bo, H., Wu, Y., You, Z., McConville, R., Hong, J., and Liu,
W. (2023). What will make misinformation spread: an
XAI perspective. In World Conference on Explainable
Artificial Intelligence, pages 321–337. Springer.
Chen, D., Lin, Y., Li, W., Li, P., Zhou, J., and Sun, X.
(2020). Measuring and relieving the over-smoothing
problem for graph neural networks from the topologi-
cal view. In 34th AAAI Conference on Artificial Intel-
ligence, pages 3438–3445.
Chen, J., Liu, W., and Pu, J. (2022). Memory-based mes-
sage passing: Decoupling the message for propaga-
tion from discrimination. In ICASSP 2022-2022 IEEE
International Conference on Acoustics, Speech and
Signal Processing, pages 4033–4037.
Cont, R. and Bouchaud, J.-P. (2000). Herd behavior and
aggregate fluctuations in financial markets. Macroe-
conomic Dynamics, 4(2):170–196.
Csisz
´
ar, I., Shields, P. C., et al. (2004). Information theory
and statistics: A tutorial. Foundations and Trends® in
Communications and Information Theory, 1(4):417–
528.
Deng, S., Zhang, N., Zhang, W., Chen, J., Pan, J. Z., and
Chen, H. (2019). Knowledge-driven stock trend pre-
diction and explanation via temporal convolutional
network. In Companion Proceedings of The 2019
World Wide Web Conference, pages 678–685.
Dessaint, O., Foucault, T., Fr
´
esard, L., and Matray, A.
(2019). Noisy stock prices and corporate investment.
The Review of Financial Studies, 32(7):2625–2672.
Ding, Q., Wu, S., Sun, H., Guo, J., and Guo, J. (2021). Hi-
erarchical multi-scale gaussian transformer for stock
movement prediction. In 29th International Joint
Conference on Artificial Intelligence (IJCAI), pages
4640–4646.
Feng, F., Chen, H., He, X., Ding, J., Sun, M., and Chua,
T.-S. (2019a). Enhancing stock movement prediction
with adversarial training. In 28th International Joint
Conference on Artificial Intelligence (IJCAI), pages
5843–5849.
Feng, F., He, X., Wang, X., Luo, C., Liu, Y., and Chua, T.-
S. (2019b). Temporal relational ranking for stock pre-
diction. ACM Transactions on Information Systems,
37(2):1–30.
Feng, S., Xu, C., Zuo, Y., Chen, G., Lin, F., and XiaHou,
J. (2022). Relation-aware dynamic attributed graph
attention network for stocks recommendation. Pattern
Recognition, 121:108119.
Ferrer, R., Shahzad, S. J. H., L
´
opez, R., and Jare
˜
no, F.
(2018). Time and frequency dynamics of connected-
ness between renewable energy stocks and crude oil
prices. Energy Economics, 76:1–20.
Gao, X., Hu, W., and Guo, Z. (2020). Exploring structure-
adaptive graph learning for robust semi-supervised
classification. In IEEE International Conference on
Multimedia and Expo (ICME), pages 1–6.
Huang, W., Rong, Y., Xu, T., Sun, F., and Huang, J. (2020).
Tackling over-smoothing for general graph convolu-
tional networks. arXiv preprint arXiv:2008.09864.
Huynh, T. T., Nguyen, M. H., Nguyen, T. T., Nguyen,
P. L., Weidlich, M., Nguyen, Q. V. H., and Aberer, K.
(2023). Efficient integration of multi-order dynamics
and internal dynamics in stock movement prediction.
ICAART 2024 - 16th International Conference on Agents and Artificial Intelligence
440

In 16th ACM International Conference on Web Search
and Data Mining, pages 850–858.
Jaynes, E. T. (1957). Information theory and statistical me-
chanics. Physical review, 106(4):620.
Jiang, B., Zhang, Z., Lin, D., Tang, J., and Luo,
B. (2019). Semi-supervised learning with graph
learning-convolutional networks. In IEEE/CVF Con-
ference on Computer Vision and Pattern Recognition
(CVPR), pages 11313–11320.
Jiang, C. X., Kim, J.-C., and Wood, R. A. (2011). A com-
parison of volatility and bid–ask spread for NASDAQ
and NYSE after decimalization. Applied Economics,
43(10):1227–1239.
Jiang, W. (2021). Applications of deep learning in stock
market prediction: recent progress. Expert Systems
with Applications, 184:115537.
Jin, W., Ma, Y., Liu, X., Tang, X., Wang, S., and Tang,
J. (2020). Graph structure learning for robust graph
neural networks. In 26th ACM SIGKDD International
Conference on Knowledge Discovery & Data Mining,
pages 66–74.
Kim, R., So, C. H., Jeong, M., Lee, S., Kim, J., and Kang,
J. (2019). HATS: A hierarchical graph attention net-
work for stock movement prediction. arXiv preprint
arXiv:1908.07999.
Klicpera, J., Weißenberger, S., and G
¨
unnemann, S. (2019).
Diffusion improves graph learning. In 33rd Interna-
tional Conference on Neural Information Processing
Systems (NeurIPS), pages 13366–13378.
Li, Q., Gama, F., Ribeiro, A., and Prorok, A. (2020a).
Graph neural networks for decentralized multi-robot
path planning. In IEEE/RSJ International Confer-
ence on Intelligent Robots and Systems (IROS), pages
11785–11792.
Li, Q., Han, Z., and Wu, X.-M. (2018). Deeper in-
sights into graph convolutional networks for semi-
supervised learning. In 32nd AAAI Conference on Ar-
tificial Intelligence, pages 3528–3545.
Li, Q., Tan, J., Wang, J., and Chen, H. (2020b). A multi-
modal event-driven LSTM model for stock prediction
using online news. IEEE Transactions on Knowledge
and Data Engineering, 33(10):3323–3337.
Li, W., Bao, R., Harimoto, K., Chen, D., Xu, J., and Su,
Q. (2021). Modeling the stock relation with graph
network for overnight stock movement prediction. In
29th International Joint Conference on Artificial In-
telligence (IJCAI), pages 4541–4547.
Liu, C. and Arunkumar, N. (2019). Risk prediction and
evaluation of transnational transmission of financial
crisis based on complex network. Cluster Computing,
22:4307–4313.
Liu, M., Gao, H., and Ji, S. (2020). Towards deeper graph
neural networks. In 26th ACM SIGKDD International
Conference on Knowledge Discovery & Data Mining,
pages 338–348.
Livingston, M. (1977). Industry movements of common
stocks. The Journal of Finance, 32(3):861–874.
Malkiel, B. G. (2003). The efficient market hypothesis
and its critics. Journal of economic perspectives,
17(1):59–82.
Mantegna, R. N. (1999). Hierarchical structure in finan-
cial markets. The European Physical Journal B-
Condensed Matter and Complex Systems, 11:193–
197.
Pareja, A., Domeniconi, G., Chen, J., Ma, T., Suzumura, T.,
Kanezashi, H., Kaler, T., Schardl, T., and Leiserson,
C. (2020). EvolveGCN: Evolving graph convolutional
networks for dynamic graphs. In 34th AAAI Confer-
ence on Artificial Intelligence, pages 5363–5370.
Qin, Y., Song, D., Cheng, H., Cheng, W., Jiang, G., and
Cottrell, G. W. (2017). A dual-stage attention-based
recurrent neural network for time series prediction. In
26th International Joint Conference on Artificial In-
telligence (IJCAI), pages 2627–2633.
Rong, Y., Huang, W., Xu, T., and Huang, J. (2019). DropE-
dge: Towards deep graph convolutional networks on
node classification. arXiv preprint arXiv:1907.10903.
Roondiwala, M., Patel, H., and Varma, S. (2017). Predicting
stock prices using LSTM. International Journal of
Science and Research, 6(4):1754–1756.
Rusch, T. K., Bronstein, M. M., and Mishra, S. (2023). A
survey on oversmoothing in graph neural networks.
arXiv preprint arXiv:2303.10993.
Sawhney, R., Agarwal, S., Wadhwa, A., Derr, T., and Shah,
R. R. (2021a). Stock selection via spatiotemporal hy-
pergraph attention network: A learning to rank ap-
proach. In 35th AAAI Conference on Artificial Intelli-
gence, pages 497–504.
Sawhney, R., Agarwal, S., Wadhwa, A., and Shah, R.
(2020). Deep attentive learning for stock movement
prediction from social media text and company cor-
relations. In Conference on Empirical Methods in
Natural Language Processing (EMNLP), pages 8415–
8426.
Sawhney, R., Agarwal, S., Wadhwa, A., and Shah, R.
(2021b). Exploring the scale-free nature of stock mar-
kets: Hyperbolic graph learning for algorithmic trad-
ing. In Proceedings of the Web Conference, pages 11–
22.
Schwert, G. W. (2002). Stock volatility in the new millen-
nium: how wacky is NASDAQ? Journal of Monetary
Economics, 49(1):3–26.
Shahzad, S. J. H., Hernandez, J. A., Rehman, M. U., Al-
Yahyaee, K. H., and Zakaria, M. (2018). A global
network topology of stock markets: Transmitters and
receivers of spillover effects. Physica A: Statistical
Mechanics and its Applications, 492:2136–2153.
Shi, Z. and Cartlidge, J. (2022). State dependent paral-
lel neural Hawkes process for limit order book event
stream prediction and simulation. In 28th ACM
SIGKDD Conference on Knowledge Discovery and
Data Mining, pages 1607–1615.
Veli
ˇ
ckovi
´
c, P., Cucurull, G., Casanova, A., Romero, A., Li
`
o,
P., and Bengio, Y. (2018). Graph attention networks.
In International Conference on Learning Representa-
tions (ICLR).
Wang, X., Ma, Y., Wang, Y., Jin, W., Wang, X., Tang, J.,
Jia, C., and Yu, J. (2020). Traffic flow prediction via
spatial temporal graph neural network. In Proceedings
of the web conference, pages 1082–1092.
DGDNN: Decoupled Graph Diffusion Neural Network for Stock Movement Prediction
441

Wen, Q., Zhou, T., Zhang, C., Chen, W., Ma, Z., Yan, J.,
and Sun, L. (2022). Transformers in time series: A
survey. arXiv preprint arXiv:2202.07125.
Wu, Z., Pan, S., Long, G., Jiang, J., and Zhang, C. (2019).
Graph wavenet for deep spatial-temporal graph mod-
eling. In 28th International Joint Conference on Arti-
ficial Intelligence (IJCAI), pages 1907–1913.
Xiang, S., Cheng, D., Shang, C., Zhang, Y., and Liang,
Y. (2022). Temporal and heterogeneous graph neu-
ral network for financial time series prediction. In
31st ACM International Conference on Information &
Knowledge Management, pages 3584–3593.
Xu, K., Li, C., Tian, Y., Sonobe, T., Kawarabayashi, K.-
i., and Jegelka, S. (2018). Representation learning
on graphs with jumping knowledge networks. In In-
ternational Conference on Machine Learning (ICML),
pages 5453–5462.
Xu, Y. and Cohen, S. B. (2018). Stock movement predic-
tion from tweets and historical prices. In 56th An-
nual Meeting of the Association for Computational
Linguistics, pages 1970–1979.
Ye, J., Zhao, J., Ye, K., and Xu, C. (2021). Multi-graph
convolutional network for relationship-driven stock
movement prediction. In 25th International Confer-
ence on Pattern Recognition, pages 6702–6709.
Yoo, J., Soun, Y., Park, Y.-c., and Kang, U. (2021). Accu-
rate multivariate stock movement prediction via data-
axis Transformer with multi-level contexts. In 27th
ACM SIGKDD Conference on Knowledge Discovery
& Data Mining, pages 2037–2045.
Yue, P., Fan, Y., Batten, J. A., and Zhou, W.-X. (2020).
Information transfer between stock market sectors:
A comparison between the usa and china. Entropy,
22(2):194.
Zeng, H., Zhang, M., Xia, Y., Srivastava, A., Malevich, A.,
Kannan, R., Prasanna, V., Jin, L., and Chen, R. (2021).
Decoupling the depth and scope of graph neural net-
works. Advances in Neural Information Processing
Systems (NeurIPS), 34:19665–19679.
Zhang, Q., Chang, J., Meng, G., Xiang, S., and Pan, C.
(2020). Spatio-temporal graph structure learning for
traffic forecasting. In 34th AAAI Conference on Arti-
ficial Intelligence, pages 1177–1185.
Zhao, J., Dong, Y., Ding, M., Kharlamov, E., and Tang, J.
(2021). Adaptive diffusion in graph neural networks.
Advances in Neural Information Processing Systems,
34:23321–23333.
Zhu, Y., Xu, W., Zhang, J., Du, Y., Zhang, J., Liu,
Q., Yang, C., and Wu, S. (2021). A survey on
graph structure learning: Progress and opportunities.
arXiv:2103.03036 https://doi.org/10.48550/arXiv.210
3.03036.
ICAART 2024 - 16th International Conference on Agents and Artificial Intelligence
442
