Anomaly Detection and Localization for Images of Running Paper Web
in Paper Manufacturing
Afshin Dini
1,∗ a
, Marja Mett
¨
anen
2,† b
and Esa Rahtu
1,∗ c
1
Unit of Computing Sciences, Tampere University, Tampere, Finland
2
Procemex Oy Ltd, Jyv
¨
askyl
¨
a, Finland
∗
fi fi
†
marja.mettanen@procemex.com
Keywords:
Anomaly Detection, Anomaly Localization, Running Paper Web Defects, Paper Manufacturing.
Abstract:
We introduce a new method based on convolutional autoencoders to detect and locate paper web anomalies
that can cause web breaks during the paper production process. In this approach, we pre-process the images,
captured by two high-speed cameras located at the opposite sides of the running paper web at a paper machine,
in several steps to remove noises and separate the paper web areas from the background. After designing
and training a convolutional autoencoder with non-anomalous samples, a novel anomaly score and map are
defined to find and locate web irregularities based on an edge detector and a reconstruction error, defined
by the combination of absolute error and Structural Similarity Index Measure between the reconstructed and
the original images, in each test sample. By assessing the proposed approach on the images taken from a
real paper machine, we discover that this method can detect paper defects properly and, therefore it has the
potential to improve machine functionality and even to prevent certain types of web breaks, which reduces the
machine downtime, paper losses, maintenance costs, and energy consumption, i.e., increases the performance
and efficiency of paper machinery.
1 INTRODUCTION
Anomalies, also known as outliers, refer to the sam-
ples that differ significantly from the normal patterns
of the majority of data (Yang et al., 2021). Anomaly
detection involves the process of finding anomalous
samples within a dataset, while anomaly localization
refers to the techniques of specifying the defective
area within an anomalous sample (Pang et al., 2021).
Anomaly detection has a wide range of applica-
tions across various industries, such as manufactur-
ing and quality control (Rippel and Merhof, 2023),
cybersecurity (Alabadi and Celik, 2020), and health
monitoring (Fernando et al., 2021). In this work, we
mainly focus on the visual application of anomaly
detection in manufacturing products, specifically for
identifying defects in images taken from running pa-
per webs, which helps to predict and prevent web
breaks that may happen when dirt or tear appears on
the rapidly running paper web.
Generally, paper machines are designed for con-
tinuous operations and will only be shut down for
a
https://orcid.org/0000-0001-6234-3322
b
https://orcid.org/0000-0002-3863-0484
c
https://orcid.org/0000-0001-8767-0864
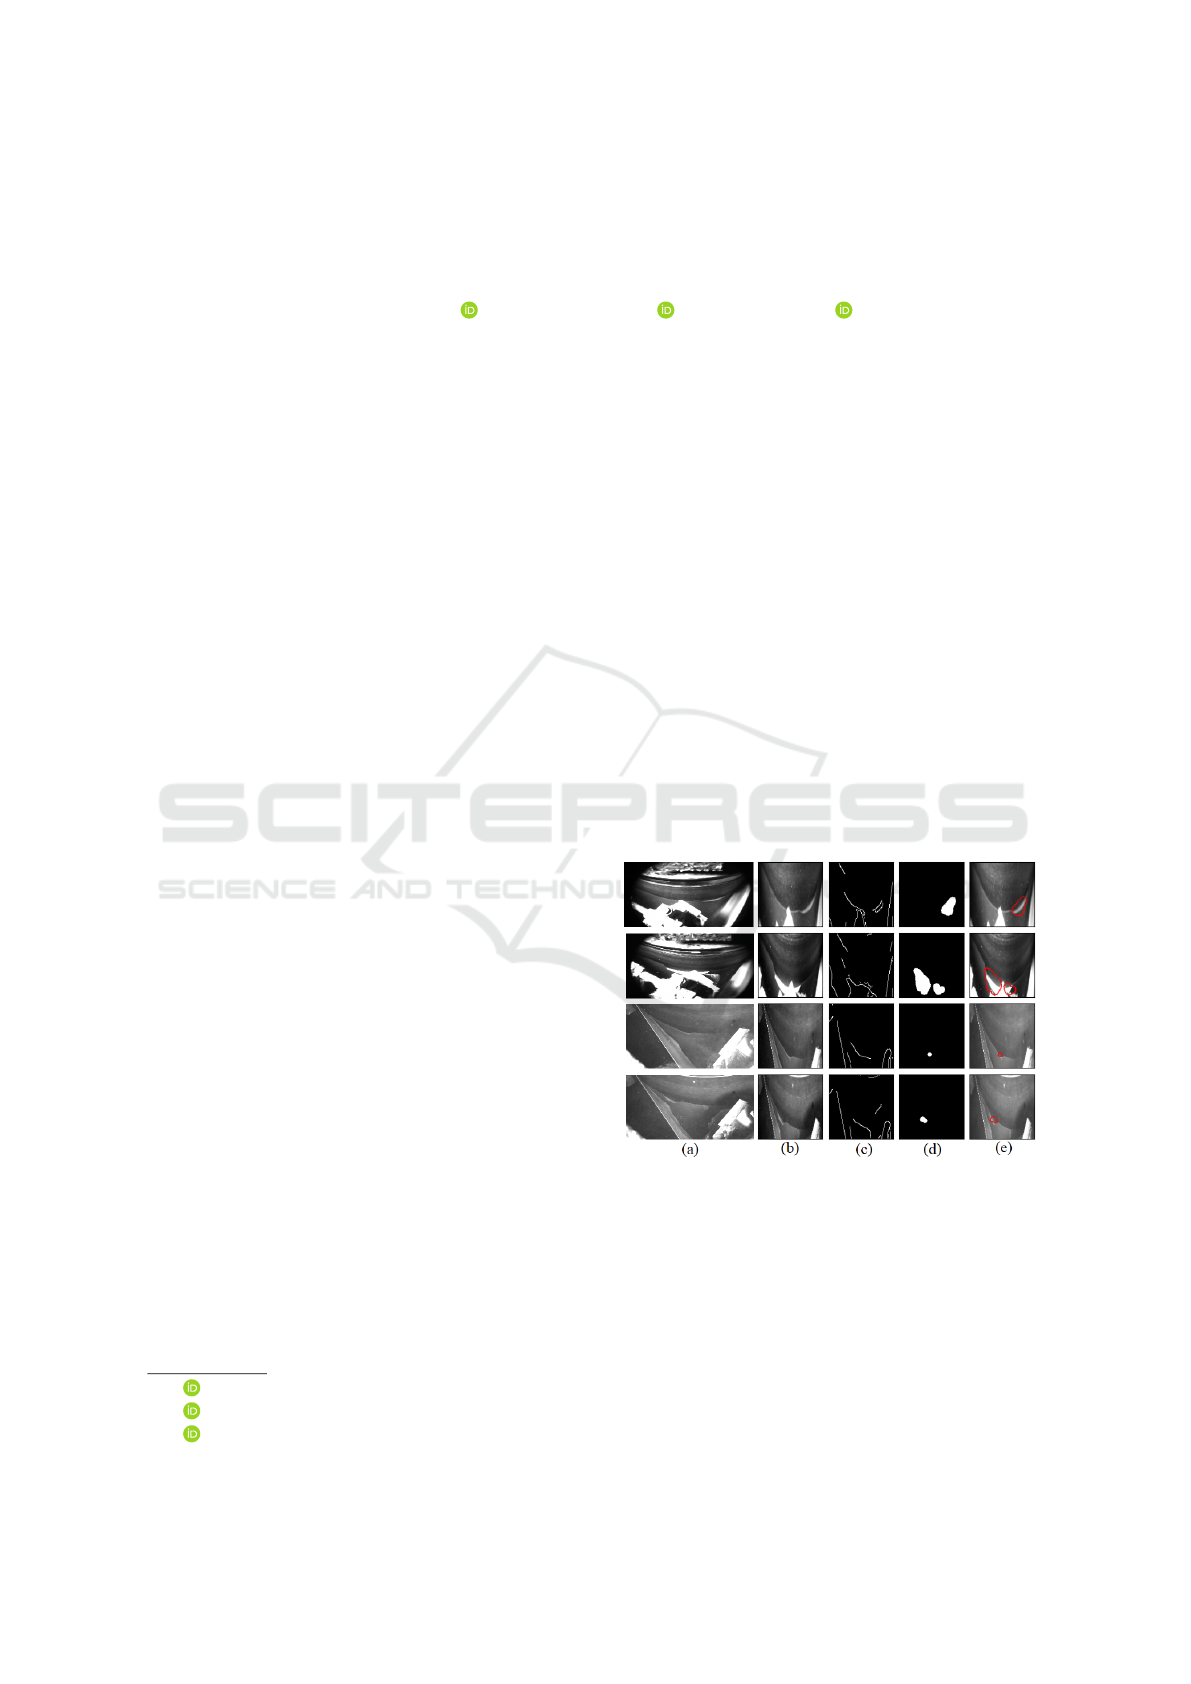
Figure 1: Detecting and locating anomalies in paper images
taken from the front and back cameras installed in a paper
machine. (a) Original image, (b) Cropped region of inter-
est (RoI) including the paper web area, (c) prominent area
detected by the edge detector, (d) Final anomaly map, (e)
Anomalies highlighted on the top of the original RoI.
predetermined maintenance periods that may take ap-
proximately three weeks annually. In this regard,
unexpected stops, caused mainly by accidental web
breaks, require equipment cleaning and additional
maintenance periods, which not only increase ma-
chine downtime, paper losses, energy consumption,
678
Dini, A., Mettänen, M. and Rahtu, E.
Anomaly Detection and Localization for Images of Running Paper Web in Paper Manufacturing.
DOI: 10.5220/0012406200003660
Paper published under CC license (CC BY-NC-ND 4.0)
In Proceedings of the 19th International Joint Conference on Computer Vision, Imaging and Computer Graphics Theory and Applications (VISIGRAPP 2024) - Volume 2: VISAPP, pages
678-685
ISBN: 978-989-758-679-8; ISSN: 2184-4321
Proceedings Copyright © 2024 by SCITEPRESS – Science and Technology Publications, Lda.

and maintenance expenses but also reduce the prod-
uct quality and efficiency of the machine (Dias et al.,
2021). Due to these reasons, many companies try to
monitor the running webs to detect and analyze the
reasons for probable breaks in paper machines.
Many methods have been developed attempting to
estimate paper web break sensitivity by using fuzzy
logics (Ahola and Juuso, 2006), calculating paper
break sensitivity (Bonissone and Goebel, 2002), or
using classification approaches on the equipment’s
status (Sorsa et al., 1992). However, these algorithms
only focus on detecting potential web break sensitiv-
ity indicators and cannot identify the root cause of
the break. Moreover, none of them has tried to de-
tect web anomalies from paper images as developing
a high-performance visual detection method for this
application is a challenging task due to some inherent
complexities of the problem, such as rarity, unpre-
dictability, unknownness, and variety of web irregu-
larities, the existence of large noises, and the quality
and availability of labeled data (Liu et al., 2023).
The main difficulty of visual anomaly detection
in paper production lines is the varying image qual-
ity caused by light conditions, camera instability, en-
vironmental contaminants, and the high-speed nature
of the process (Sorsa et al., 1992). Producing paper
from pulps generates dust, debris, and contaminants
(Haile et al., 2021) that affect the quality of images
and create noises in the images by reflecting the light.
Moreover, due to the narrow space and limited possi-
bilities to attach the cameras to the desired positions
around the paper machine, some machine instruments
irrelevant to the paper web may appear in the images,
which makes defect detection more challenging. Be-
sides, various light conditions change the contrasts of
images, and the high-speed nature of the process may
also create some vibration and motion blur in the web
area, resulting in poor quality of the available images,
as is shown in Fig.1.
On the other hand, irregularities rarely occur dur-
ing the normal paper production process, making
it impractical to gather labeled anomalous samples
(Pang et al., 2021) for training a supervised method
(Rippel and Merhof, 2023) in reality. Moreover, the
locations, sizes, and types of anomalies are unknown
and unpredictable (Chandola et al., 2009), making the
detection process even more difficult.
To deal with the abovementioned complexities,
we present an efficient method based on an autoen-
coder (Tsai and Jen, 2021) with an edge-based atten-
tion mechanism to detect web anomalies from paper
images. The model is trained in such a way that it
can decode normal images properly from the encoded
space while the anomalies cannot be recreated appro-
priately from the latent space, as a result of which the
web defects will appear in the reconstruction error.
To detect and locate abnormalities, a new anomaly
score and map are defined based on the combination
of Structural Similarity Index Measure (SSIM) (Has-
san and Bhagvati, 2012) and the absolute error (L1)
between the reconstructed and original images. More-
over, in order to reduce the false detection alarms
mainly resulting from the imperfect reconstruction
of the moving machine parts and irregular illumina-
tion conditions inside the region of interest, we apply
edge-based attention to focus on defects that occur in
prominent areas, specifically on paper edges.
It is shown in section 3 that our approach is the
first method that properly adapts a visual anomaly de-
tection technique for detecting irregularities in paper
images that can cause web breaks in paper machines.
By assessing our method on the images taken from a
real paper machine, section 4, we demonstrate that not
only can this method detect subtle and large anoma-
lies properly in a noisy imaging environment, but also
it reduces the false detection rate which is very im-
portant in real applications as too high false detection
rate practically drives the operators to deem the alarm
system unreliable and to turn it off.
2 RELATED WORK
Although a few methods, developed mainly based on
fuzzy logics (Ahola and Juuso, 2006) and calculating
paper sensitivity (Bonissone and Goebel, 2002), at-
tempt to detect web breaks in paper machines, there is
still room for further improvement due to the inherent
complexities of this problem. Since this paper is the
first one in the literature that attempts to apply com-
puter vision techniques to paper images to detect and
locate defects that can lead to web breaks, we intro-
duce state-of-the-art anomaly detection methods (Liu
et al., 2023) in this section that might apply to this
problem and discuss their advantages and limitations.
Many semi-supervised approaches (Pang et al.,
2021), varying from autoencoders to self-supervised
approaches and one-class classifiers that only utilize
normal samples for training purposes, have been de-
veloped to deal with anomaly detection and localiza-
tion in visual applications. Autoencoders (AEs) (Tsai
and Jen, 2021), the most common and simplest meth-
ods, are designed to reconstruct an image from a la-
tent space in such a way that only normal patterns
will be reconstructed properly while the defective ar-
eas will be missed, as a result of which the difference
between the original and reconstructed samples can
be used to detect anomalies. Many variants of au-
Anomaly Detection and Localization for Images of Running Paper Web in Paper Manufacturing
679

Figure 2: Sample images from paper machine demonstrat-
ing Region of Interest (RoI), anomalies, dirty background,
and the existence of other elements. (left) Front camera,
(right) Back camera.
toencoders with different types of topologies and loss
functions (Bergmann et al., 2018; Bionda et al., 2022)
are developed to detect visual anomalies.
Convolutional autoencoders (CAE) (Tsai and Jen,
2021) are the simplest forms of autoencoders that uti-
lize several convolutional layers in their architecture.
On the other hand, variational autoencoders (VAEs)
(An and Cho, 2015) employ the distribution of latent
space to increase the accuracy. In these methods, it
is assumed that the latent space adheres to a specific
probability distribution, commonly a Gaussian distri-
bution. This distribution is used to create a regular-
ization error alongside the reconstruction error to en-
courage the latent space to follow the Gaussian dis-
tribution, enhancing the model’s efficiency. Although
autoencoders are simple in structure and can detect
large defects properly, they face problems in detecting
small anomalies, specifically in the presence of large
noises (Liu et al., 2023), which limits their usage in
paper anomaly detection problems.
On the other hand, self-supervised approaches
such as TPSAD (Dini and Rahtu, 2022) and CutPaste
(Li et al., 2021) attempt to train a model with normal
samples and simulated irregularities generated from
a pre-defined proxy, which gives a better representa-
tion of the images for detecting irregularities. Most of
these methods utilize a pre-trained model as the back-
bone structure and then fine-tune it based on the nor-
mal and simulated samples. Although these methods
are able to detect small and large defects accurately,
they are sensitive to noises (Dini and Rahtu, 2022)
in such a way that even small noises in the images
increase the false detection rate significantly. More-
over, simulating anomalies on the small area of the
paper web is a big challenge in these methods as the
web area represents only a small portion of the entire
image compared to the background, Fig. 2.
One-class classifier methods such as (Dini and
Rahtu, 2023) and PSVDD (Yi and Yoon, 2020) are
other types of semi-supervised approaches that at-
tempt to establish a decision boundary in the feature
space of normal images and identify anomalous sam-
ples by recognizing those that fall outside this bound-
ary. Some of these methods, like PSVDD (Yi and
Yoon, 2020), divide the image into patches and at-
tempt to find irregular patches, while others, such
as (Dini and Rahtu, 2023), detect outliers based on
the overall representation of images. Although these
methods are effective at detecting subtle defects, they
face scalability issues as the dimension of the related
feature space increases (Pang et al., 2021) in addition
to the fact that noises can affect their performance
significantly. Moreover, analyzing patches separately
for finding defects requires more computational re-
sources in the training and testing phases, which lim-
its the usage of these methods in real-time processes.
3 METHOD
3.1 Overview
The proposed anomaly detection approach consists of
three main phases: pre-processing, training, and test-
ing. The pre-processing phase is responsible for filter-
ing, cropping, and resizing the train and test images in
such a way that the final model is more robust against
the noises and varying imaging conditions.
The convolutional autoencoder learns the normal
patterns of the webs in the second phase since only
normal images are used in the training process. In
other words, in the case of web defects in the test sam-
ples, the model replaces them with normal patterns as
it only has the information of normality.
In the testing phase and with the help of SSIM and
L1 errors, post-processing filters, and an edge detec-
tor, an anomaly map is created for each test sample.
The anomaly map indicates the exact locations of web
defects in the test image, and the average value of the
map expresses the level of abnormality of the image.
It is good to mention that the edge detector plays a
significant role in reducing false detection alarms as
it filters out the large parts of the noise in the recon-
struction error map. The model architecture of the
proposed method is described in detail in Fig. 3.
3.2 Pre-Processing Procedures
Pre-processing step plays an important role in increas-
ing the accuracy of the proposed method. Finding pa-
per web anomalies from original images is a challeng-
ing task as they contain many irrelevant elements, and
the web areas represent only a small portion of the en-
tire images, Fig. 2. To address these complexities, the
VISAPP 2024 - 19th International Conference on Computer Vision Theory and Applications
680
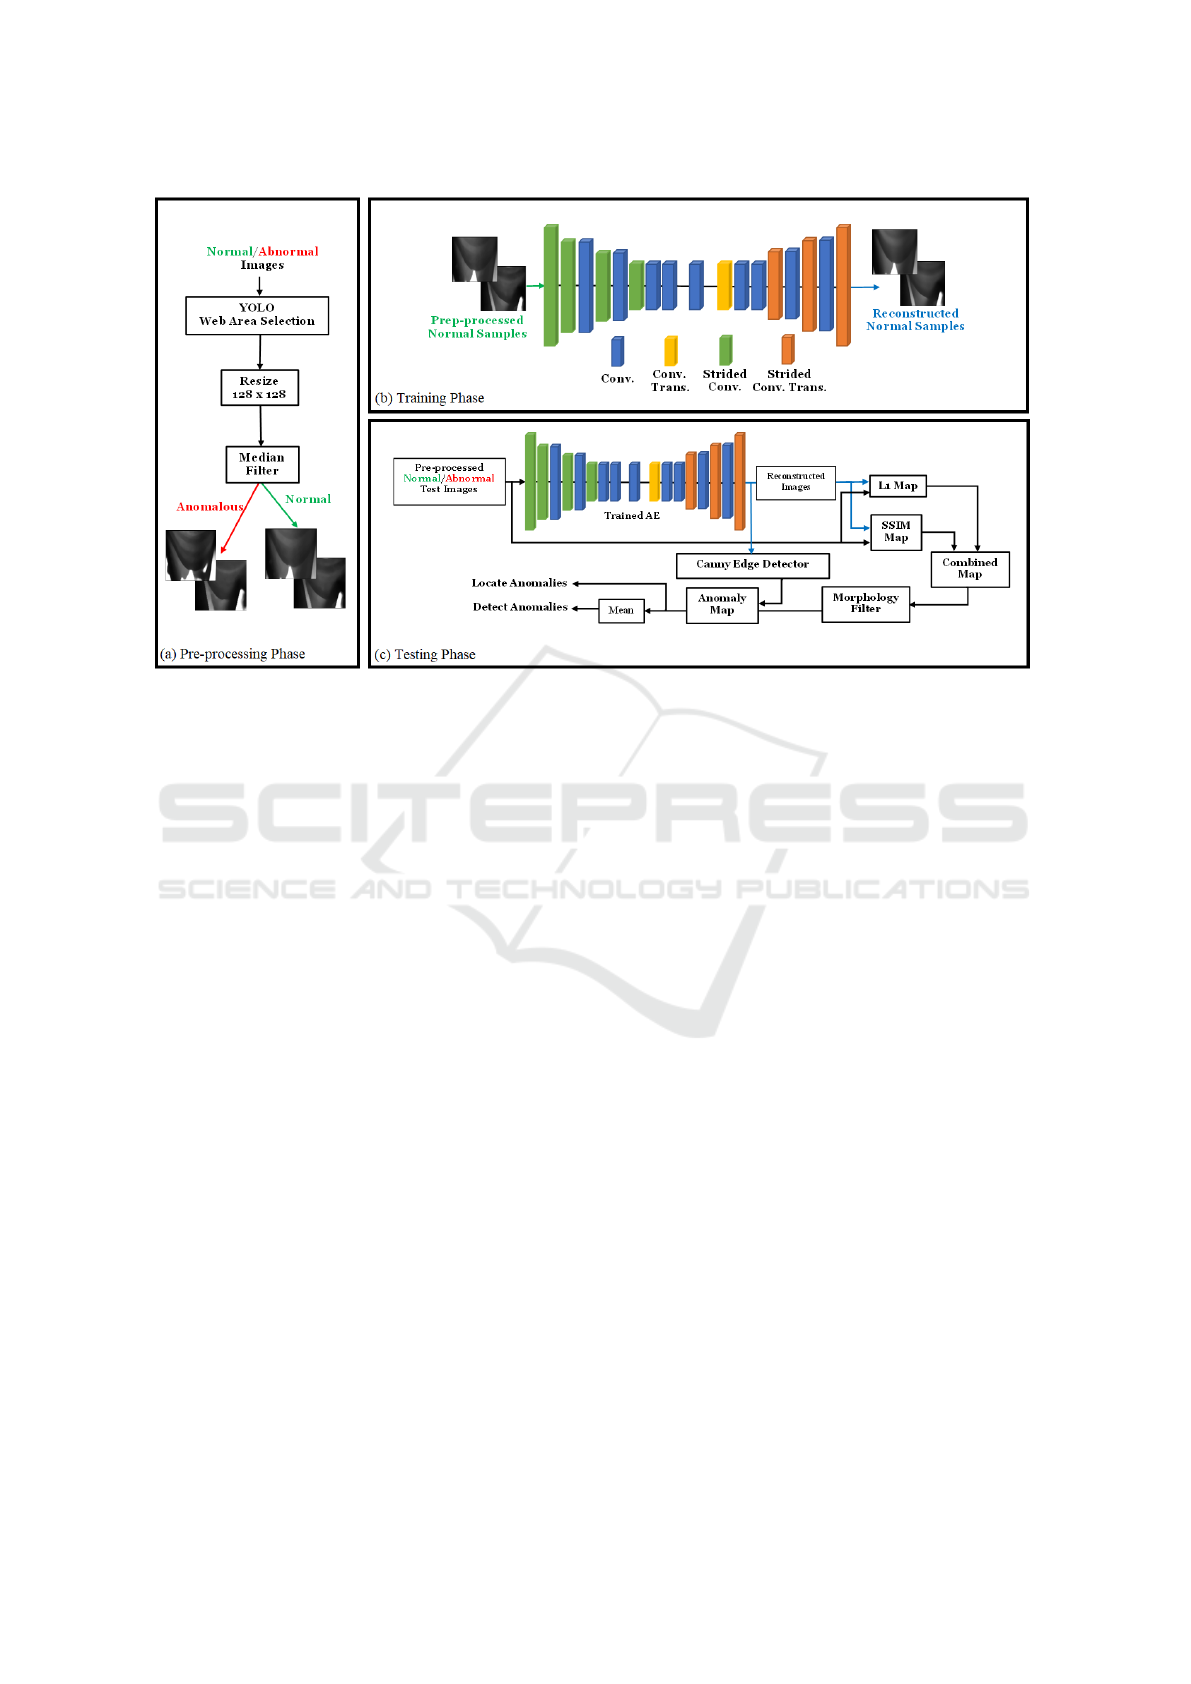
Figure 3: Overview and model architecture of the proposed method for anomaly detection and localization in paper images.
(a) Pre-processing steps to specify web areas with YOLO (Adarsh et al., 2020) and filter noises with median filter, (b) Training
the autoencoder model. (c) Testing phase to detect and locate defects with the help of edge detector.
YOLO (Adarsh et al., 2020) model is applied to the
images to detect the web areas as the region of interest
(RoI) to be utilized in the training phase. Specifically,
the RoI in our application contains the paper web area
and excludes large parts of the background. These re-
gions of interest are resized to 128 × 128 to have the
same size.
Due to the light reflection from dust and debris
generated in the normal paper production process,
white areas with different sizes appear in the images,
which might be considered anomalies in the testing
phase. To circumvent that, a median filter is utilized
to filter small and medium noises. It is obvious from
the images shown in Fig. 3(a) and more clearly in Fig.
5 that the web area and anomalies remain intact after
filtering while the noises are filtered properly.
3.3 Model Architecture and Training
In the autoencoder-based methods, selecting a suit-
able model architecture is crucial and has a signifi-
cant impact on the method’s performance (Liu et al.,
2023). An appropriate model should be able to cap-
ture semantic and detailed information to accurately
recreate non-anomalous areas while avoiding defects.
In deep autoencoders with large bottlenecks, the
model can reconstruct both normal and abnormal ar-
eas simultaneously, often leading to difficulties in de-
tecting anomalies due to small reconstruction errors
in the anomalous areas. Very shallow models may
struggle to properly reconstruct even normal images,
which can result in normal samples being falsely con-
sidered anomalies. Finding the right balance in the
model architecture and bottleneck size is crucial to
detect anomalies accurately without compromising
reconstruction capabilities (Tsai and Jen, 2021).
To design a proper model, an encoder with 8 con-
volutional layers is utilized to encode images to a la-
tent space, and then a decoder with 8 layers is used
to reconstruct the image from the latent space as is
shown in Fig. 3(b). We find out that using a combina-
tion of convolutional and convolutional transpose lay-
ers allows the decoder to give a better reconstruction
image compared to using only convolutional trans-
pose layers. The proposed model learns the normal
patterns of web areas as it is trained with normal im-
ages while using the SSIM loss function as follows:
L
SSIM
=
N
∑
i=1
(1 − SSIM(x
i
, D(E(x
i
)))) (1)
where x
i
∈ X
N
is a training image and X
N
is the set of
normal samples used in the training phase. E(x
i
) rep-
resents the encoded space of the training sample x
i
,
while D(E(x
i
)) represents the related reconstructed
image. SSIM(x
i
, D(E(x
i
))) calculates the structural
similarity between the original and reconstructed im-
ages according to (Hassan and Bhagvati, 2012).
Anomaly Detection and Localization for Images of Running Paper Web in Paper Manufacturing
681
3.4 Web Anomalies Detection and
Localization
To detect abnormal samples, it is essential to assign a
numerical value, known as an anomaly score, to each
data sample. By establishing an appropriate thresh-
old on these scores, we can distinguish defective sam-
ples. Likewise, an anomaly map can be generated
by attributing anomaly scores to individual pixels in
an image, aiding in the identification of irregularities
present in the corresponding abnormal samples.
To identify and locate web defects in the testing
phase, each test sample is fetched into the trained
model, and then the L1 and SSIM maps are created
based on the difference between the original and re-
constructed images. After setting a threshold on these
maps and combining them together, a morphology fil-
ter is applied to remove the salty noises in the maps.
To reduce the false detection alarms generated
from large noises, dirty backgrounds, and the exis-
tence of irrelevant elements, the edges of the paper
web in each test image are found by the Canny edge
detector (Canny, 1986), and then the overlaps be-
tween the filtered map and the web edges are used
to create the final anomaly map. The average values
of anomaly maps are thresholded to detect anomalous
samples, and the related anomaly map represents the
exact location of web anomalies. The testing phase is
shown in Fig. 3(c) in detail.
4 EXPERIMENT
4.1 Dataset
To evaluate the performance of our method on
a real-world application, we gather high-resolution
grayscale images from two high-speed cameras in-
stalled on the front and back sides of a roller of a paper
machine. The training dataset contains only normal
samples for training the autoencoder, while the testing
dataset contains a few images with anomalies in addi-
tion to the normal ones, as is shown in Tab. 1. Images
from the front camera have 2040 × 1020 resolution
while images from the back camera are 764 × 540.
Table 1: Number of samples in the test and train datasets
for the front and back cameras installed in a paper machine.
Group
Train Dataset Test Dataset
Normal Normal Anomaly
Front Cam. 5000 1318 19
Back Cam. 5970 1100 35
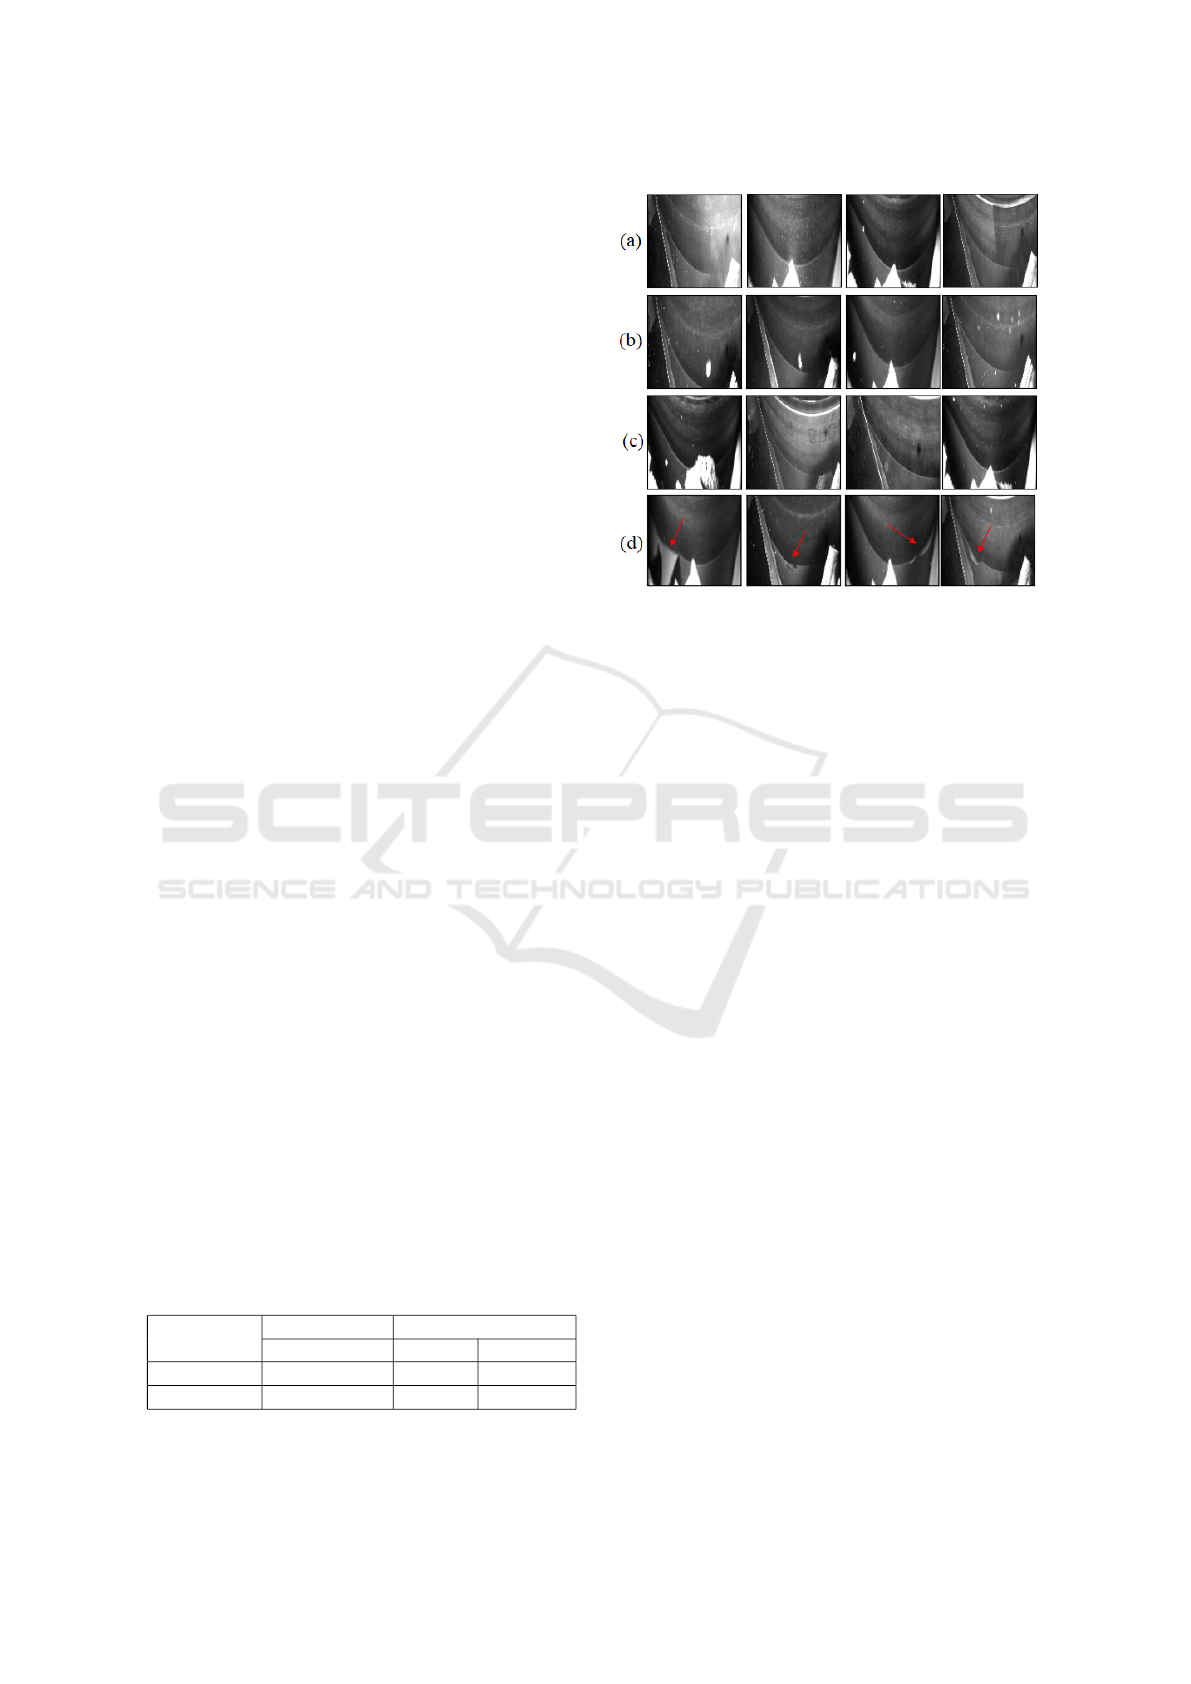
Figure 4: Samples variety and web defect detection chal-
lenges. (a) Normal images with various qualities and con-
trasts, (b) Normal samples with noises originating from
light reflection from particles in the air, (c) Normal images
containing various types of irrelevant elements and texts, (d)
Anomalous images with various defect sizes and locations.
This dataset contains various images that repre-
sent the challenges of detecting paper web anomalies,
mentioned in section 1, which makes it a suitable can-
didate to assess the performance and generalizability
of the proposed method. Due to the harsh conditions
at the paper production line, the images of this dataset
have various qualities, Fig. 4(a), contain small and
large noises, Fig. 4(b), and consist of multiple objects
and uneven background that changes from image to
image because the cylinder is rotating, Fig. 4(c). On
the other hand, the web defects have various sizes,
shapes, and contrasts that represent the unpredictabil-
ity property of the anomalies properly, Fig. 4(d).
4.2 Metrics
To present our results, we calculated the accuracy,
false positive rate (FPR), and false negative rate
(FNR) for each camera dataset based on the best
threshold and compared the results of our method
with the recent anomaly detection approaches.
It is important to mention that accuracy alone
might not be a proper metric to evaluate the perfor-
mance of a defect detector as anomaly detection can
be considered an imbalanced classification problem
in which the number of anomalous samples is signifi-
cantly less than the number of normal samples, result-
ing in the fact that a detector that detects all samples
as normal ones will end up in high accuracy. How-
ever, it is still a useful metric as one can understand
the difference between the method that cannot label
VISAPP 2024 - 19th International Conference on Computer Vision Theory and Applications
682

the normal or anomalous samples properly and the
one that is able to do so at first glance. On the other
hand, the false positive and negative rates are proper
metrics to describe the ability of the method to detect
anomalous samples while avoiding false detections.
4.3 Implementation Details
To detect paper web anomalies, two separate autoen-
coders are trained with the images gathered from each
camera. These models are optimized with the pre-
processed normal samples, filtered with a median fil-
ter of size 9, and resized to 128 × 128. The Adam
optimizer with a learning rate of 0.0002 and decay of
0.00001 is used for updating the model parameters for
200 epochs, considering SSIM as the loss function.
To create the anomaly map, the SSIM map with
the kernel size of 5 (for the front camera) and 7 (for
the back camera) are combined with the L1 map and
then filtered with a 4 × 4 morphology filter to remove
the salty noises. The overlap of the resulting map with
the prominent edge areas, detected by the edge-based
detector, defines the final anomaly map.
4.4 Results
We evaluated our approach on the above-mentioned
real dataset and calculated the accuracy, false positive
rate, and false negative rate for each camera dataset
to demonstrate the ability of the proposed method
while dealing with the paper web defect detection
challenges. As there are no similar computer vision
methods in the literature for detecting web anoma-
lies from paper images to which we can compare the
performance of our method, we also run a few im-
age anomaly detection methods on the dataset, such
as a self-supervised method TPSAD (Dini and Rahtu,
2022), a patch-wise one-class classifier method (Dini
and Rahtu, 2023), a variational autoencoder (An and
Cho, 2015), and convolutional encoders with various
loss functions (Bergmann et al., 2018; Tsai and Jen,
2021) and compare the results in Tab. 2.
In general, our expectation is that our method ac-
curately detects defects without mistakenly identify-
ing anomalies in normal images or missing anoma-
lous samples, resulting in high accuracy and low false
positive and negative rates. It is important to men-
tion that reducing the false positive rate is an impor-
tant issue in our application as the cameras installed
in paper machines are high-speed cameras, operating
around 50-100 FPS, that take a lot of images from the
high-speed running paper web during the production
process. In this regard, even a small reduction in false
positive rate can improve the usability of the defect
alarming system considerably, considering the huge
number of images taken daily in real applications.
In terms of accuracy, it can be deducted from Tab.
2 that our approach has better accuracy than other
methods, implying the fact that most normal samples
are labeled properly, as well as some of the abnormal
samples, with different shapes, contrasts, and sizes of
anomalies. By comparing the accuracy of different
methods in Tab. 2, one can conclude that TPSAD and
patch-wise methods are not able to label normal sam-
ples properly, considering the fact that their accura-
cies are low. By analyzing the results, we find out
that many normal samples are detected as abnormal
ones mistakenly by the Patch-wise OCC and TPSAD
methods due to the existence of noises in the images.
Moreover, by comparing the false positive rates in
Tab. 2, we find out that our approach has the smallest
FPR amongst all the compared methods. This can be
considered as one of the prominent achievements in
our work, as it indicates that our method can properly
reduce the false alarms that might be caused by the
noisy environment in our application.
By comparing the false negative rates of the pro-
posed method with other approaches, we discover that
VAE (An and Cho, 2015), CAE (Tsai and Jen, 2021),
and the one-class classifier (Dini and Rahtu, 2023)
Table 2: Comparison of our approach with the recent methods, CAE (SSIM) (Bergmann et al., 2018), CAE(SSIM, L1) (Tsai
and Jen, 2021), VAE (An and Cho, 2015), TPSAD (Dini and Rahtu, 2022), and Patch-wise One-Class Classifer (Dini and
Rahtu, 2023) results in paper web defect detection using accuracy, FPR, and FNR metrics.
Group
Back Camera Front Camera
Acc (%) FPR (%) FNR (%) Acc (%) FPR (%) FNR (%)
CAE(SSIM) (Bergmann et al., 2018) 98.23 0.45 40.0 98.65 0.38 68.43
CAE(SSIM,L1) (Tsai and Jen, 2021) 98.67 0.81 17.15 98.57 0.75 47.37
VAE (An and Cho, 2015) 96.03 3.7 11.5 95.43 4.09 36.85
TPSAD (Dini and Rahtu, 2022) 70.83 28.72 42.85 69.25 30.27 63.15
Patch OCC (Dini and Rahtu, 2023) 56.2 45 5.7 60.80 39.22 36.84
Ours 99.91 0.09 2.85 99.1 0.22 47.38
Anomaly Detection and Localization for Images of Running Paper Web in Paper Manufacturing
683
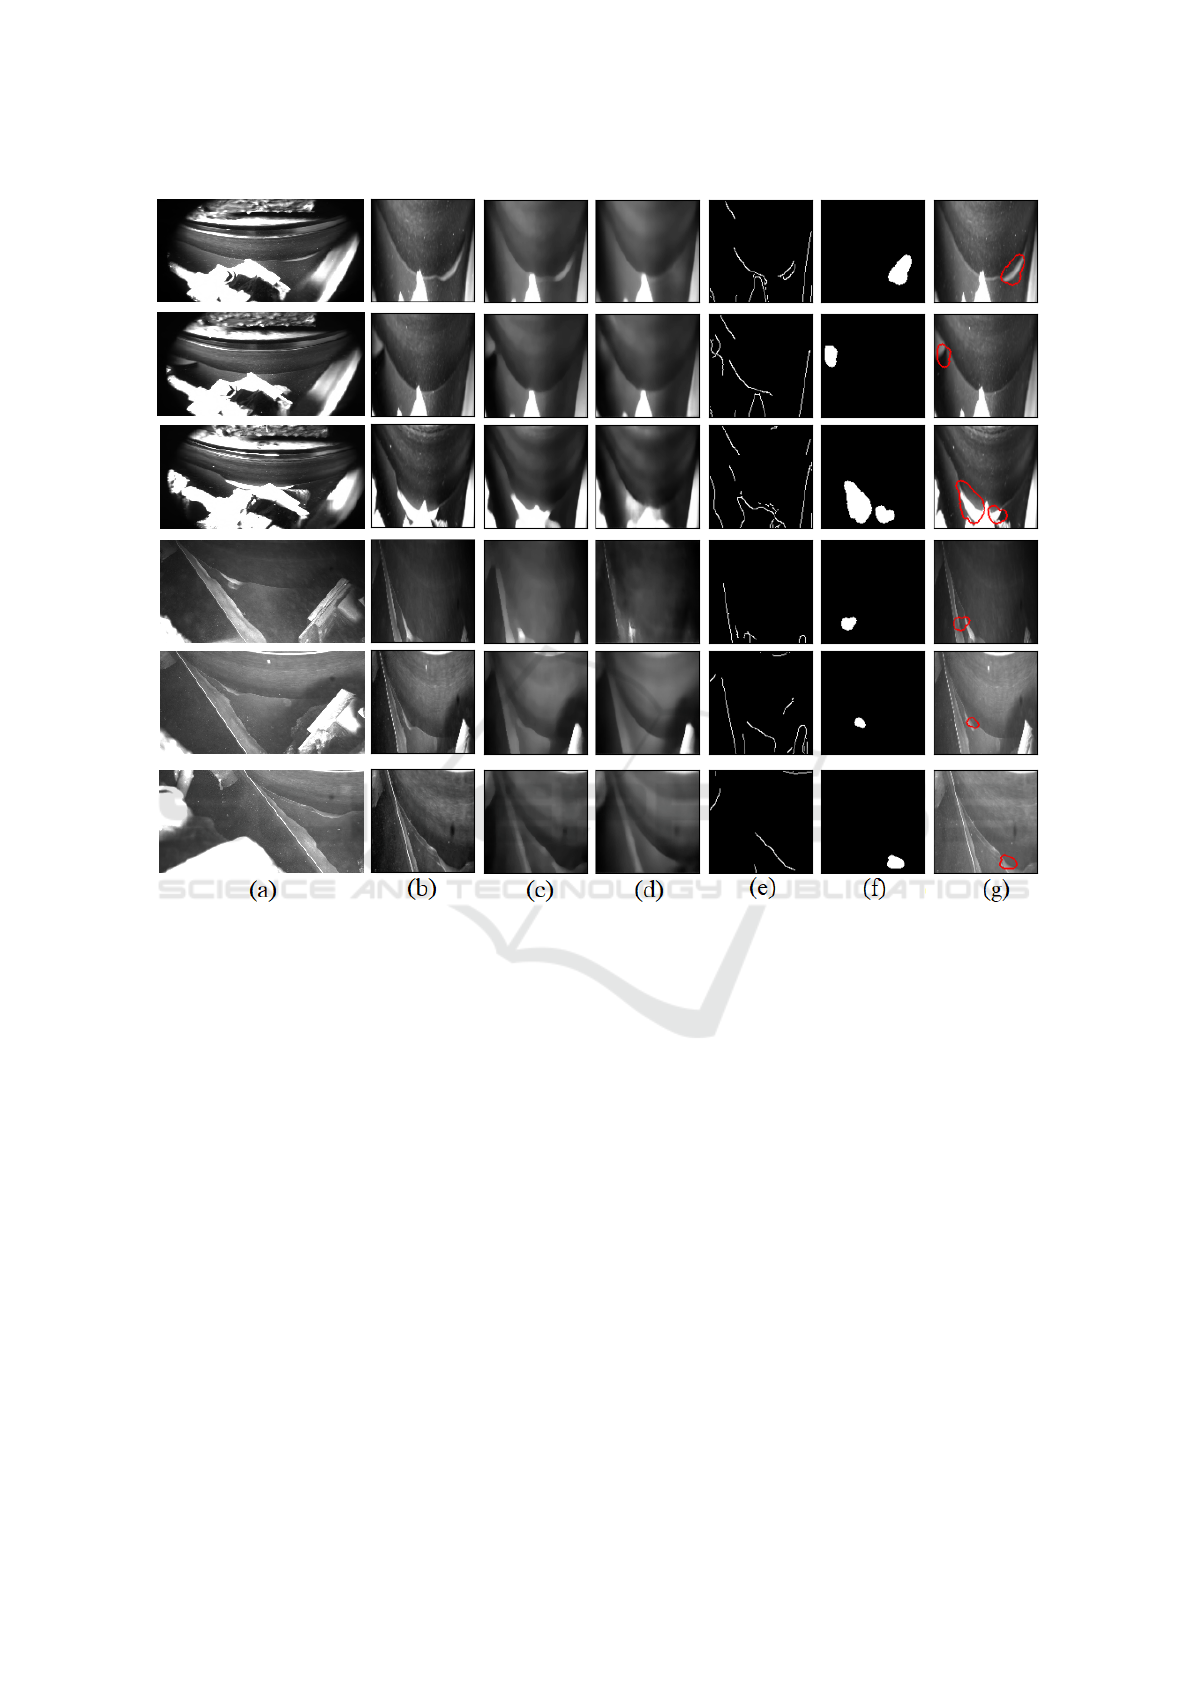
Figure 5: Visualization of paper web anomaly detection and localization using the proposed method, first three rows are
images from the back camera, and the last three rows are from the front camera. (a) Original camera frames, (b) Cropped RoI
resized to 128 × 128, (c) Filtered by median filter, (d) Reconstructed images by the trained autoencoder, (e) Prominent areas
detected by the edge attention technique, (f) Final anomaly map, (g) Located anomalies highlighted on top of the original RoI.
have lower false negative rate than our method in one
of the two camera datasets, meaning that a smaller
amount of defects are missed. However, they have
significantly larger false detection rates which limits
their usage in real applications. In other words, since
these methods are sensitive to noise, quality of im-
ages, and changing contrast in the images, they do
not show proper results in our application. Some of
the detected defects are shown in Fig. 5 indicating
the fact that our approach not only can deal with the
unknownness, unpredictability, and rarity complexi-
ties of the anomalies but also locates the web defects
properly with the help of the anomaly map.
By comparing the first three and last rows of Tab.
2, the benefits of integrating an edge detector within
our method become more evident. This integration
leads to a significant reduction in the false positive
rate by effectively filtering out the defects that occur
only in the prominent areas of the image.
It is also good to mention that our approach has
proper generalizability, according to which it can be
used in different paper machines with minimum ef-
fort. Since most of the paper production lines re-
semble each other in terms of process, structure, and
devices, one can use our three-step approach to pre-
process images, fine-tune the autoencoder, and detect
paper defects by defining a proper anomaly map with
the help of an edge detector although there might be
minor differences in the position of cameras, viewing
angles, and contrast from one machine to another one.
5 CONCLUSION
The proposed method, developed based on the convo-
lutional autoencoders for detecting and locating web
VISAPP 2024 - 19th International Conference on Computer Vision Theory and Applications
684

defects on the prominent areas of paper images de-
tected by an edge detector, is the first technique in the
literature that aims to utilize visual anomaly detection
approaches in paper applications. Through the evalu-
ation of our method on the paper images, we demon-
strate that the proposed method not only has the su-
perior ability to detect and locate different types of
unknown anomalies but also can properly deal with
the inherent complexities of the paper web defect de-
tection problem such as the effects of large and small
noises, as well as the presence of irrelevant objects
and dirty backgrounds. Showing high accuracy, low
false detection rate and low false negative rate makes
our approach a suitable candidate for detecting paper
irregularities in real-world applications.
REFERENCES
Adarsh, P., Rathi, P., and Kumar, M. (2020). Yolo v3-tiny:
Object detection and recognition using one stage im-
proved model. In 2020 6th international conference
on advanced computing and communication systems
(ICACCS), pages 687–694. IEEE.
Ahola, T. and Juuso, E. (2006). Paper web break sensi-
tivity monitoring in modern paper machines. In Pro-
ceedings of the 11th International Conference, IPMU
2006, Information Processing and Management of
Uncertainty in Knowledge-based Systems, 2006, Les
Cordeliers, Paris, volume 1, pages 518–525.
Alabadi, M. and Celik, Y. (2020). Anomaly detection for
cyber-security based on convolution neural network :
A survey. In 2020 International Congress on Human-
Computer Interaction, Optimization and Robotic Ap-
plications (HORA), pages 1–14.
An, J. and Cho, S. (2015). Variational autoencoder based
anomaly detection using reconstruction probability.
Bergmann, P., L
¨
owe, S., Fauser, M., Sattlegger, D., and Ste-
ger, C. (2018). Improving unsupervised defect seg-
mentation by applying structural similarity to autoen-
coders. arXiv preprint arXiv:1807.02011.
Bionda, A., Frittoli, L., and Boracchi, G. (2022). Deep au-
toencoders for anomaly detection in textured images
using cw-ssim. In International Conference on Image
Analysis and Processing, pages 669–680. Springer.
Bonissone, P. P. and Goebel, K. (2002). When will it
break? a hybrid soft computing model to predict time-
to-break margins in paper machines. In Applications
and Science of Neural Networks, and Fuzzy Systems,
volume 4787, pages 53–64. SPIE.
Canny, J. (1986). A computational approach to edge de-
tection. IEEE Transactions on pattern analysis and
machine intelligence, (6):679–698.
Chandola, V., Banerjee, A., and Kumar, V. (2009).
Anomaly detection: A survey. ACM computing sur-
veys (CSUR), 41(3):1–58.
Dias, M., Lourenc¸o, N., Silva, C., and Moniz, S. (2021).
The break point: A machine learning approach to web
breaks in paper mills. In Congress of APDIO, the Por-
tuguese Operational Research Society, pages 73–85.
Dini, A. and Rahtu, E. (2022). Tpsad: Learning to detect
and localize anomalies with thin plate spline transfor-
mation. 2022 26th International Conference on Pat-
tern Recognition (ICPR), pages 4744–4750.
Dini, A. and Rahtu, E. (2023). Visual anomaly detec-
tion and localization with a patch-wise transformer
and convolutional model. In International Joint Con-
ference on Computer Vision, Imaging and Computer
Graphics Theory and Applications. SCITEPRESS.
Fernando, T., Gammulle, H., Denman, S., Sridharan, S.,
and Fookes, C. (2021). Deep learning for medical
anomaly detection–a survey. ACM Computing Sur-
veys (CSUR), 54(7):1–37.
Haile, A., Gelebo, G. G., Tesfaye, T., Mengie, W., Mebrate,
M. A., Abuhay, A., and Limeneh, D. Y. (2021). Pulp
and paper mill wastes: utilizations and prospects for
high value-added biomaterials. Bioresources and Bio-
processing, 8:1–22.
Hassan, M. and Bhagvati, C. (2012). Structural similarity
measure for color images. International Journal of
Computer Applications, 43(14):7–12.
Li, C.-L., Sohn, K., Yoon, J., and Pfister, T. (2021). Cut-
paste: Self-supervised learning for anomaly detection
and localization. In Proceedings of the IEEE/CVF
conference on computer vision and pattern recogni-
tion, pages 9664–9674.
Liu, J., Xie, G., Wang, J., Li, S., Wang, C., Zheng, F., and
Jin, Y. (2023). Deep industrial image anomaly detec-
tion: A survey. arXiv preprint arXiv:2301.11514, 2.
Pang, G., Shen, C., Cao, L., and Hengel, A. V. D. (2021).
Deep learning for anomaly detection: A review. ACM
computing surveys (CSUR), 54(2):1–38.
Rippel, O. and Merhof, D. (2023). Anomaly detection for
automated visual inspection: A review. Bildverar-
beitung in der Automation: Ausgew
¨
ahlte Beitr
¨
age des
Jahreskolloquiums BVAu 2022, pages 1–13.
Sorsa, T., Koivo, H., and Korhonen, R. (1992). Application
of neural networks in the detection of breaks in a paper
machine. IFAC Proceedings Volumes, 25(4):219–224.
Tsai, D.-M. and Jen, P.-H. (2021). Autoencoder-based
anomaly detection for surface defect inspection. Ad-
vanced Engineering Informatics, 48:101272.
Yang, J., Xu, R., Qi, Z., and Shi, Y. (2021). Visual
anomaly detection for images: A survey. arXiv
preprint arXiv:2109.13157.
Yi, J. and Yoon, S. (2020). Patch svdd: Patch-level svdd for
anomaly detection and segmentation. In Proceedings
of the Asian conference on computer vision.
Anomaly Detection and Localization for Images of Running Paper Web in Paper Manufacturing
685
