
Characterization and Quantification of Image Quality in CT Imaging
Systems: A Phantom Study
Camilla Scapicchio
1,2 a
, Manuela Imbriani
1,3
, Francesca Lizzi
2
, Mariagrazia Quattrocchi
3
,
Alessandra Retico
2
, Sara Saponaro
1,2
, Maria Irene Tenerani
1,2
, Alessandro Tofani
3
,
Arman Zafaranchi
1,2
and Maria Evelina Fantacci
1,2
1
University of Pisa, Pisa, Italy
2
National Institute for Nuclear Physics, Pisa, Italy
3
Medical Physics Department, Azienda Toscana Nord Ovest Area Nord, Lucca, Italy
Keywords:
Computed Tomography, Image Quality, Detectability Index, CatPhan Phantom.
Abstract:
Computed Tomography (CT) is a widely used imaging technique in lung cancer screening programs. To ad-
dress the problem of exposing potentially healthy patients to ionizing radiation, Iterative Reconstruction (IR)
algorithms can be employed. Indeed, traditional Filtered Back Projection reconstruction does not deliver ad-
equate image quality with reduced dose levels. IR instead is prone to preserve diagnostic information and
resolution while reducing noise and radiation dose. We characterized image quality for two CT scanners
equipped with different iterative algorithms by using a quantitative metric, the detectability index. We com-
pared the dependence of the image quality on the dose and the iterative level when the human visual perception
is considered or not in the detectability index definition. It has been found that similar image quality can be
obtained by using different scanners and different combinations of dose and iterative levels. This allows us
to extrapolate the protocols corresponding to a lower dose while preserving as much as possible the imaging
properties.
1 INTRODUCTION
Chest Computed Tomography (CT) is the best and
most used imaging modality to detect small pul-
monary nodules that are the early radiological signs of
lung cancer (Raju et al., 2017; Kennedy et al., 2022).
It is recommended as a screening tool in high-risk
populations, thus exposing potentially healthy peo-
ple to ionizing radiation (Yeh et al., 2016; Cao et al.,
2022). For this reason, in recent years a wide effort
has been dedicated to the development of new strate-
gies to reduce the radiation dose delivered to the pa-
tient during the CT acquisition complying with the
ALARA principle (radiation doses should be kept As
Low As Reasonably Achievable) while maintaining
the same imaging properties (Smith-Bindman et al.,
2019). In particular, the advent of Iterative Recon-
struction (IR) algorithms has been one of the main
advances in CT technology introduced to reduce the
image noise in diagnostic images (Beister et al., 2012;
Caramella et al., 2018), thereby allowing for the re-
a
https://orcid.org/0000-0001-5984-0408
duction of the dose required for routine imaging.
However, the use of IR algorithms is limited by the
necessity of preserving the image quality to capture
diagnostic information. The intrinsic non-linear na-
ture of the IR reconstruction algorithms compared to
conventional Filtered Back-Projection (FBP) has been
highlighted (Dodge et al., 2016). Therefore the tra-
ditional metrics, such as the Contrast-To-Noise ratio
or the Modulation Transfer Function (MTF), appear
to be inadequate to comprehensively describe clinical
imaging performance when IR techniques are used for
image reconstruction (Samei et al., 2019). This is be-
cause IR algorithms result in object-dependent resolu-
tion and noise performances. An accurate evaluation
and optimization of the best IR blending levels for the
different possible applications is needed to define new
low-dose diagnostic protocols (Barca et al., 2018a).
Nowadays powerful instruments based on Artifi-
cial Intelligence (AI) have also been developed to ex-
tract significant diagnostic information from chest CT
images acquired with a lower radiation dose. This of-
fers new perspectives on lung cancer diagnosis and
Fantacci, M.
Characterization and Quantification of Image Quality in CT Imaging Systems: A Phantom Study.
DOI: 10.5220/0012400400003657
Paper published under CC license (CC BY-NC-ND 4.0)
In Proceedings of the 17th International Joint Conference on Biomedical Engineering Systems and Technologies (BIOSTEC 2024) - Volume 1, pages 289-296
ISBN: 978-989-758-688-0; ISSN: 2184-4305
Proceedings Copyright © 2024 by SCITEPRESS – Science and Technology Publications, Lda.
289

other lung pathologies. However, a more specific
analysis of image quality has to be implemented when
the CT scans are aimed to be provided to an AI algo-
rithm.
In this study, we characterize two CT scanners
in terms of image quality across different acquisition
and reconstruction parameters by means of phantom
image acquisitions. It is not so easy to define a com-
prehensive metric that quantifies image quality, be-
cause different objective measures can impact it, such
as resolution, noise, and contrast. Typically it is use-
ful to consider these measures separately. However,
for some applications, it is useful to have a unique
definition to quantify image quality as a whole. We
adopted a new comprehensive more adequate metric
to quantitatively define the image quality, which is the
detectability index (d’) (Samei et al., 2019). It allows
us to evaluate the joint effect of all the factors that can
impact image quality. This new index is also more
suitable to describe image quality when IR algorithms
are used.
The main objective of this study is to evaluate the
imaging properties of chest CT reconstructed with
different Iterative Reconstruction blending levels by
leveraging this new detectability index in order to find
a strategy to reduce the radiation dose delivered in
CT acquisitions without degrading the imaging prop-
erties. The possibility of using IR algorithms in con-
junction with CAD (Computer Aided Detection) sys-
tems has already been investigated as useful to bring
an improvement in image quality when very low radi-
ation exposure levels are employed (Caramella et al.,
2018; Barca et al., 2018b). In addition, nowadays
these CAD systems are being updated with new Deep
Learning-based tools (Manickavasagam et al., 2022;
Forte et al., 2022). Thus the image quality charac-
terization here proposed is finally aimed at applying
Deep Learning- or Radiomics-based image analysis
systems.
2 MATERIALS
2.1 Phantom and CT Scanners
The phantom under consideration is the model
Catphan-500 ® (The Phantom Laboratory, NY, USA).
It is a commercially available phantom commonly uti-
lized in clinical procedures for quality control aimed
at ensuring ideal imaging performance for a CT scan-
ner. It has a cylindrical shape and it is composed of
4 modules (Figure 1). Full technical specifications of
the Catphan-500 phantom can be found in the manual
(Mail, 2013).
Figure 1: Illustration of the Catphan-500 phantom model
(Mail, 2013).
In this study, the CTP401 and CTP486 modules
of the phantom were considered for the computation
of the detectability index. The CTP486 module is a
homogeneous water-equivalent module. The CTP401
module includes seven cylindrical inserts of differ-
ent materials, with the nominal CT Hounsfield Units
(HU) reported in the manual (Mail, 2013), in a uni-
form water-equivalent background.
The CT scans of the Catphan phantom have been
acquired at San Luca Hospital-Azienda Toscana Nord
Ovest (ATNO)-Lucca, Italy. We used the two CT
scanners from two different vendors available in this
hospital: Revolution Evo 64 Slice (GE Healthcare),
and Aquilon CX 128 Slice CT (Toshiba).
2.2 Image Data Acquisition
The phantom was scanned in helical modality. We
aimed to characterize image quality in conditions as
close as possible to those of lung imaging. There-
fore, we started from the institutional clinical CT pro-
tocols for diagnostic tasks in chest imaging used in the
Hospital for the two scanners ( CTDI
vol
∼ 7mGy for
the GE scanner, and CTDI
vol
∼ 8mGy for the Toshiba
scanner). Then we explored three other dose radiation
levels: high (twice the standard value, i.e. the one of
the institutional protocol), reduced (60% of the stan-
dard value), and low (30% of the standard value). We
also used four percentages of the IR blending level
(FBP alone and three increasing strength levels of the
IR algorithm available for the system, which is the
ASIR for GE and the AIDR 3D for Toshiba). A sharp
reconstruction kernel has been used in both systems:
LUNG for GE, and FC56 (equivalent to LUNG) for
Toshiba. The complete list of parameters set in the
two scanners is reported in Table 1. Each acquisition
with the same set of parameters has been repeated
3 times, each time removing and repositioning the
BIOIMAGING 2024 - 11th International Conference on Bioimaging
290
phantom. A total of 96 CT scans of the phantom were
made available at the end of the acquisition process.
3 METHODS
3.1 Image Quality Quantification
The new comprehensive more adequate task-based
metric that we used to quantify image quality is the
detectability index d’. It is based on model observer
methodologies that try to combine the system im-
age performance, the task characteristics, and the de-
gree of clinician image perception (Vennart, 1997).
The procedure to compute the detectability index is
reported in the American Association of Physicists
in Medicine task group report-23 (AAPM TG-233)
(Samei et al., 2019). We adopted the d’ definition pre-
sented in this report:
d
′2
=
h
R R
|
W
|
2
T TF
2
E
2
dudv
i
2
R R
|
W
|
2
T T F
2
NPS
2
E
2
dudv
(1)
where W is the Task function, i.e., the Fourier
transform of a synthesized ideal image of a signal to
be detected. In fact, the d’ index quantifies the degree
of separation for signal present/signal absent distribu-
tions on the image. We considered a signal with a cir-
cular shape and a designer contrast profile. The T TF
is the Task Transfer Function that is a representative
metric of spatial resolution. It replaces the traditional
MT F that may not represent the imaging system’s re-
sponse to an arbitrary input object because the system
resolution becomes dependent on the object contrast
and background noise level. Instead, when reporting
T T F, the background noise, the object’s contrast, and
the object’s radial location are included. This is the
reason why d’ is more suitable when IR algorithms
are used. NPS is the Noise Power Spectrum that sum-
marizes the noise texture in the spatial frequency do-
main. E is a function that simulates the eye filter mod-
eling the human visual system sensitivity to different
spatial frequencies. The arrays should have the same
shape, typically representing frequency values along
the u and v dimensions.
Hence, the detectability index, depending on spa-
tial resolution, contrast and noise, in turn, depends
on the dose, tube potential, tube current modulation
setting, phantom size, task size, task contrast, image
thickness, reconstruction algorithm, and reconstruc-
tion kernel. It is therefore evident that this metric al-
lows us to evaluate the joint effect of all the factors
that can impact image quality.
To compute the detectability index on our phan-
tom CT images with a semi-automatic procedure,
we used the imQuest open-source software (Duke
University, Durham, NC, USA) (Solomon, 2018).
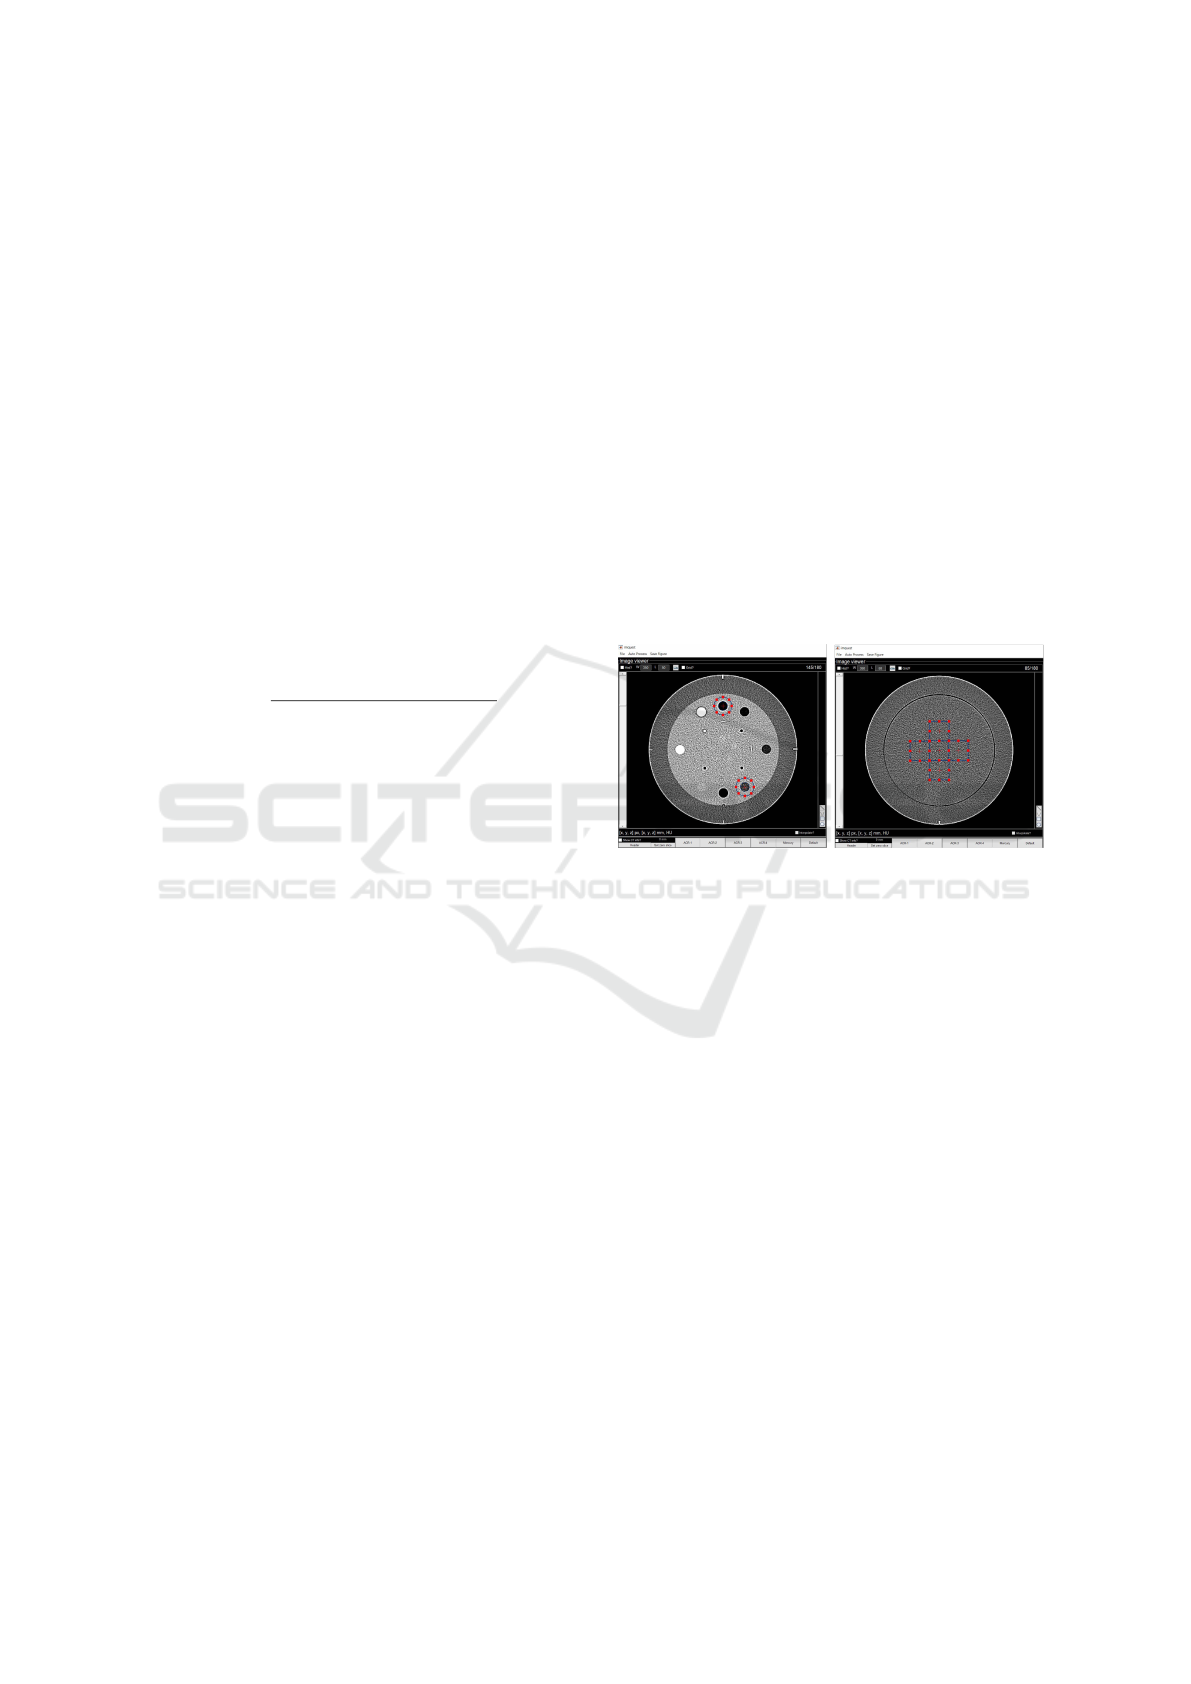
Once each CT scan is uploaded, the imQuest soft-
ware requires the first step of T T F computation (Fig-
ure 2). An insert has to be chosen as a reference
and we placed a circular ROI with a radius about
twice that of the chosen insert (∼ 60 pixels) on it.
In this manuscript, we will show the results related
to polystyrene (with a nominal object-to-background
contrast (|∆HU|≈100) adequate for low-contrast di-
agnostic tasks) and air inserts. However, we repeated
the d’ computation by also considering all the other
inserts. The second step is the NPS computation. Five
64x64 pixels ROIs in the CTP486 homogenous mod-
ule (Figure 2) have been drawn. The 2D −NPS is then
computed as the area-normalized Fourier transform of
the ROI.
Figure 2: Manually ROI placement for TTF (on the left)
and NPS (on the right) computation on imQuest.
Then, the W parameters have to be set in imQuest.
We wanted to simulate a 5-mm diameter lesion with
the contrast automatically taken from the insert con-
sidered for the TTF computation. Therefore the pa-
rameters set in imQuest were: designer contrast pro-
file, signal diameter of 5 mm, profile exponent of 1.
For the eye filter E, we used the NPWE model ob-
server obtained with the non-prewhitening matched
filter by adding the eye filter correction (Burgess,
1994), selecting the radial noise generation mode and
the Saunders visual response function. To repro-
duce the working scenario of radiologists, we also set
the following interpretation conditions: display pixel
pitch of 0.2 mm, zoom factor of 1.74, viewing dis-
tance of 500 mm, and a field of view of 380 mm. Once
all these steps are performed, the software automati-
cally outputs the detectability index value, by using
the equation (1).
Characterization and Quantification of Image Quality in CT Imaging Systems: A Phantom Study
291

Table 1: Acquisition and reconstruction parameters used for the two scanners. The CTDI
vol
is the weighted average measure-
ment of the dose in a reference phantom, expressed in mGy.
REVOLUTION GE AQUILON TOSHIBA
CTDI
vol
[mGy] (Tube current [mA])
High 13.52 (160) 16.50 (300)
Standard 6.76 (80) 8.30 (150)
Reduced 4.06 (50) 5.00 (90)
Low 2.03 (25) 2.49 (45)
DATA ACQUISITION
Tube potential (kVp) 120 120
Pitch 0.984 0.938
IMAGE RECONSTRUCTION
Display field of view (mm) 210 219
Pixel Spacing (mm) 0.406 0.427
Slice thickness (mm) 1.25 1.00
Kernel LUNG FC56
Reconstruction algorithm FBP, ASIR FBP, AIDR 3D
Iterative level 0%, 10%, 40%, 70% 0%, mild, standard, strong
3.2 Characterization of CT Protocols in
Terms of Image Quality
In order to characterize the CT protocols in terms of
image quality, we first plotted the mean detectabil-
ity index value, computed on the three identical ac-
quisitions, as a function of the CTDI
vol
, highlighting
the different combinations of the changed parameters
(scanner, dose level, and IR blending level). Then we
also visualized how the d’, i.e., image quality varies
with the CTDI
vol
alone and, by means of a color map,
how it varies simultaneously with the CTDI
vol
and the
IR level, for each scanner separately.
3.3 Image Quality with and Without the
Eye Filter
To make the d’computation more automatic and have
full control over each step, we have also developed a
Python script that takes as input the CT image, the co-
ordinate of the center and the radius of the ROIs for
the TTF computation and automatically returns the
detectability index value, besides the 2D TTF and the
2D NPS. The Python code will be made available af-
ter the study is completed. Since there is no available
documentation on the mathematical form of the eye
filters available in imQuest, we adopted the following
definition (Solomon et al., 2015):
E(ρ) = |ηρ
1.5
· e
−0.98·ρ
0.68
|
2
(2)
We computed the d’ values for the images ac-
quired on the phantom also with this automated pro-
gram, obtaining the d
′
NPWE
with the previous equation
(1), but considering this definition of the eye filter.
However, it is also possible to define the de-
tectability index without the addition of the eye filter,
with the definition 3. In this case, we quantify a sort
of ”objective” image quality not related to the human
vision perception.
d
′
NPW
2
=
h
R R
|
W
|
2
T T F
2
dudv
i
2
R R
|
W
|
2
T T F
2
NPS
2
dudv
(3)
We leveraged the automated code to re-compute
this detectability index without adding the eye filter.
We finally compared the dependence of d’ on
the acquisition/reconstruction parameters in the two
cases, when image quality comprises how the image
appears to the human visual system and when it is not
based on visual perception.
4 RESULTS
In Figure 3, the plots of the mean detectability in-
dex value, computed on the three identical acquisi-
tions, referred to both the polystyrene and air inserts,
as a function of the CTDI
vol
are shown. Howevere,
the three parameters that we changed in the acquisi-
tion/reconstruction phase, scanner, CTDI
vol
and iter-
ative blending level, were highlighted for each point.
As evident from the plots, the range assumed by
the d’ value varies. This was expected given the dif-
ferent contrast of the two inserts. It is also possible to
identify in the plots different protocols, i.e., different
combinations of scanner-dose-iterative level param-
eters that produce a similar value of the detectabil-
BIOIMAGING 2024 - 11th International Conference on Bioimaging
292
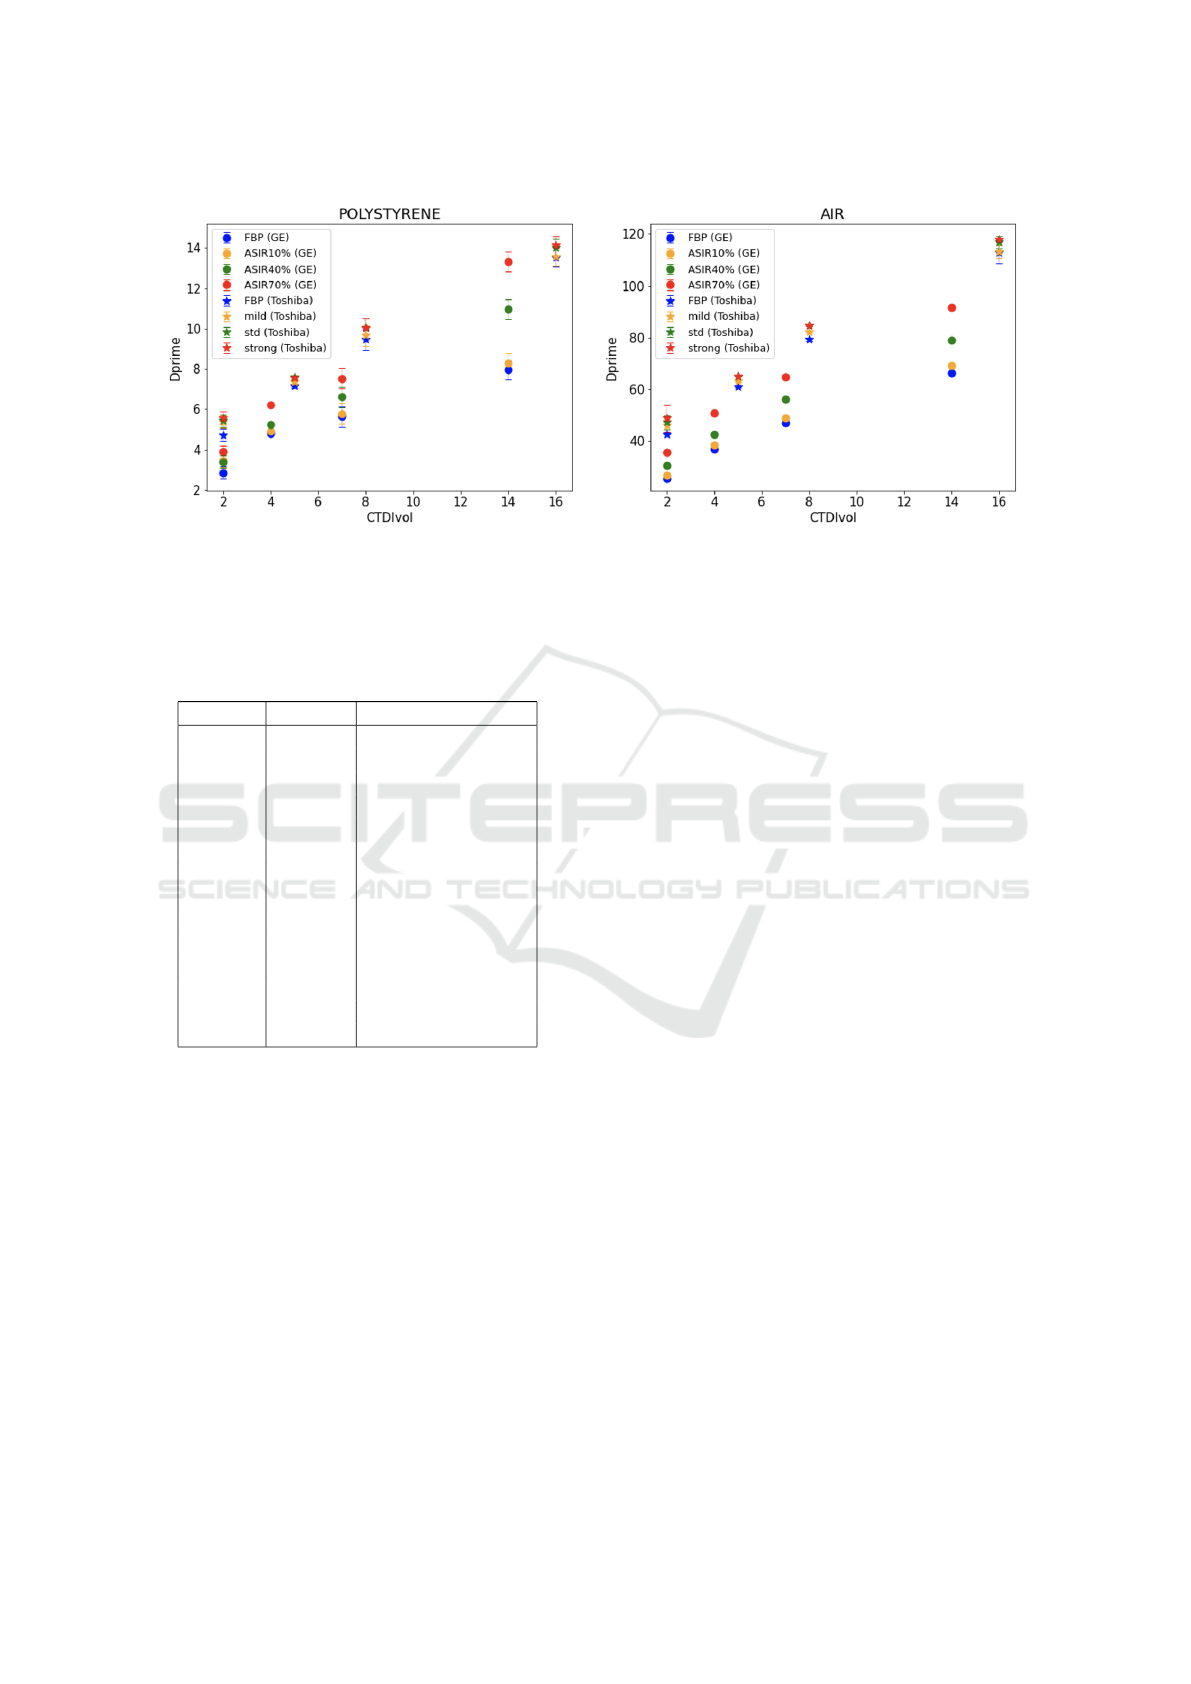
Figure 3: Plots of the mean detectability index as a function of the CTDI
vol
for both the polystyrene and air inserts. The
circles are used for the GE scanner and the stars for the Toshiba scanner. In the legend, the colors are corresponding to the
iterative levels for the two scanners.
Table 2: Set of acquisition/reconstruction parameters corre-
sponding to the protocols providing a similar detectability
index. STD:STANDARD.
Scanner CTDI
vol
Iterative level
GE 4 ASIR 70%
GE 7 ASIR 0%
GE 7 ASIR 10%
GE 7 ASIR 40%
GE 7 ASIR 70%
GE 14 ASIR 0%
GE 14 ASIR 10%
Toshiba 2 AIDR3D MILD
Toshiba 2 AIDR3D STD
Toshiba 2 AIDR3D STRONG
Toshiba 5 FBP
Toshiba 5 AIDR3D MILD
Toshiba 5 AIDR3D STD
Toshiba 5 AIDR3D STRONG
ity index, meaning that they produce a similar image
quality. This was equally observed for the d’ from the
other five inserts in the CTP401 module of the phan-
tom. Hence this observation is not restricted to a spe-
cific insert or material, but having a similar trend, it
is generalizable to all inserts under examination. It
is interesting to observe that these ”equivalent” proto-
cols reported in Table 2 are heterogeneous in terms of
scanner, CTDI
vol
and iterative levels.
We visually inspected the images obtained with
protocols that produce a similar d’ and we compared
them to images obtained with protocols that produce
a very different d’, always extrapolated from the plots
in Figure 3. It was observed that a similarity in image
appearance can be perceived for the protocols cor-
responding to a similar detectability index. Instead,
when we inspect images obtained with protocols pro-
ducing a different d’, they present a quite different
appearance, especially in terms of noise. Therefore,
the detectability index could be a reasonable index to
”quantify” image quality.
As for the plot of d’ as a function of the dose alone
and the colormaps of d’ as a function of both dose and
iterative level, they are represented for the polystyrene
insert in Figure 4, for both GE and Toshiba scanners.
In Figure 5, the same plot of Figure 3 for the
polystyrene insert is represented, with the difference
that the d’ value has been obtained with the automated
program, and thus by using the eye filter defined in
(2). Therefore, the trend is the same but the range of
values assumed by d’ is different (also because the le-
sion diameter simulated for the task function W was
set to 12 mm in the script and is different from the
one of 5 mm set on imQuest). It can be compared to
the plot obtained for the detectability index as defined
by equation (3), namely without considering the eye
filter, shown in Figure 6.
From these two graphs, it can be observed that in
both cases, the dependence of d’ on the protocol is
similar. Also, in these cases, some protocols that pro-
duce a similar detectability index and thus a similar
image quality can be identified. However, when we
do not consider the eye filter it is evident that by in-
creasing the iterative level, there is not an evident im-
provement in image quality as in the case in which
we consider the eye filter. This is particularly true for
the ASIR algorithm in the GE scanner. It seems that
when we do not evaluate the quality based on visual
perception, the image quality at lower doses contin-
ues to improve as ASIR increases. Still, it appears to
worsen at higher doses.
Characterization and Quantification of Image Quality in CT Imaging Systems: A Phantom Study
293
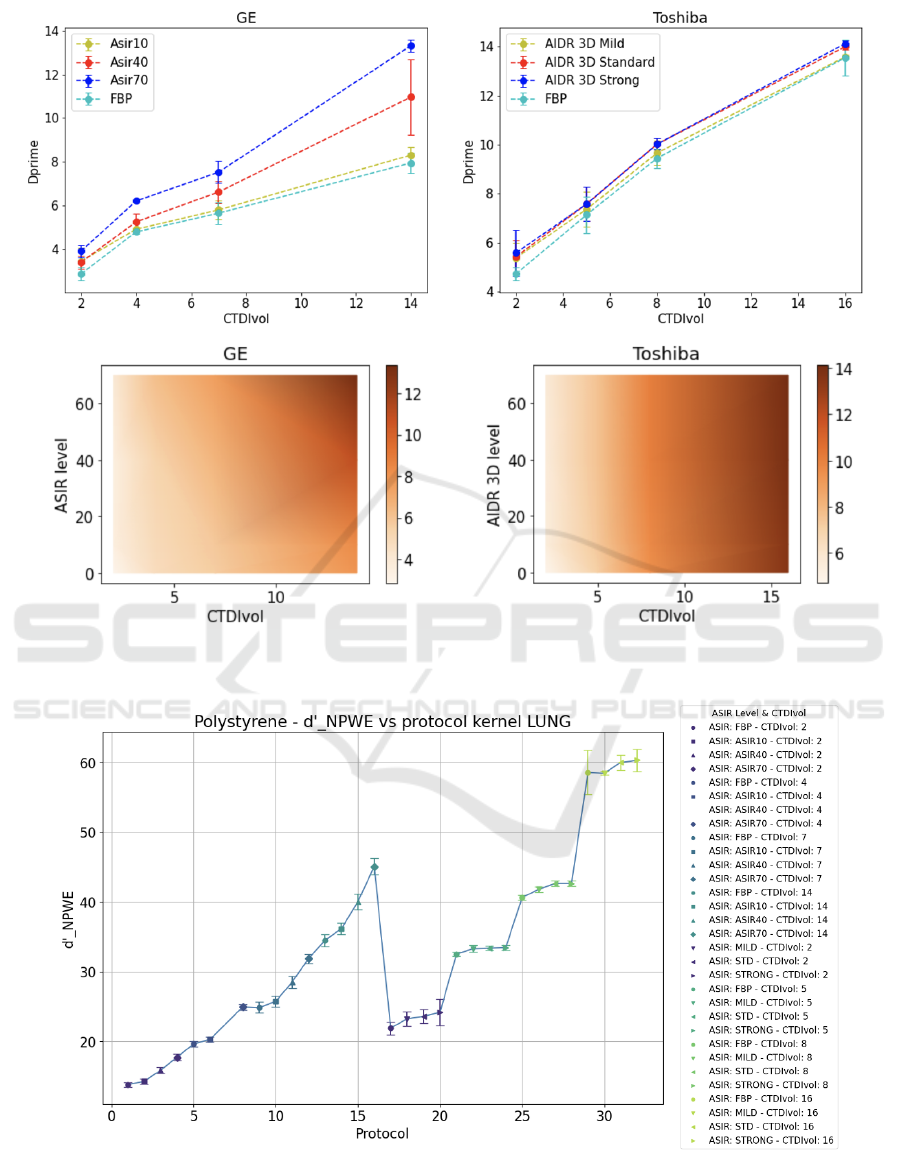
Figure 4: Upper row: Mean detectability index of polystyrene insert as a function of the dose level. Lower row: color maps
of the mean detectability index of polystyrene insert as a function of both dose level and iterative level. The color intensity
corresponds to the d’ value.
Figure 5: Plot of the mean detectability index as a function of the protocol for polystyrene. d’ values are output from the
Python script by using the definition in 1 and the expression 2 for the eye filter.
BIOIMAGING 2024 - 11th International Conference on Bioimaging
294
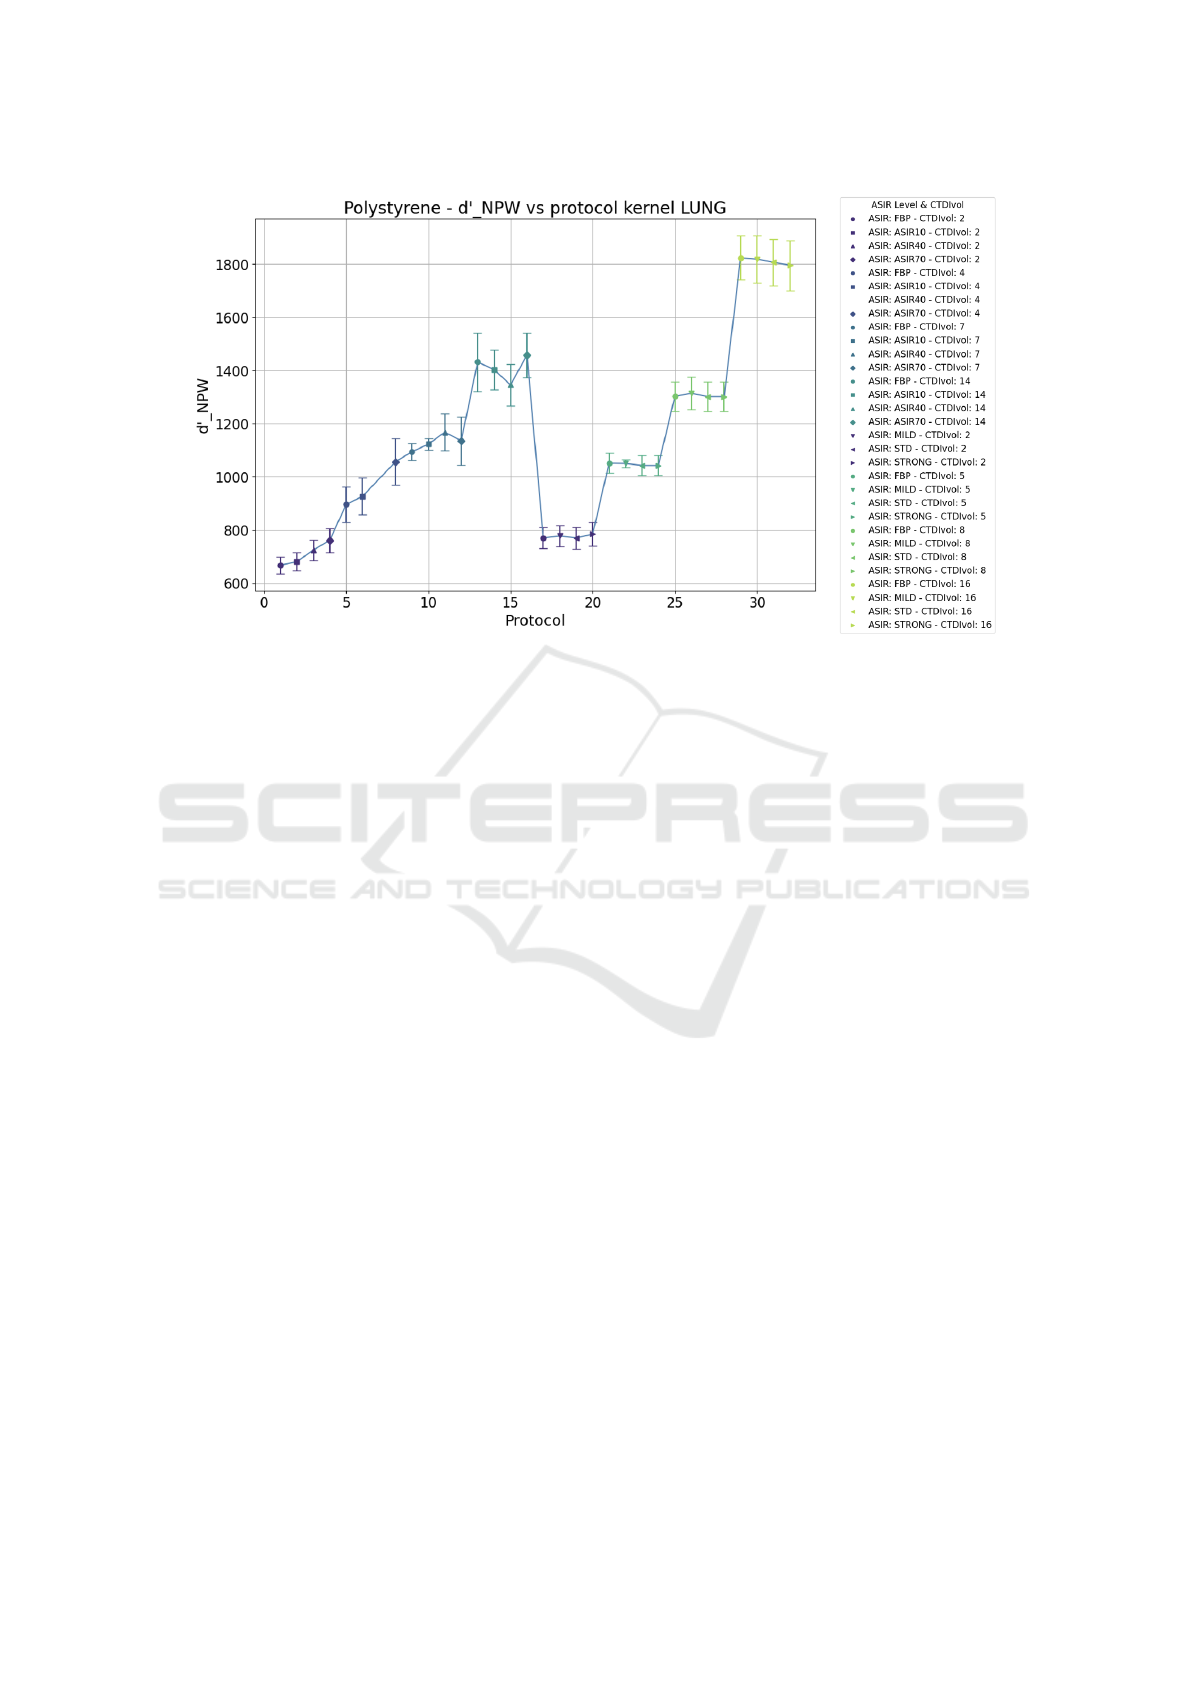
Figure 6: Plot of the mean detectability index as a function of the protocol for polystyrene. d’ values are output from the
Python script by using the definition in 3 without the eye filter.
5 DISCUSSION
In this study, we characterized two CT scanners in
terms of image quality, which was quantified by
means of a new metric, the detectability index, more
suitable for images with iterative algorithm recon-
struction. We found that it is possible to identify
“equivalent” protocols, meaning protocols that pro-
duce a similar d’, i.e., a similar image quality. From
these “equivalent” protocols, it would be possible
to extrapolate those that correspond to a lower dose
level. In other words, it is possible to find the opti-
mal protocol to reduce the radiation dose delivered in
CT acquisitions without degrading the imaging prop-
erties. These results confirm the ones obtained in an-
other similar study (Muti et al., 2023).
The conclusions of our study also pave the way
for new perspectives in radiomics study. We have
indeed started to analyze if these “equivalent” proto-
cols can be leveraged to obtain more robust extracted
radiomics features, in order to define a new possi-
ble harmonization strategy based on matching image
quality. The analysis on using or not the eye filter
while evaluating image quality poses another impor-
tant question. In fact, the obtained results demonstrate
that a further exploration of the iterative algorithms
effect is needed. We hypothesized that the worsen-
ing of image quality at higher iterative levels while
maintaining the dose constant could be related to the
blurring that ASIR causes in the image. However, this
should be further investigated. The interesting note
is that increasing the iterative level of some iterative
algorithms like ASIR can improve the image quality
as it is perceived by human eyes. Still, it can deter-
mine a worsening when we consider a more ’objec-
tive’ quality not related to the human visual system.
This should be further investigated when the images
have to be finally provided to an AI algorithm, which
is naturally not equipped with a visual filter.
A possible limitation to the analysis presented in
this paper is that d’ is a task-based image quality met-
ric, therefore it depends on the specific task function
chosen to represent a task in clinical practice. We sim-
ulated a 5-mm diameter lesion with a specific contrast
but this is not the only one that could be considered.
Moreover, this study is preliminary as in order
to claim the consistency of our results the analysis
should be extended to other clinical centers and scan-
ners, possibly equipped with different types of iter-
ative algorithms, and exploring other protocols and
a wider range of parameters. Therefore, the future
perspectives are in parallel refining the analysis by
introducing more variables and investigating a pos-
sible harmonization strategy based on this character-
ization of image quality to improve the robustness of
radiomics studies.
Characterization and Quantification of Image Quality in CT Imaging Systems: A Phantom Study
295

ACKNOWLEDGEMENTS
This research has been developed as part of a
Ph.D. program in collaboration with the Univer-
sity of Pisa and the National Institute for Nu-
clear Physics (INFN). Research partly supported
by: Artificial Intelligence in Medicine (next AIM,
https://www.pi.infn.it/aim) project, funded by INFN-
CSN5; FAIR-AIM project funded by Tuscany Gov-
ernment (POR FSE 2014-2020); PNRR - M4C2 -
Partenariato Esteso ”FAIR - Future Artificial Intel-
ligence Research” - Spoke 8, and PNRR - M4C2
- Centro Nazionale ”ICSC – Centro Nazionale di
Ricerca in High Performance Computing, Big Data
and Quantum Computing” - Spoke 8, funded by
the European Commission under the NextGeneration
EU programme; the Italian Ministry of Health Grant
RC and 5×1000 Health Research; AIMS2-Trials,
http://aims-2-trials.eu; the European Union NextGen-
erationEU through the Italian Ministry of University
and Research under PNRR M4C2-I1.3 Project PE
00000019 ”HEAL ITALIA” to Maria Evelina Fan-
tacci and Arman Zafaranchi CUP I53C22001440006.
The views and opinions expressed are those of the au-
thors only and do not necessarily reflect those of the
European Union or the European Commission Nei-
ther the European Union nor the European Commis-
sion can be held responsible for them.
REFERENCES
Barca, P., Giannelli, M., Fantacci, M. E., and Caramella,
D. (2018a). Computed tomography imaging with the
adaptive statistical iterative reconstruction (asir) algo-
rithm: dependence of image quality on the blending
level of reconstruction. Australasian physical & engi-
neering sciences in medicine, 41:463–473.
Barca, P., Palmas, F., Fantacci, M. E., and Caramella, D.
(2018b). Evaluation of the adaptive statistical iter-
ative reconstruction algorithm in chest ct (computed
tomography).
Beister, M., Kolditz, D., and Kalender, W. A. (2012). It-
erative reconstruction methods in x-ray ct. Physica
medica, 28(2):94–108.
Burgess, A. (1994). Statistically defined backgrounds:
performance of a modified nonprewhitening observer
model. JOSA A, 11(4):1237–1242.
Cao, C.-F., Ma, K.-L., Shan, H., Liu, T.-F., Zhao, S.-Q.,
Wan, Y., and Wang, H.-Q. (2022). Ct scans and cancer
risks: A systematic review and dose-response meta-
analysis. BMC cancer, 22(1):1238.
Caramella, D., Fantacci, M. E., Palmas, F., Barca, P., et al.
(2018). Evaluation of the adaptive statistical itera-
tive reconstruction algorithm in chest ct (computed
tomography)-a preliminary study toward its employ-
ment in low dose applications, also in conjunction
with cad (computer aided detection). In Proceedings
of the 11th International Joint Conference on Biomed-
ical Engineering Systems and Technologies-Volume 5:
AI4Health, volume 5, pages 688–694.
Dodge, C. T., Tamm, E. P., Cody, D. D., Liu, X., Jensen,
C. T., Wei, W., Kundra, V., and Rong, X. J. (2016).
Performance evaluation of iterative reconstruction al-
gorithms for achieving ct radiation dose reduction—a
phantom study. Journal of applied clinical medical
physics, 17(2):511–531.
Forte, G. C., Altmayer, S., Silva, R. F., Stefani, M. T., Liber-
mann, L. L., Cavion, C. C., Youssef, A., Forghani, R.,
King, J., Mohamed, T.-L., et al. (2022). Deep learning
algorithms for diagnosis of lung cancer: a systematic
review and meta-analysis. Cancers, 14(16):3856.
Kennedy, K., Hulbert, A., Pasquinelli, M., and Feldman,
L. E. (2022). Impact of ct screening in lung cancer:
Scientific evidence and literature review. In Seminars
in Oncology. Elsevier.
Mail, T. B. (2013). Catphan® 500 and 600 m anual. The
Phantom Laboratory.
Manickavasagam, R., Selvan, S., and Selvan, M. (2022).
Cad system for lung nodule detection using deep
learning with cnn. Medical & Biological Engineering
& Computing, 60(1):221–228.
Muti, G., Riga, S., Berta, L., Curto, D., De Mattia, C.,
Felisi, M., Rizzetto, F., Torresin, A., Vanzulli, A.,
and Colombo, P. E. (2023). Performance of three
model-based iterative reconstruction algorithms using
a ct task-based image quality metric. arXiv preprint
arXiv:2301.08691.
Raju, S., Ghosh, S., and Mehta, A. C. (2017). Chest ct
signs in pulmonary disease: a pictorial review. Chest,
151(6):1356–1374.
Samei, E., Bakalyar, D., Boedeker, K. L., Brady, S., Fan, J.,
Leng, S., Myers, K. J., Popescu, L. M., Ramirez Gi-
raldo, J. C., Ranallo, F., et al. (2019). Performance
evaluation of computed tomography systems: sum-
mary of aapm task group 233. Medical physics,
46(11):e735–e756.
Smith-Bindman, R., Wang, Y., Chu, P., Chung, R., Einstein,
A. J., Balcombe, J., Cocker, M., Das, M., Delman,
B. N., Flynn, M., et al. (2019). International variation
in radiation dose for computed tomography examina-
tions: prospective cohort study. Bmj, 364.
Solomon, J., Wilson, J., and Samei, E. (2015). Character-
istic image quality of a third generation dual-source
mdct scanner: noise, resolution, and detectability.
Medical physics, 42(8):4941–4953.
Solomon, J. B. (2018). Performance evaluation of com-
puted tomography systems. resources: Aapm tg-233.
Vennart, W. (1997). Icru report 54: Medical imaging-the as-
sessment of image quality-isbn 0-913394-53-x. april
1996, maryland, usa. Radiography, 3(3):243–244.
Yeh, D.-M., Tsai, H.-Y., Tyan, Y.-S., Chang, Y.-C., Pan, L.-
K., and Chen, T.-R. (2016). The population effective
dose of medical computed tomography examinations
in taiwan for 2013. PLoS One, 11(10):e0165526.
BIOIMAGING 2024 - 11th International Conference on Bioimaging
296
