
Real-Time 3D Information Visualization on Mobile Devices: Efficient
Occlusion Detection for Geospatial Applications
Agata Migalska
a
Department of Control Systems and Mechatronics, Wrocław University of Science and Technology, Wrocław, Poland
Keywords:
Augmented Reality, Geospatial Data Visualization, Occlusion Detection.
Abstract:
The rapid advancement of geospatial applications on mobile devices has revolutionized outdoor activities
and professions by providing invaluable tools for navigating, exploring, and highlighting geographic features.
These applications often face notable challenges, including limited connectivity as well as battery and storage
constraints. The objective of this paper is to provide users with a seamless user experience and augmented
reality interactions in diverse outdoor scenarios within geospatial applications on mobile devices. Towards
this goal, we introduce visibility map of a point that contains distances from the point to the closest obstacles
at multiple angular viewpoints. We propose that every point of interest is associated with a such a visibility
map, pre-calculated on a digital world model, in order to render annotated data in real-time without relying
on time-consuming depth estimation. We specifically address the aspect of displaying 3D virtual information
that is registered at different elevations, justified by the importance of elevation information in domains such
as earth science, culture science or construction and by a lack of methods that would allow that. Through our
study, we demonstrate the real-time rendering capability and accuracy of our proposed method. We present
the findings, discuss potential limitations, and suggest future research directions.
1 INTRODUCTION
Geospatial applications on mobile devices have be-
come indispensable tools for outdoor activities and
professions, offering navigation assistance, explo-
ration capabilities, and the ability to highlight im-
portant geographic features. The integration of Aug-
mented Reality (AR) has further revolutionized the
user experience by enriching the perceived world with
additional information and expanding the user’s un-
derstanding of their surroundings (Bowman et al.,
2003; Billinghurst et al., 2015). Location-aware
AR applications enable the attachment of location-
specific virtual content to real-world scenes and allow
users to access and manage this information (H
¨
ollerer
et al., 1999).
In many existing geospatial applications a point
of interest is described by geographical latitude and
longitude and assumed to be located at the ground
level. As an example, let us consider AR tourism
applications that suggests walking routes passing by
local attractions and provide additional content to the
user once they arrive at a certain location (Pica et al.,
a
https://orcid.org/0000-0002-0653-026X
2018; Gonz
´
alez-Delgado et al., 2020). An attraction
is considered to be at the altitude of Earth at given lat-
itude and longitude. Indeed, in many use cases, such
as navigation and routing, an exact object’s placement
above the ground is of little concern.
What remains unrepresented, however, are the fol-
lowing:
• Points in three-dimensional space that do not cor-
respond to ground-level entities, such as a bird’s
nest or a wall socket.
• Paths that vary in altitude, such as climbing routes
or the course of water and sewage systems within
a wall.
• Areas situated above the terrain, such as geolog-
ical layers within a towering rock wall or haz-
ardous portions of a building’s elevation.
Clearly, certain geospatial entities exist above the
ground level and necessitate that full and precise el-
evation information is captured, persisted and pre-
sented visually.
In addition to outdoor sports enthusiasts, such as
rock climbers, numerous professions can benefit from
precise three-dimensional information rendering in
geospatial applications. Examples include highlight-
Migalska, A.
Real-Time 3D Information Visualization on Mobile Devices: Efficient Occlusion Detection for Geospatial Applications.
DOI: 10.5220/0012398300003660
In Proceedings of the 19th International Joint Conference on Computer Vision, Imaging and Computer Graphics Theory and Applications (VISIGRAPP 2024) - Volume 1: GRAPP, HUCAPP
and IVAPP, pages 277-284
ISBN: 978-989-758-679-8; ISSN: 2184-4321
Copyright © 2024 by Paper published under CC license (CC BY-NC-ND 4.0)
277

ing noteworthy parts of buildings and monuments
for further studies and for touristic purposes, mark-
ing boundaries discovered while working with digital
rock outcrop models (Tavani et al., 2019), identifying
loose rocks to ensure seamless functioning of a rock-
fall monitoring system (Cayla and Martin, 2018), or
annotating the course of water and electricity systems
within walls.
Geospatial applications operating in outdoor envi-
ronments often contend with challenges. Firstly, they
face limited internet connectivity, especially in rural
and mountain regions (Fedorov et al., 2016). Further-
more, they may be restricted on battery usage, given
the limited availability of power sources in outdoor
settings (Stylianidis et al., 2020). Finally, their opera-
tion may be opposed by limited storage capacity of a
mobile device (Shi et al., 2012).
It is therefore recommended that all calculations
and processing are performed offline on a mobile de-
vice, to ensure seamless operation regardless of the
network signal strength. Furthermore, these applica-
tions must be designed with low-power consumption
in mind to preserve battery life. Additionally, consid-
ering the constrained storage capacity of mobile de-
vices, it is crucial to minimize the volume of stored
data. Finally, for immaculate user experience the real-
time performance is necessary.
Our objective is thus to determine visibility of vir-
tual objects in a perceived real-world scene in order
to overlay these objects on top of a camera preview,
as showcased in Figure 1. The primary challenge to-
wards this goal is that the information about visibil-
ity and potential occlusions in the scene is not readily
available.
The authors of the comprehensive study of
research and development in the field of AR
(Billinghurst et al., 2015) point towards depth estima-
tion techniques to accurately compose virtual and real
world images. However, existing depth-estimation
solutions lack real-time performance. For instance,
in the Mobile AI 2022 Monocular Depth Estimation
challenge (Ignatov et al., 2023), the fastest run time
achieved by the AHA HIT Team was 37ms (27 FPS).
In applications that involve additional tasks such as
calculating node visibility or scene rendering, depth
estimation becomes time-consuming and cannot of-
fer seamless user experience. Moreover, depth maps
generated by existing algorithms often have low res-
olutions (e.g., 640x480px), presenting an additional
challenge.
We propose to leverage information on angular
visibility of annotated points in order to efficiently
render a visible subset of them on the user’s mobile
device’s screen. Each point is thus accompanied by a
vector of distances from that point to the closest ob-
stacles at specific viewing angles. At runtime, this
visibility information is combined with the camera’s
location and attitude to render only the content that is
visible in the camera preview.
We make a two-fold contribution.
• We propose a novel method for visibility calcula-
tion in complex scenes that strikes a balance be-
tween accuracy and resource efficiency, allowing
for real-time performance and seamless user ex-
perience.
• We provide a data representation framework for
annotating three-dimensional points, polylines,
and polygons, facilitating the incorporation of rich
spatial information into applications while mini-
mizing storage requirements.
2 RELATED WORK
The problems our research addresses have been ob-
served and scrutinized by other authors as well. (Shi
et al., 2012) propose that the calculations for render-
ing are executed on a remote server in order to ensure
real-time interactive 3D mobile graphics. However,
this method relies on a stable connection to a remote
server and is not well suited for outdoor scenarios.
(Jain et al., 2015) recommend that geometric repre-
sentations of environment are utilized to reduce the
search space to device’s neighborhood. Our work fol-
lows this principle in that we propose that geospatial
data are split into regional chunks.
One prominent application of outdoor AR that
utilizes information about local world geometry is
mountain peak detection, where the goal is to overlay
mountain landscapes with peak information. (Karpis-
chek et al., 2009) propose to use so-called view-sheds
of mountain peaks; a view-shed is a union of geospa-
tial areas from which a given peak is visible. To deter-
mine which peaks are visible from a camera location,
view-sheds for all mountains are consulted. (Fedorov
et al., 2016) propose that the virtual panorama vis-
ible form the viewpoint of a user is estimated from
an online Digital Elevation Model (DEM) and from
its correspondence to the actual image framed by the
camera. Once the correspondence is found, meta-data
from DEM (e.g. peak name, altitude, distance) are
projected onto the view. DEM data supports only a
single z-value for each a x,y location which renders
the approach unsuitable for elevation-variable data.
(Westhead et al., 2013) recognize the potential
of AR techniques in transforming complex three-
dimensional information into a user-friendly format
GRAPP 2024 - 19th International Conference on Computer Graphics Theory and Applications
278
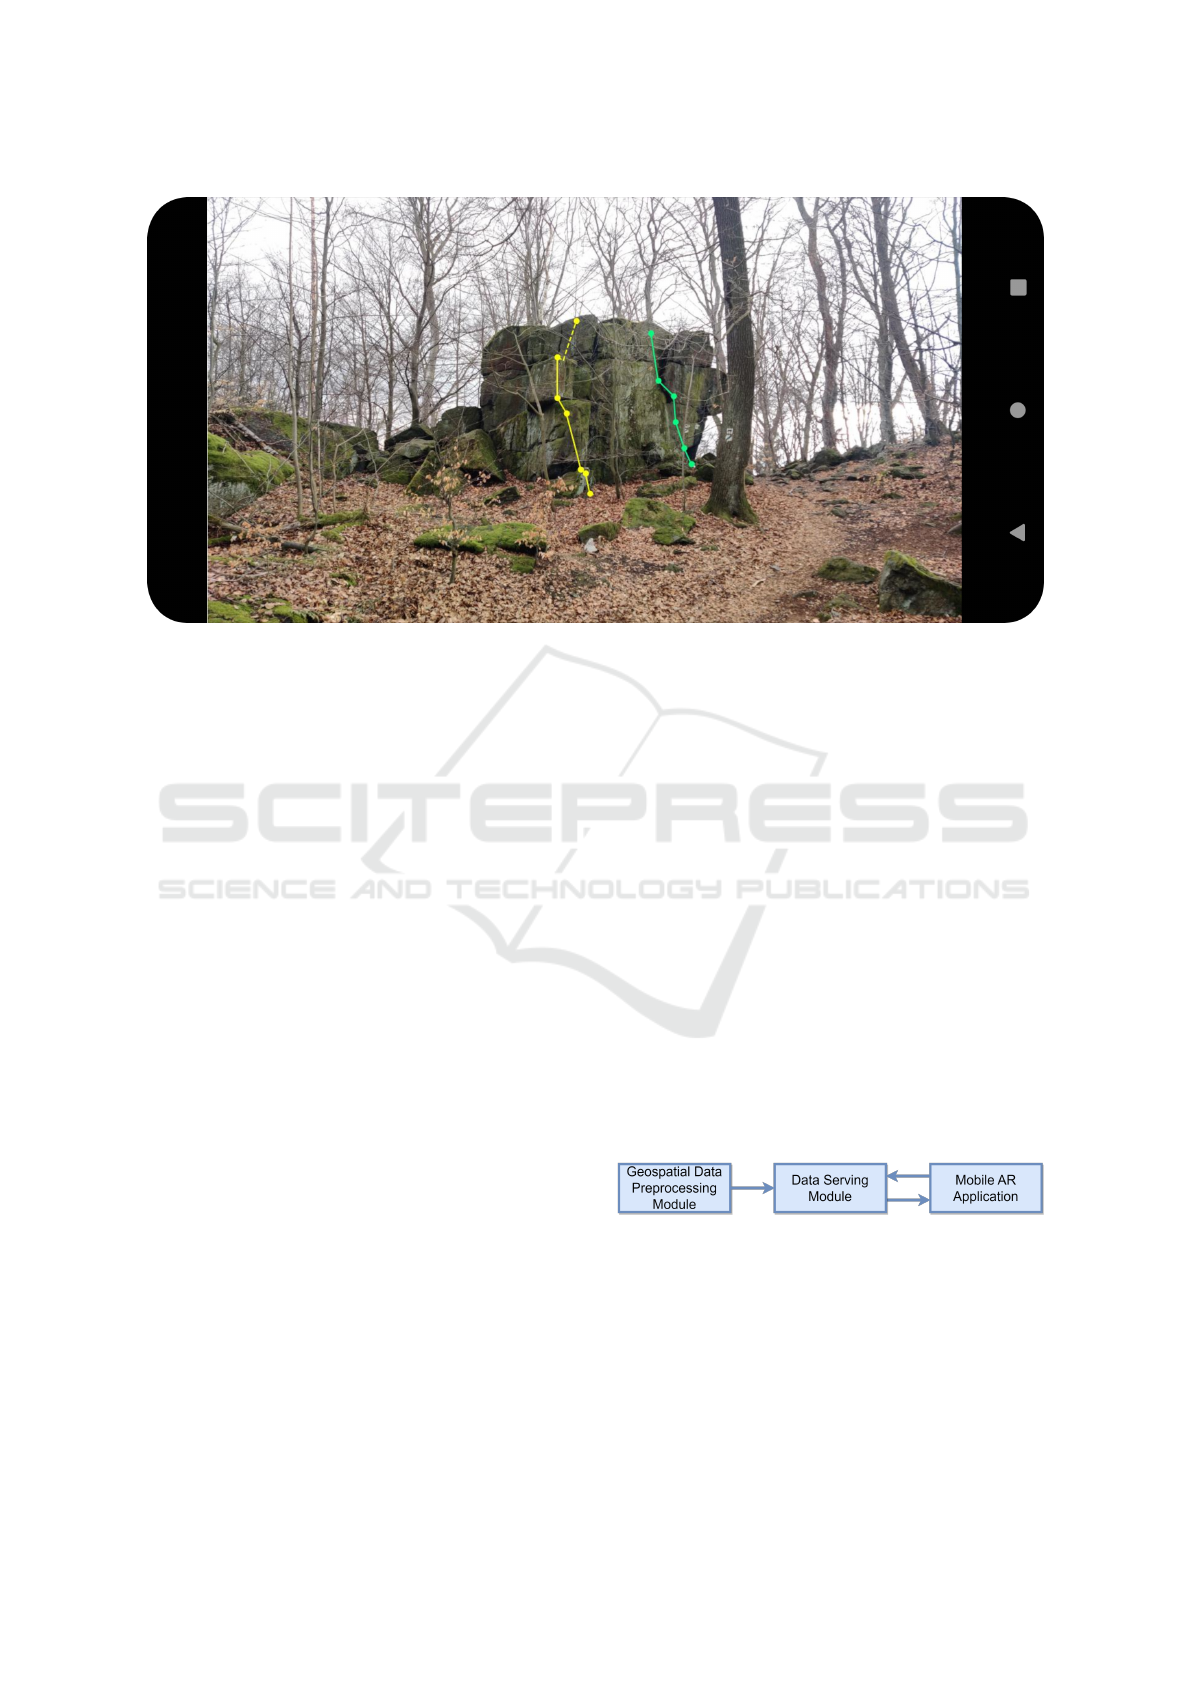
Figure 1: Real-time 3D Information Visualization on Mobile Devices: two polylines rendered as a camera preview overlay
with their full visibility indicated with solid lines and partial visibility with a dashed line.
and introduce the British Geological Survey BGS
Map Viewer, which provides a 3D view but is limited
to presenting 2D information on a 3D surface.
A different approach to information display is pre-
sented in tourism AR applications. The work of
(Gonz
´
alez-Delgado et al., 2020) focuses on the de-
velopment of georoutes to enhance tourism in natu-
ral filming locations in Spain. Users scan QR codes
along their route to access relevant information, in-
cluding textual, graphical, and interactive content.
Once again, the elevation information is culled.
Elevation information is not discarded in (Stylian-
idis et al., 2020), the research that presents LARA,
a solution for visualizing 3D underground infrastruc-
ture models in real time. The models are retrieved
from a 3D GIS-Geodatabase residing on a mobile de-
vice. Their work, alike ours, is concerned with 3D
real-time rendering of 3D models. However, consid-
ering that the main goal for LARA is to provide an
”X-ray” viewing of the underground infrastructure,
occlusion detection is of no relevance.
3 PROBLEM STATEMENT
Assumptions Regarding the World. The follow-
ing assumptions are made regarding the world: (1) A
mesh model representing the world is created in ad-
vance. (2) A domain expert annotates features of in-
terest in the world model in the form of points, poly-
lines and polygons. (3) The world is considered to be
static and undergoes minimal changes over time.
Objective. For each annotated point, the objective
is to determine whether it is visible to a camera, given
the position and orientation of the camera and the ge-
ometry of the surrounding world, in order to be prop-
erly overlaid on the mobile device’s camera preview.
Requirements for the Mobile Application. The
mobile application has the following requirements
arising from concerns raised in relation to mobile
AR for outdoor use: (1) It operates without requir-
ing an internet connection during runtime. (2) The
data needed for the algorithm execution is of small
volume. (3) The algorithm implemented in the appli-
cation is resource-efficient to minimize battery usage.
(4) The algorithm performs in real-time.
4 PROPOSED METHOD
Figure 2: System diagram.
The proposed solution consists of three modules:
(1) a geospatial data pre-processing module that is
responsible for the creation of visibility maps, (2)
a data serving module that serves spatially-cropped
files with annotations as well as their corresponding
visibility maps, and (3) a Mobile AR application that
performs visibility testing and overlays the camera’s
Real-Time 3D Information Visualization on Mobile Devices: Efficient Occlusion Detection for Geospatial Applications
279
preview with rendered visible annotated points. The
proposed system is presented in Figure 2.
4.1 Geospatial Data Pre-Processing
Module
We propose to calculate visibility of each annotated
point from the world model, that is a 3D mesh model
that can be constructed from LIDAR scans, UAV pho-
tographs or hand-held camera photographs (Tavani
et al., 2019). A domain expert, for instance a geol-
ogist or an archaeologist, introduces virtual informa-
tion to the world model by annotating points, poly-
lines, and polygons in a 3D coordinate system. In or-
der to determine the visibility of an annotated point,
we introduce the concept of a point visibility map and
propose associating each annotated point with such
a map. Point visibility map is a vector of Euclidean
distances from a point to the closest world object in
each of selected angular directions. To construct a vis-
ibility map, we employ a spherical coordinate system
and assume a unit sphere. Each point on the sphere
can be represented by two parameters: a polar angle
θ (0 ⩽ θ ⩽ π) that measures the angle from the posi-
tive z-axis towards the xy-plane, and an azimuthal an-
gle φ (0 ⩽ φ ⩽ 2π) that represents the angle from the
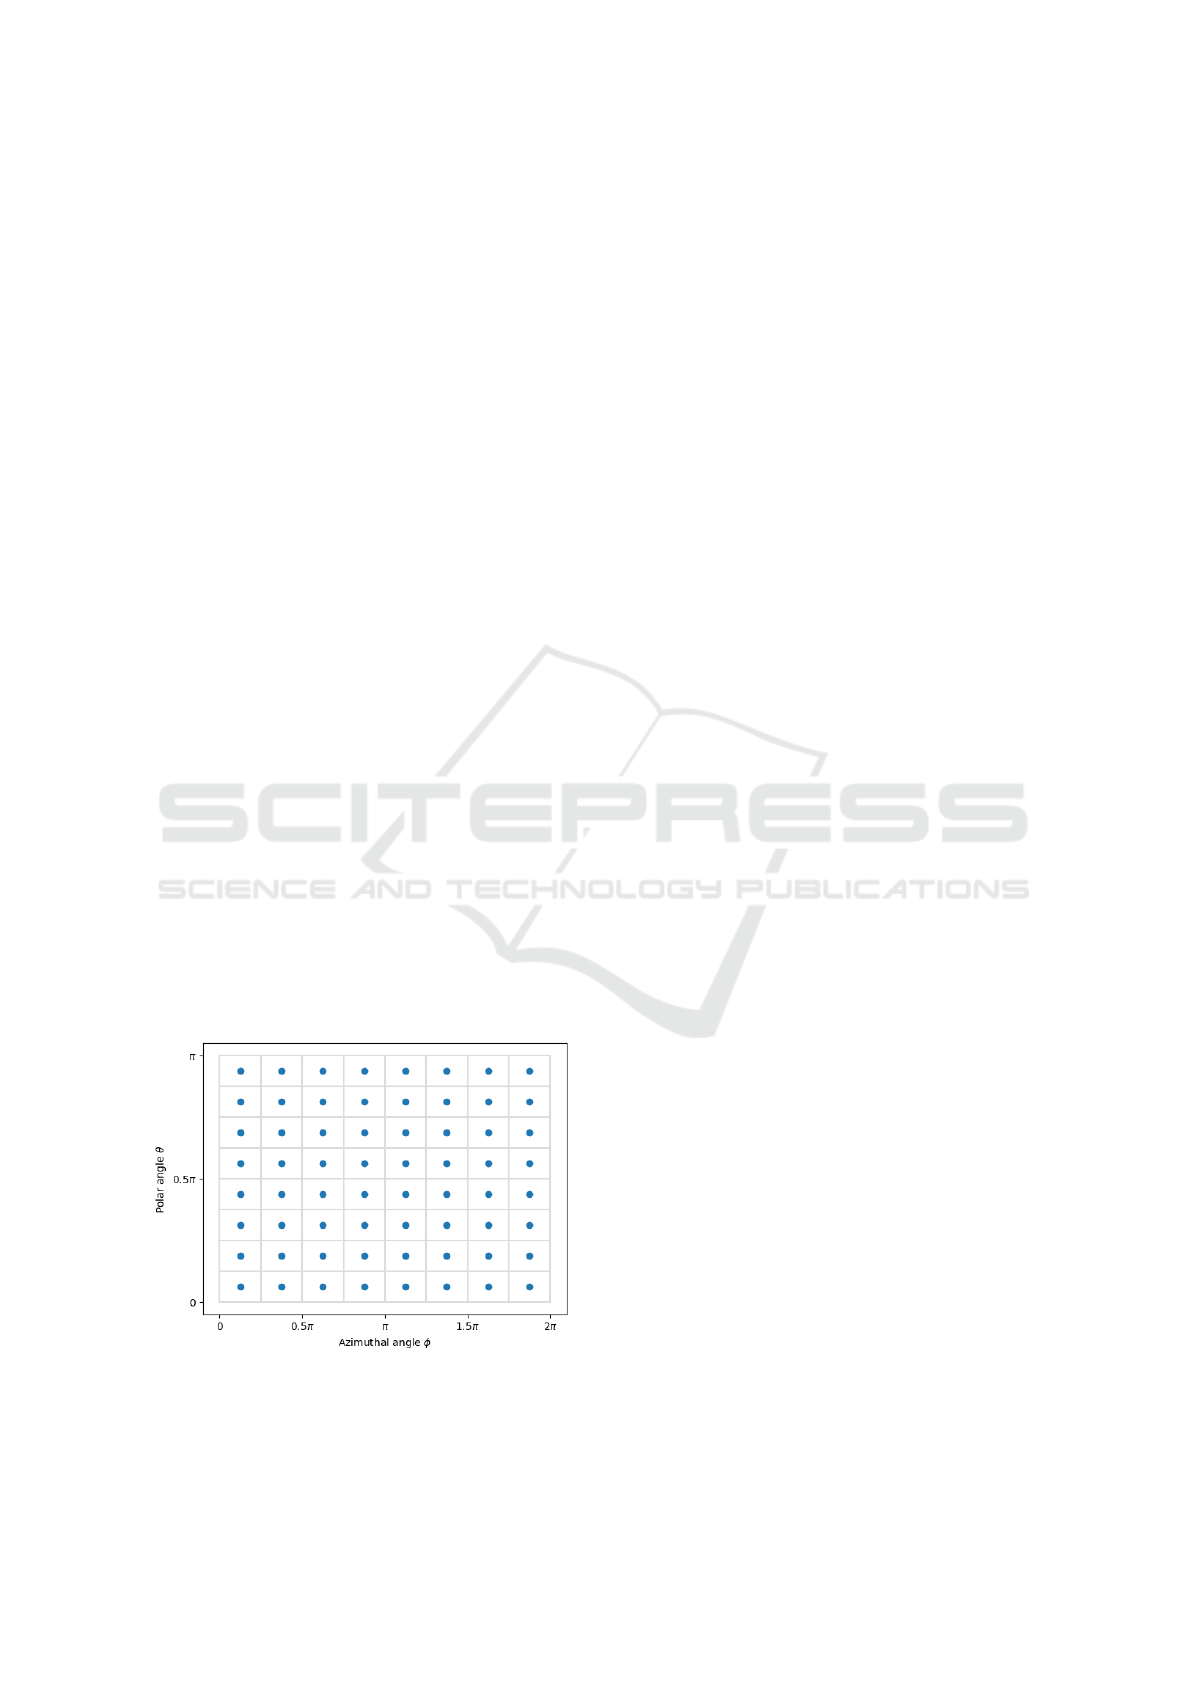
positive x-axis towards the positive y-axis. We pro-
pose to employ equal-angle sphere sampling scheme
for its computational advantages but, in principle, any
deterministic sampling scheme can be utilized. In the
equal-angle sampling scheme, the ranges of both po-
lar and azimuthal angles are divided into N intervals
of equal width. We are then able to approximate the
sphere with N × N quadrilateral faces in 3D. An illus-
tration of a sphere approximation in spherical coordi-
nates for N = 8 is presented in Figure 3.
Figure 3: Unit sphere approximation with 8 × 8 rectangular
cells of equally spaced azimuthal and polar angles. Blue
dots, in the middle of each cell, represent their centers.
A ray is emitted from the center of a sphere, i.e. an
annotated point, in the direction of the center of a cell
and continues until it encounters the nearest obstacle
in the world model. The distance traveled by the ray
is recorded in the visibility map under the index corre-
sponding to the ray’s azimuthal and polar angles. The
procedure is repeated for all considered directions and
yields a visibility map of a point in the world model.
4.2 Data Serving Module
The remote server module is responsible for serving
region-specific files containing annotated geometries
with their 3D world coordinates as well as visibility
maps for each point in annotated geometries.
In outdoor scenarios, the geometry of a scene can
be very complex; consider, for instance, rock out-
crops or a Romanesque stone bas relief on the portal
of a cathedral. Annotated geometries, such as points,
polylines, and polygons, are relatively small in size
compared to such complex geometry of a scene. Fol-
lowing the approach of existing map applications de-
signed for offline use (e.g. Mapy.cz (http://mapy.cz)
or MapsWithMe (http://maps.me)), it is assumed that
data for a particular region is downloaded and stored
on a mobile device in advance, allowing for offline
processing. The data transferred to a mobile device
includes only annotated geometries and calculated
visibility maps for each point.
4.3 Mobile AR Application
The following are the steps to determine the visibility
of a given point on a mobile device. It is assumed that
the camera is calibrated in an off-line process and that
the camera’s intrinsic matrix K is known.
1. Establish the camera’s location in the coordinate
system of the world model.
2. Prune the search space based on the camera’s lo-
cation and perform a frustum culling test (outside
of the proposed method).
3. Obtain the camera’s extrinsic matrix M, given by
M =
R
(3×3)
T
(3×1)
0
(1×3)
1
(1×1)
(4×4)
, (1)
where R is the camera rotation matrix and T is the
translation column vector.
4. For each point within the user’s frustum, perform
the visibility test described in Section 4.3.1.
5. If the point is visible, calculate the coordinates
(u,v) of the point in the Pixel Coordinate System
GRAPP 2024 - 19th International Conference on Computer Graphics Theory and Applications
280

using the equation:
z
c
u
v
1
= KM
x
w
y
w
z
w
1
, (2)
where z
c
represents the z-coordinate of the camera
relative to the world origin, and draw the point.
6. For each pair of points in a polyline, draw the edge
if both points are visible. If only one of the points
is visible, indicate it with appropriate marking.
The procedure can be performed for all points si-
multaneously using matrix operations.
4.3.1 Point’s Visibility Test
We first introduce a general approach applicable to
any sphere sampling scheme. We then refine the ap-
proach to equal-angle sampling scheme.
Let P be a point for which we want to determine
visibility, and let Q be a camera’s position. Firstly,
compute the vector
⃗
R from point P to camera Q and
its norm d = ∥
⃗
R∥. Then, find the index of the vector
that is closest to
⃗
R with respect to polar and azimuthal
angles. For an arbitrary sampling scheme, the clos-
est vector is the one that maximizes cosine similarity
between
⃗
R and itself,
S
C
(
⃗
D,
⃗
R) =
⃗
D ·
⃗
R
∥
⃗
D∥∥
⃗
R∥
. (3)
Since ∥
⃗
D∥ = 1 for all vectors in the scheme, it is
enough to find the vector that maximizes the dot prod-
uct between itself and
⃗
R. Once the closest vector is
found and its corresponding visibility retrieved from
the visibility map, the point is announced visible if
the interpolated value is no less than the distance d.
Otherwise, it is not visible to the camera. The steps
are outlined in Algorithm 1.
Data: Point P in 3D coordinates
Camera position Q in 3D coordinates
Visibility map V ∈ R
(N×N,1)
Visibility vectors D ∈ R
3
(N×N,3)
Result: true if Q visible from P, false
otherwise
1
⃗
R ← Q − P;
2 d ← ∥
⃗
R∥;
3 j ← arg max
i∈1,...,|
⃗
D|
⃗
D[i] ·
⃗
R;
4 return V [ j] ⩾ d;
Algorithm 1: Point Visibility Test.
Provided that equal-angle sphere sampling
scheme is selected, polar and azimuthal angles are
spaced by θ
∆
=
2π
N
and φ
∆
=
π
N
, respectively. That
allows for constant-time calculations of the vector
closest to
⃗
R. Step-by-step calculations of the pro-
posed Point’s Visibility Test for equal-angle sphere
sampling scheme are showcased in Algorithm 2.
Data: Point P in 3D coordinates
Camera position Q in 3D coordinates
Visibility map V ∈ R
(N×N,1)
φ
∆
= π/N - spacing of Φ
θ
∆
= 2π/N - spacing of Θ
Result: true if Q visible from P, false
otherwise
1
⃗
R ← Q − P;
2 d ← ∥
⃗
R∥;
3 φ
R
← atan2
⃗
R
y
,
⃗
R
x
;
4 θ
R
← arccos
⃗
R
z
/d
;
5 i
φ
← ⌊φ
R
/φ
∆
⌋;
6 j
θ
← ⌊θ
R
/θ
∆
⌋;
7 return V [i
φ
· N + j
θ
] ⩾ d;
Algorithm 2: Point Visibility Test in equal-angle sphere
sampling scheme.
Regarding the time complexity of the method, it is
important to highlight that the algorithm is executed
only once per image, considering all eligible points
as a single M × 3 matrix. The code requires a to-
tal of three matrix multiplications (two to obtain the
points’ coordinates in the pixel coordinate system and
one to calculate the norm), along with one matrix ad-
dition, two invocations of inverse trigonometric func-
tions, and the complexity of the selected interpolation
method. Additionally, the algorithm benefits from be-
ing executable in parallel. Due to its low time com-
plexity, the method ensures real-time performance.
5 RESULTS
5.1 Implementation
The Geospatial Data Pre-processing Module was im-
plemented in Python and is available in GitHub
1
. This
module takes in a 3D mesh model of the world, 3D
coordinates of annotated paths and the number of di-
rections N. For each annotated point, the module cal-
culates its N × N visibility map by calculating the z-
buffer from the point in the considered direction. In
our implementation we employed a ray-triangle in-
tersection algorithm (Snyder and Barr, 1987; Shirley
1
https://github.com/OutdoorAR-
POC/GeoDataPreProcessing
Real-Time 3D Information Visualization on Mobile Devices: Efficient Occlusion Detection for Geospatial Applications
281
et al., 2021) that utilizes barycentric coordinates to
represent triangles in a world mesh model.
The Mobile AR Application was implemented in
Kotlin programming language, the default program-
ming language for applications dedicated for Android
devices. A Proof-of-Concept implementation can be
found in GitHub
2
. All input files, including visibil-
ity maps and geospatial annotations as well as images
and camera extrinsic information, were provided as
resources to the application.
5.2 Case Study
The case study was concerned with a rock outcrop,
representative of complexity observed in such sce-
narios, whose 3D model was obtained from pho-
tographs using the Structure from Motion (SfM) tech-
nique (Schonberger and Frahm, 2016; Carrivick et al.,
2016) in Meshroom software (Griwodz et al., 2021).
The resulting mesh was further cleaned and deci-
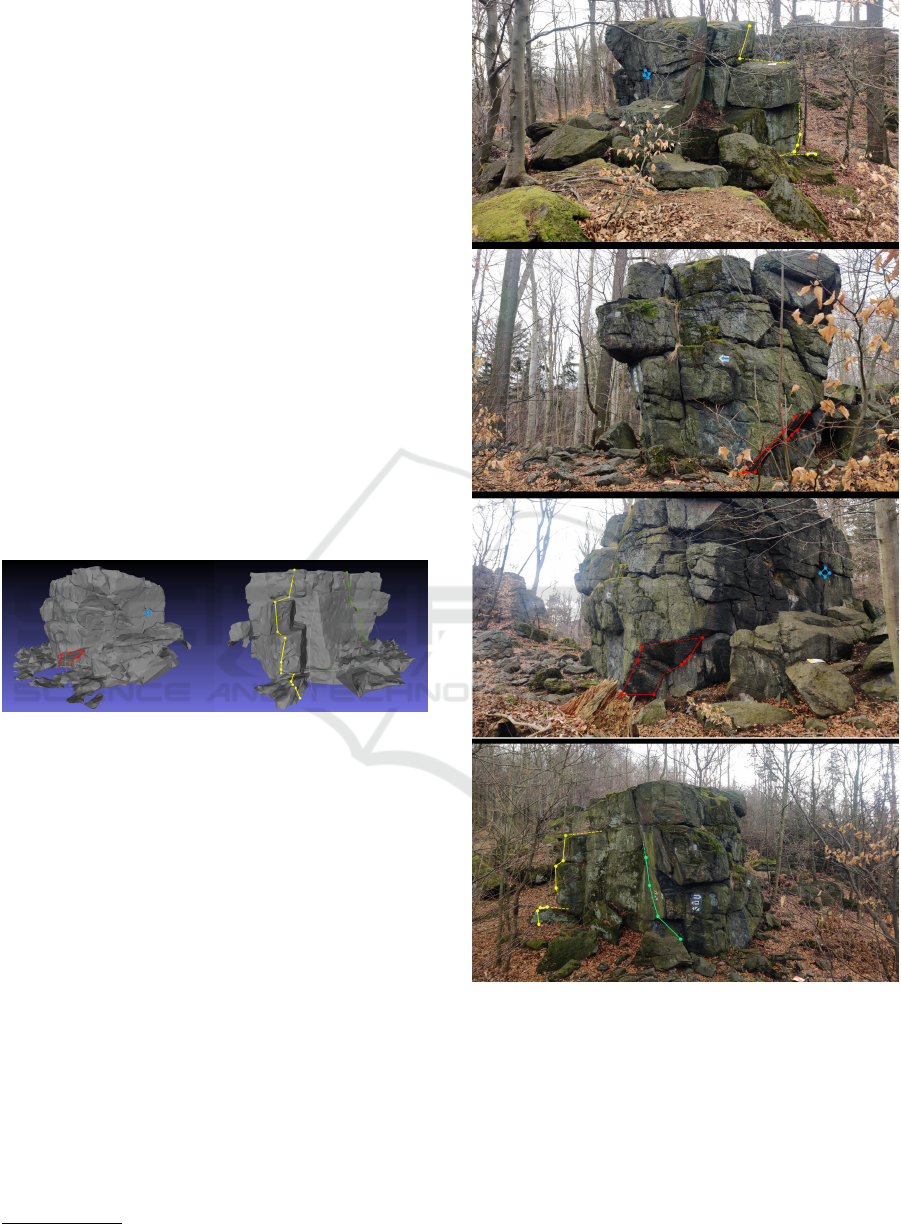
mated with Meshlab (Cignoni et al., 2008). To test the
visibility of different geometries around the rock out-
crop, four multi-point polylines and polygons were
designed, as illustrated in Figure 4.
Figure 4: 3D world model with annotated geometries. Left:
red and blue polygons. Right: yellow and green polylines.
In order to test the algorithm we utilized the same
set of images as for the 3D model creation enriched
with data output by the SfM process - camera intrin-
sic matrix and camera extrinsic matrices for each im-
age. The algorithm was tested on 77 views of the rock
formation, each captured from a different viewpoint.
Example results for N = 8 are presented in Figure 5,
showcasing correct outcomes of the method from var-
ious viewpoints.
5.2.1 Effect of Visibility Map Size
In our study, we experimented with different number
of equidistant angles (N), including 2, 4, 8, 16, and 32
angles. The resulting visibility maps had sizes |V | of
4, 16, 64, 256, and 1024, respectively. We present ac-
curacy and F1-score for varying sizes |V | in Table 1.
From the results, we find that N = 8 provides accu-
rate visibility measurements with the accuracy score
2
https://github.com/OutdoorAR-POC/MobileApp
Figure 5: Example results for N = 8 from various view-
points.
of 0.9423 and F1-Score of 0.8793. Increasing N to 16
does not significantly improve the accuracy (0.9649),
yet yield a significant boost on the F1-Score that at-
tains 0.9272. Increasing N to 32 slightly improves the
scores but the increase in improvement is offset by a
fourfold increase in the required disk space.
When evaluated visually in images, the method
demonstrated some limitations when additional ob-
GRAPP 2024 - 19th International Conference on Computer Graphics Theory and Applications
282
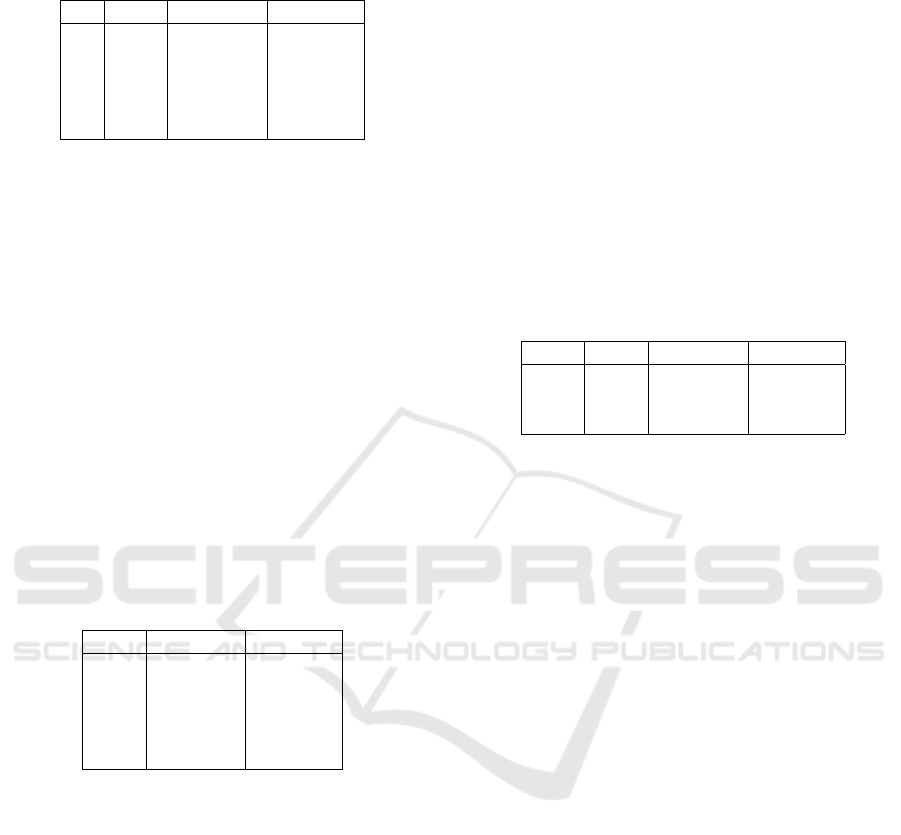
Table 1: Performance scores of the algorithm depending on
the number of viewpoints N.
N |V | Accuracy F1-Score
2 4 0.7609 0.4401
4 16 0.8793 0.7384
8 64 0.9423 0.8793
16 256 0.9649 0.9272
32 1024 0.9710 0.9402
jects, not included in the digital world model, were
present in images.
5.2.2 Effect of Sphere Sampling Scheme
Equal-angle sampling, although computationally at-
tractive, gives points that are not uniformly distributed
on a sphere. In the following experiment we uti-
lized the Fibonacci lattice (Gonz
´
alez, 2010), in which
points are almost evenly spaced on the sphere sur-
face, and we constructed visibility maps of the same
size as in the previous experiment. From the results,
presented in Table 2, it can be concluded that for
|V | ≥ 64 accuracy and F1 scores are comparable to
those obtained for the equal-angle sampling scheme.
For smaller sizes of |V |, the results are significantly
better with the Fibonacci lattice, however, they are
still not sufficiently high.
Table 2: Performance scores of the algorithm for Fibonacci
lattice sphere sampling.
|V | Accuracy F1-Score
4 0.8335 0.6599
16 0.8980 0.7747
64 0.9423 0.8785
256 0.9618 0.9218
1024 0.9733 0.9446
5.2.3 “Small Mesh” Experiment
We conducted a space complexity comparison be-
tween a visibility map and a simplified mesh. Intu-
itively, complex scene geometries with a limited num-
ber of annotated geometries favor the use of a visibil-
ity map. On the other hand, a simple scene geometry
accompanied by a large number of annotated geome-
tries would likely benefit from a simplified mesh. The
key question then is: how does the size of a visibility
map, i.e. a vector of |V | double precision numbers,
compare to that of a mesh file? The mesh file contains
a list of 3D vertices, with single precision coordinates,
and a list of faces, represented as triples of integer in-
dices of vertices. We assume 8B for double precision,
4B for single precision, and 4B for unsigned integer.
Let |W | and |F| be the numbers of vertices and faces
in the small mesh, respectively. The space require-
ment of the visibility map is then 8|V |, whereas that
of the mesh accounts for 12(|F| + |W |). That implies
that if |V | = 64 (N = 8), then the total number of faces
and vertices in a mesh, |F| + |W |, would have to be
approximately 43 for the space requirements to equal.
The original mesh was decimated to approxi-
mately 1024, 2048 and 4096 faces with Quadratic
Edge Collapse Decimation in Meshlab (Cignoni et al.,
2008). The obtained results are presented in Table 3.
It can be observed that, for the scene and annota-
tions considered in our case study, accuracy and F1
scores comparable to visibility maps of size |V | = 64
are achieved no sooner than when |F| +|W | = 2048+
4095.
Table 3: Performance scores of direct ray tracing on simpli-
fied meshes.
|W | |F| Accuracy F1-Score
513 1023 0.8843 0.7335
1025 2047 0.9118 0.7979
2048 4095 0.9396 0.8674
6 DISCUSSION AND FUTURE
WORK
The proposed method offers several noteworthy ad-
vantages. It accurately renders annotated geometries
and it adheres to all four stated requirements, includ-
ing low time and space complexities. The method,
however, does have some limitations that need to be
considered. Firstly, it relies on a well-mapped world
where all objects are accurately scanned and included
in the digital model. If there exist discrepancies be-
tween the real world and a model then annotated
points may be incorrectly classified as visible or not
visible. Secondly, the method requires that the mesh
of the world is created in order to calculate visibil-
ity maps. While in multiple professional scenarios
such models are nevertheless created for analytic pur-
poses, this requirement could pose a computational
challenge.
One possible direction of future research is to
combine the proposed method with coarse depth
maps. This integration could help account for vegeta-
tion and objects that are not registered in the world’s
model. Additionally, alternative interpolation meth-
ods, such as bi-linear interpolation, could be explored
in search for more accurate results compared to the
nearest neighbor interpolation used in our study.
Real-Time 3D Information Visualization on Mobile Devices: Efficient Occlusion Detection for Geospatial Applications
283

7 CONCLUSION
In this paper, we address the challenge of real-time
3D information visualization on mobile devices under
constraints of limited connectivity, battery capacity,
storage limitations, and real-time performance. We
propose associating each annotated point with a vis-
ibility map that captures visibility from that point in
multiple angular directions. By leveraging the cam-
era’s position and orientation and identifying the near-
est viewing angle within each point’s visibility map,
we efficiently determine the point’s visibility in the
scene. Obtained experimental results demonstrate
that the proposed method enables real-time rendering
of annotated data and provides an accurate alternative
to techniques relying on scene depth estimation.
REFERENCES
Billinghurst, M., Clark, A., and Lee, G. (2015). A survey
of augmented reality. Foundations and Trends® in
Human–Computer Interaction, 8(2-3):73–272.
Bowman, D. A., North, C., Chen, J., Polys, N. F., Pyla,
P. S., and Yilmaz, U. (2003). Information-rich virtual
environments: theory, tools, and research agenda. In
Proceedings of the ACM symposium on Virtual reality
software and technology, pages 81–90.
Carrivick, J. L., Smith, M. W., and Quincey, D. J. (2016).
Structure from Motion in the Geosciences. John Wiley
& Sons.
Cayla, N. and Martin, S. (2018). Chapter 16 - digital geovi-
sualisation technologies applied to geoheritage man-
agement. In Reynard, E. and Brilha, J., editors, Geo-
heritage, pages 289–303. Elsevier.
Cignoni, P., Callieri, M., Corsini, M., Dellepiane, M.,
Ganovelli, F., and Ranzuglia, G. (2008). MeshLab:
an Open-Source Mesh Processing Tool. In Scarano,
V., Chiara, R. D., and Erra, U., editors, Eurographics
Italian Chapter Conference. The Eurographics Asso-
ciation.
Fedorov, R., Frajberg, D., and Fraternali, P. (2016). A
framework for outdoor mobile augmented reality
and its application to mountain peak detection. In
Augmented Reality, Virtual Reality, and Computer
Graphics: Third International Conference, AVR 2016,
Lecce, Italy, June 15-18, 2016. Proceedings, Part I 3,
pages 281–301. Springer.
Gonz
´
alez,
´
A. (2010). Measurement of areas on a sphere
using fibonacci and latitude–longitude lattices. Math-
ematical Geosciences, 42:49–64.
Gonz
´
alez-Delgado, J.
´
A., Mart
´
ınez-Gra
˜
na, A., Holgado,
M., Gonzalo, J. C., and Legoinha, P. (2020). Aug-
mented reality as a tool for promoting the tourist value
of the geological heritage around natural filming loca-
tions: A case study in “Sad Hill”(The Good, the Bad
and the Ugly Movie, Burgos, Spain). Geoheritage,
12:1–11.
Griwodz, C., Gasparini, S., Calvet, L., Gurdjos, P., Cas-
tan, F., Maujean, B., De Lillo, G., and Lanthony, Y.
(2021). Alicevision Meshroom: An open-source 3D
reconstruction pipeline. In Proc. 12th ACM Multimed.
Syst. Conf. - MMSys ’21. ACM Press.
H
¨
ollerer, T., Feiner, S., Terauchi, T., Rashid, G., and Hall-
away, D. (1999). Exploring MARS: developing indoor
and outdoor user interfaces to a mobile augmented re-
ality system. Computers & Graphics, 23(6):779–785.
Ignatov, A., Malivenko, G., Timofte, R., Treszczotko, L.,
Chang, X., Ksiazek, P., Lopuszynski, M., Pioro, M.,
Rudnicki, R., Smyl, M., et al. (2023). Efficient single-
image depth estimation on mobile devices, mobile
AI & AIM 2022 challenge: report. In Computer
Vision–ECCV 2022 Workshops: Tel Aviv, Israel, Octo-
ber 23–27, 2022, Proceedings, Part III, pages 71–91.
Springer.
Jain, P., Manweiler, J., and Roy Choudhury, R. (2015).
Overlay: Practical mobile augmented reality. In Pro-
ceedings of the 13th Annual International Conference
on Mobile Systems, Applications, and Services, pages
331–344.
Karpischek, S., Marforio, C., Godenzi, M., Heuel, S.,
and Michahelles, F. (2009). Swisspeaks–mobile aug-
mented reality to identify mountains. In Workshop
at the International Symposium on Mixed and Aug-
mented Reality 2009 (ISMAR 2009).
Pica, A., Reynard, E., Grangier, L., Kaiser, C., Ghiraldi,
L., Perotti, L., and Del Monte, M. (2018). Geoguides,
urban geotourism offer powered by mobile application
technology. Geoheritage, 10:311–326.
Schonberger, J. L. and Frahm, J.-M. (2016). Structure-
from-motion revisited. In Proceedings of the IEEE
conference on computer vision and pattern recogni-
tion, pages 4104–4113.
Shi, S., Nahrstedt, K., and Campbell, R. (2012). A real-
time remote rendering system for interactive mobile
graphics. ACM Transactions on Multimedia Com-
puting, Communications, and Applications (TOMM),
8(3s):1–20.
Shirley, P., Ashikhmin, M., and Marschner, S. (2021). Fun-
damentals of computer graphics. AK Peters/CRC
Press, 5th ed. edition.
Snyder, J. M. and Barr, A. H. (1987). Ray tracing complex
models containing surface tessellations. ACM SIG-
GRAPH Computer Graphics, 21(4):119–128.
Stylianidis, E., Valari, E., Pagani, A., Carrillo, I.,
Kounoudes, A., Michail, K., and Smagas, K. (2020).
Augmented reality geovisualisation for underground
utilities. PFG, 88:173–185.
Tavani, S., Corradetti, A., Granado, P., Snidero, M., Seers,
T. D., and Mazzoli, S. (2019). Smartphone: An al-
ternative to ground control points for orienting vir-
tual outcrop models and assessing their quality. Geo-
sphere, 15(6):2043–2052.
Westhead, R., Smith, M., Shelley, W., Pedley, R., Ford, J.,
and Napier, B. (2013). Mobile spatial mapping and
augmented reality applications for environmental geo-
science. Journal of Internet Technology and Secured
Transactions, 2(1-4):185–190.
GRAPP 2024 - 19th International Conference on Computer Graphics Theory and Applications
284
