
Business Intelligence Enhancements to EDC for Clinical Trial
Management
Alessio Bottrighi
1a
, Elisa Gandini
2
, Stefano Nera
1b
, Luca Piovesan
1c
, Erica Raina
1d
and Paolo Terenziani
1e
1
Department of Science and Technological Innovation University of Eastern Piedmont Alessandria, Italy
2
Fondazione Italiana Linfomi, Alessandria, Italy
Keywords: Intelligent Systems, Data Analysis and Visualization for Health, Analytical Intelligent Processing, Clinical
Trials, Multi-Dimensional Conceptual Representation, Electronic Data Capture.
Abstract: We describe our experience in enhancing Electronic Data Capture systems with Business Intelligence
facilities, to provide additional decision support facilities. In particular, with our framework, we support
analytical intelligent reporting, visualization and querying to improve managerial control in trial conduct. In
this paper, we discuss a principled methodology, in which the analytical intelligent extension is based on an
explicit conceptual modelling of a multi-dimensional view of the clinical trials. While our approach is general,
we have developed it in the context of long-term cooperation with the Italian Lymphoma Foundation (FIL),
managing dozens of clinical trials distributed in many national (Italian) and international institutes.
1 INTRODUCTION
An Electronic Data Capture system (EDC) is a
software developed to support physicians in the
management (data entry, validation and reporting) of
data in clinical trials. Due to the number and role of
clinical trials in modern medicine, EDCs are gaining
a primary role in the medical context.
On one side, many commercial EDCs have been
developed by major software companies; on the
other, research in the area is still very active.
However, traditional EDCs still have several
limitations, especially regarding reporting and data
visualization. Most of them allow users to create basic
reports, that can be visualised as tabular data,
diagrams, or downloaded and used externally to the
EDC. However, interactive queries and integrated
reports across different trials are facilities mostly
absent in EDCs.
Since 2016, we have had a long-term cooperation
with the Italian Lymphoma Foundation (henceforth
FIL) concerning the development of new
a
https://orcid.org/ 0000-0001-9291-128X
b
https://orcid.org/ 0009-0009-7626-1411
c
https://orcid.org/ 0000-0002-5923-5061
d
https://orcid.org/ 0009-0001-4617-4992
e
https://orcid.org/ 0000-0002-9014-7537
methodologies to manage clinical trial data. FIL is a
non-profit organization that coordinates and carries
out scientific research activities for the treatment of
lymphomas and lymphoproliferative disorders,
involving about 150 institutes (Hospitals,
Universities, and research centers) located in the
national territory, with the aim to improve centers
skills in terms of research and assistance. Since 2010,
it led or co-managed about 70 clinical trials.
Notably, lymphoma has a serious incidence in the
human population (in Italy, a new patient is diagnosed
with lymphoma every 2 hours). This makes each
advancement in disease treatment of fundamental
importance, including the ones aiming at providing
better-quality patient datasets and new methodologies
to analyze them. In this context, we have supported
FIL in the management of more than 20 studies, as
well as in several types of extensions to EDC
software, based on innovative Artificial Intelligence
technologies for data acquisition and analysis. It is
worth stressing that even if our methodologies are
mostly inspired by such a collaboration, they are
Bottrighi, A., Gandini, E., Nera, S., Piovesan, L., Raina, E. and Terenziani, P.
Business Intelligence Enhancements to EDC for Clinical Trial Management.
DOI: 10.5220/0012396600003657
Paper published under CC license (CC BY-NC-ND 4.0)
In Proceedings of the 17th International Joint Conference on Biomedical Engineering Systems and Technologies (BIOSTEC 2024) - Volume 2, pages 537-544
ISBN: 978-989-758-688-0; ISSN: 2184-4305
Proceedings Copyright © 2024 by SCITEPRESS – Science and Technology Publications, Lda.
537

general enough to be applied in trials for different
diseases.
Usually, a modern clinical trial is distributed
among several research centers (each one with the
responsibility for managing and collecting data of a
local group of patients) and it is coordinated by a trial
sponsor (in our case, FIL). Each trial goes through
several phases (e.g., enrollment, treatment, interim
analysis, follow-up), partially overlapping between
them. In each phase, users with different roles access
the data (e.g., principal investigators, physicians, data
managers, and study coordinators), each one with
different needs in terms of data queries and visibility.
In the last years, some BI approaches have been
proposed in the literature for the analysis of clinical
data and data collected in clinical trials, supporting
healthcare organizations in mechanizing the tasks of
analysis, decision-making, strategy formulation and
forecasting. BI methodologies can be adopted to
collect, process, and analyze the large volumes of
data involved in clinical trials, and to convert them
into effective business value in decision-making
through the creation of analytical intelligent reporting
platforms.
For instance, the work in (Farnum et al., 2019)
proposes a dimensional relational data warehouse that
can integrate different types of clinical data and
provides graphical facilities for data access. (Yang et
al., 2019) proposes a NoSQL warehouse supporting
clinical data management, medical review, risk-based
monitoring, safety signal detection, post hoc analysis
of completed trials and many others. The work in
(Bose & Das, 2012) is similar to our one, since it
proposes the use of a BI tool as an “add-on” for a
clinical trial management system. In (Chelico et al.,
2017) an interesting case study regarding clinical
quality improvement using BI is reported. Among the
approaches in the literature, (Bettio et al., 2021) is the
most similar to ours, since it aims at managing data
from different facioscapulohumeral dystrophy
clinical trials, collected through the EDC
OpenClinica (OpenClinica Website, n.d.). Finally, the
paper (Karami et al., 2017) analyses the benefits of
clinical data warehouse applications in creating
intelligence for disease management programs.
However, all the above approaches do not
consider the fact that in a clinical trial two macro-
types of users are usually involved:
• Organizational users (e.g., study coordinators)
• Clinical users (e.g., physicians)
While the former may access data through BI
platforms, the latter usually cope with EDC only. As
a result, currently, clinical users cannot take
advantage of the facilities provided by BI platforms,
as discussed above.
Therefore, the main goal of our work with FIL is
to provide a homogeneous and integrated framework
in which such facilities are available to all users.
Technically speaking, this goal requires the
integration between BI and EDC in a unique
framework.
Notably, the requirements and facilities needed by
organizational users and clinical users significantly
differ. For instance
• They are not interested in the same data, at the
same granularities
• The need for different types of analyses
For such a reason, a fundamental aspect of the
integration between BI and EDC is the definition of
data-and-analyses access rights depending on the type
of users.
Moreover, from the methodological point of view,
the integration is more efficient and easy if defined
starting from a well-structured conceptual modelling
of the data. For such a reason, we apply the
methodology and the formalism proposed in
(Golfarelli & Rizzi, 2021) as a starting point for the
integration above.
Notably, the work described in this paper lays the
foundations to reach such goals, but we only tested it
in the context of FIL clinical trials. An additional goal
of our work is to provide a framework easily
extendable, allowing the integration of data sources,
clinical/organizational aspects and types of users not
considered in the current definition.
2 SYSTEM ARCHITECTURE
FIL has been managing clinical trials for about 20
years (more than 100 studies). As a consequence, a
large heterogeneity of software platforms has to be
managed. In particular, patients’ data are currently
collected using three different EDC platforms
(including the well-known REDCap (REDCap, n.d.)
and OpenClinica (OpenClinica Website, n.d.)), and
data from a few old trials are stored in static data files.
“Organizational” data (e.g., center data, non-
conformance reports) are managed by a clinical trial
management system, and all the pharmacovigilance
activities (e.g., adverse event reporting) are managed
by a third-party software developed by “San Giovanni
Battista” hospital (one of the largest hospitals in
Italy). Similarly to software platforms, even the data
structures and variables have changed over time, both
HEALTHINF 2024 - 17th International Conference on Health Informatics
538
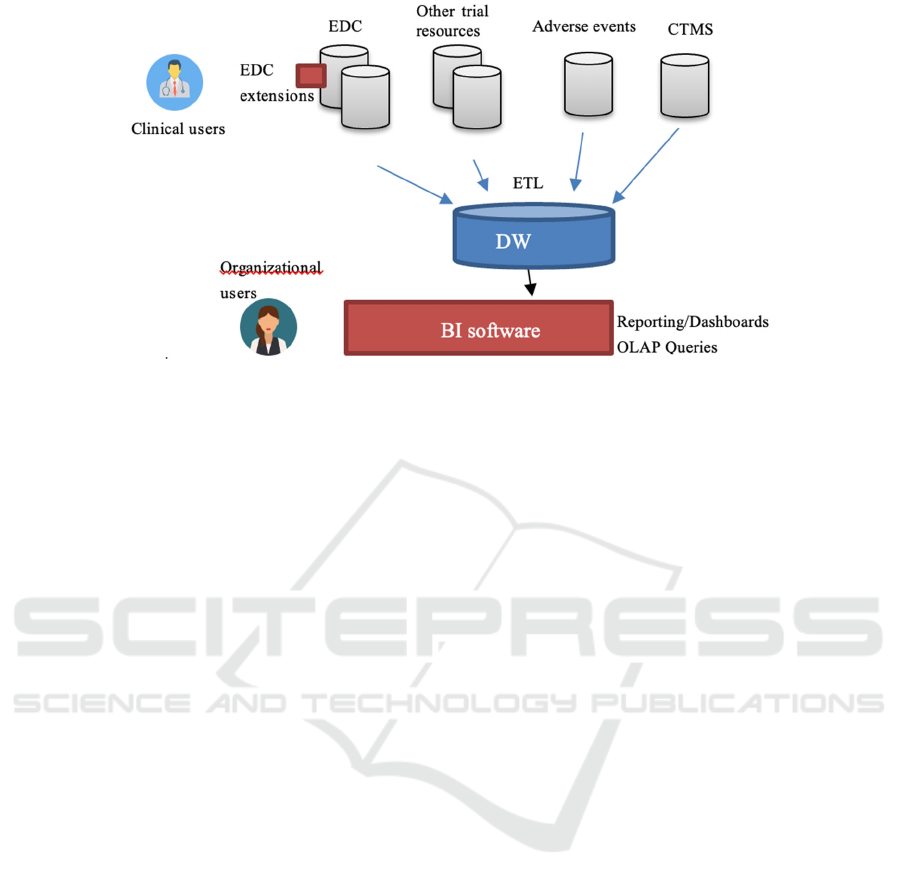
Figure 1: General architecture of the framework.
due to changes in clinical practice/examinations and
regulations (e.g., privacy ones). However, many
operational decisions involve pieces of information
from different sources. Therefore, there is a need for
an architecture that can reconcile such a variety of
sources and allow users to perform analytical queries
in an integrated way. To address such a need, we have
adopted a Business Intelligence methodology. We
have designed and implemented a two-level Data
Warehousing architecture (see Fig. 1). A two-step
ETL process collects and merges data from different
sources, and imports them daily into a relational Data
Warehouse (DW). A BI framework accesses the DW,
providing reporting instruments, dashboards and
OLAP queries. A peculiarity of our approach derives
from the fact that our facilities should be accessed by
two different types of users: organizational and
clinical users. The former may need to access the
globality of data and usually exhibit advanced IT
capabilities, so that can interactively use the Business
Intelligence framework in a “classic” way. On the
other hand, the latter usually focus on specific trials
and sites, access data only using the EDCs and need
reports and/or dashboards built automatically by the
framework.
To integrate EDCs and BI platforms, and to
manage the needs above, we developed a set of EDC
extensions (one for each platform), with the following
roles:
Clinical User Interaction: they provide easy-
to-use and integrated-with-EDC access to the
BI facilities for clinical users
Metadata Collection: clinical trial data
collection is not characterized by a “standard”
structure. Each time a new trial is designed in
the EDC, data collection events and variables
must be defined by the study designer. This
makes the ETL process “non-standard” and
requires metadata describing how the source
data are mapped into the DW. Our EDC
extensions automatically support the study
designer, on the basis of the conceptual model
(see Section 3) and of the specific trial design,
in the definition of the metadata
Dashboard and Report Building: while
some dashboards and reports are quite
standard for each trial (e.g., the ones
describing the enrollment phase), some are
not. As a simple example, longitudinal events
require reports and dashboards showing the
trends of the collected data. Our EDC
extensions analyze the data collection design
and request the BI framework to generate ad-
hoc reports/dashboards to manage or modify
existing ones. Notably, such a facility is easily
extendable to cope with new types of data.
Notably, for the implementation of the EDC
extension, we have taken advantage of the
extendibility, through the development of
plugins/additional modules, provided by modern
EDCs.
3 DATA WAREHOUSE
CONCEPTUAL MODELLING
AND IMPLEMENTATION
A main issue in Data Warehouse design is the
identification of the data “relevant” for analytical
processing and their structuring into a (relational
and/or multidimensional) database. We started the
Business Intelligence Enhancements to EDC for Clinical Trial Management
539
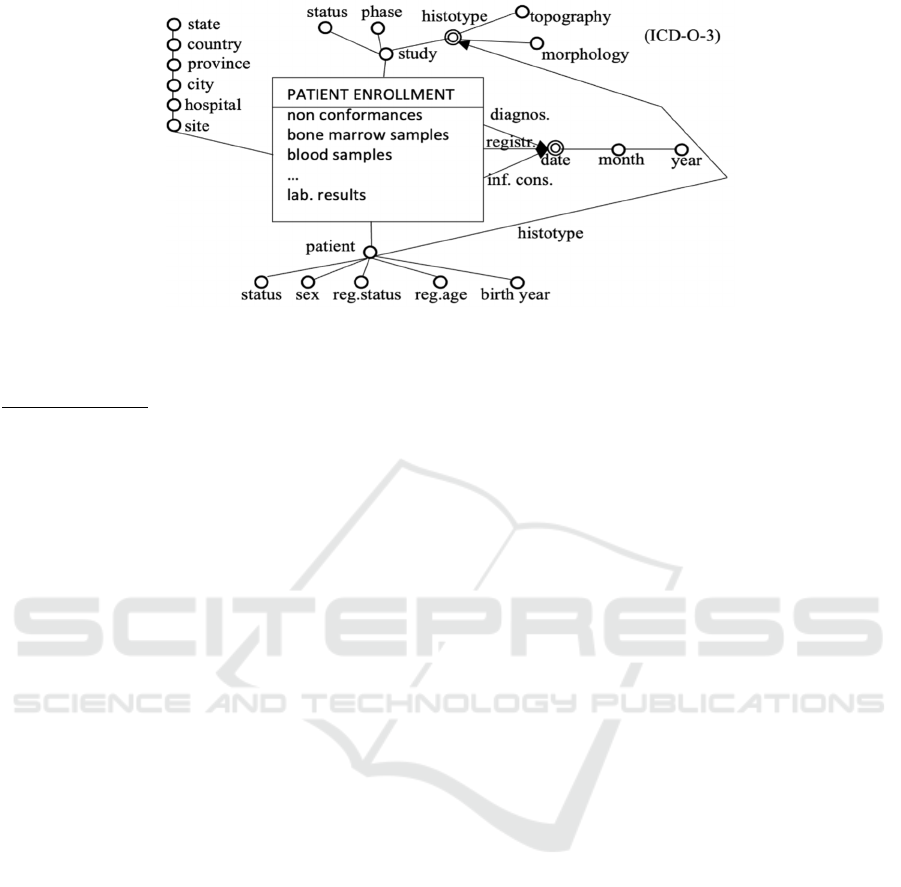
Figure 2: Dimensional fact model of the fact “Patient Enrollment”.
design of the Data Warehouse for clinical trials from
conceptual design. Specifically, we have chosen the
Dimensional Fact Model (DFM) (Golfarelli, 2009) as
the conceptual formalism, since it supports a user-
friendly multi-dimensional view of data, as well as a
semi-automatic way to move from the conceptual
model to a relational logical (ROLAP)
implementation of the Data Warehouse.
In the following, we illustrate our modelling
approach considering, as an example, the core notions
of the fact (patient) “enrolment” (intended as the
overall involvement of the patient in the trial).
Notably, an analogous model has been provided for
the other facts in the domain of trials:
Adverse Event (AE): with dimensions onset
and resolution dates, study phase, type of AE,
Serious Adverse Event (SAE), action taken,
outcome and with measure duration;
Therapy: with dimensions date, drugs, study
phase, assessment and with measures (number
of) non-conformances, drug doses
modifications, AEs;
Follow-up Visit: with dimensions date,
assessment and with measures (number of)
late AEs
The central notion in DFM is “facts”, modelling
the types of concepts that are interesting for the
analyses (i.e., the main types of events; see e.g.,
PATIENT ENROLLMENT in Fig. 2). Each fact is
described in terms of (Golfarelli, 2009) measures,
dimensions, and hierarchy of dimensional attributes.
Measures are numeric properties of facts,
describing quantitative aspects on which analyses
focus (number of non-conformances, samples, lab.
results in Fig. 2). Dimensions are properties of facts
(with values in a finite domain) that model the
analysis coordinates, i.e., the coordinates along which
data have to be aggregated/disaggregated (OLAP
Roll-Up and Drill-Down operations). In the case of
enrolment, together with domain experts, we have
identified 6 enrolment dimensions: patient, site,
study, and the three temporal dimensions. As a matter
of fact, in this domain, experts emphasized that the
registration date, diagnosis date, and informed
consensus date are all necessary pieces of information
to be considered for further analyses (see Fig. 2).
Dimensional attributes include dimensions, and
attributes describing them. In the DFM, they are
structured in hierarchies, in which arcs represent
functional (i.e., many-to-one) dependencies. For
example, the temporal dimensions consider the day-
month-year hierarchy. Intuitively speaking, levels in
the hierarchies represent the different possible levels
of data aggregation. Notably, the patient dimension
considers several different dimensional attributes
(histotype, status, sex, …). To represent patient
histotypes, we used the ICD-O-3 classification
(World Health Organization, 2013), which can be
aggregated by topography and morphology. ICD-O-3
can be used both to aggregate patients and studies.
Indeed, in many cases, different histological subtypes
can be considered in the same study. It is worth
stressing that, even if our model is specific for
lymphoma trials, it can be easily generalized by
replacing the ICD-O-3 classification with the general
ICD one (ICD-11, n.d.).
We carried out the conceptual design together
with FIL experts, starting from an in-depth analysis
of the available data, and in strict cooperation with
FIL experts.
At the implementation level, we have provided a
ROLAP representation of the Data Warehouse, based
on the classical STAR schemas. Our implementation
has been facilitated by the fact that the mapping from
the DFM model and the corresponding STAR schema
is mostly automatic (Golfarelli & Rizzi, 2021).
HEALTHINF 2024 - 17th International Conference on Health Informatics
540
4 RECONCILIATION AND ETL
(EXTRACTION,
TRANSFORMATION, AND
LOADING)
In our framework, data are extracted from data
sources through dedicated APIs (for EDC data), and
queries (for CTMS and adverse event reporting).
Static data files are extracted once-for-all. Given the
heterogeneity of data sources, we have chosen to
implement a two-level data reconciliation: the first
level reconciles data in each EDC platform (each trial
has a different data schema), and then we reconcile
from different EDCs and other sources (CTMS,
adverse event reports, etc.). Currently, our framework
manages data from 112 trials, for a total of 12900
patients (and about 60000 tuples). Different forms of
data cleaning and transformation are performed by
dedicated stored procedures, not reported for brevity.
Cleaning, Transformation and Loading are performed
on the basis of metadata, collected whenever a new
trial is created. Metadata fixes the correspondence
between the concepts in the source data and the
corresponding DW concepts. Each time (the schema
of) a new trial is created, our framework generates a
form (see Figure x) which allows study designers to
map, through transformation formulas, the trial
concepts with the ones in the DW conceptual model.
Notably, the form generation is automatic and
parametric concerning the conceptual model and
partially pre-compiled by the EDC extensions (e.g.,
information about longitudinal/repeatable data, and
the associations patients-centers). For instance, such
metadata are used to rule measure/unit conversions,
discretization and aggregation of data. It is worth
stressing that the definition of transformation
formulas can be performed directly by study designer
users. Indeed, if the DW concepts have a
correspondence with the EDC variables (e.g., field
“year_of_birth” in Figure 3), the mapping is made
through a drop-down menu. On the contrary, when
more complex rules need to be defined (e.g., field
“registration_age”, which is calculated as the
difference between the year of registration and the
year of birth), we take advantage of the languages
already adopted in the specific EDC tools.
In our experience, the systematic adoption of
“metadata-based” ETL operations greatly facilitates
the definition of a modular, effective and scalable
ETL process and its maintenance.
Figure 3: Part of a form automatically generated to support
study designers to map EDC data to DW concepts.
5 ANALYTICAL PROCESSING,
QUERYING AND
VISUALIZATION
We have developed a set of dashboards to address the
most common queries of each area of trials. In
particular, by default, the following dashboards are
generated (of filled, if already present in the BI
platform) starting from the conceptual model:
Enrolment dashboard: showing information
about patients’ enrolment distribution in
centers, areas, time, gender, …
Adverse event dashboard: showing
information about AE occurrences in trials,
phases, centers, during a specific treatment,
Therapy dashboard: showing information
about the therapy phases in the trials (e.g., the
distribution of non-conformances)
Follow-up dashboard: reporting information
about the occurrence of follow-up visits and
adverse events
Longitudinal data dashboard: showing the
trends of longitudinal data in patients
In addition to previous dashboards, the following
ones are maintained by the framework, but mainly
feed by non-EDC sources (e.g., CTMS software):
Fundraising dashboard
Trial management dashboard: showing
bureaucratic data
Operating officer dashboard: mainly showing
information about center performances
It is worth stressing that the above lists are
incomplete, since new dashboards are currently under
development on the basis of the feedback obtained by
users.
Each dashboard can be navigated at different
levels of detail depending on the user’s privileges.
Every query in the dashboard can be further refined
with the GUI. In Fig. 4, e.g., we show a part of the
(anonymized) Enrolment dashboard. The left box
shows the enrolment trend and has been built using
information coming from both EDCs and CTMS. x-
axis represents time. The histogram represents the
Business Intelligence Enhancements to EDC for Clinical Trial Management
541
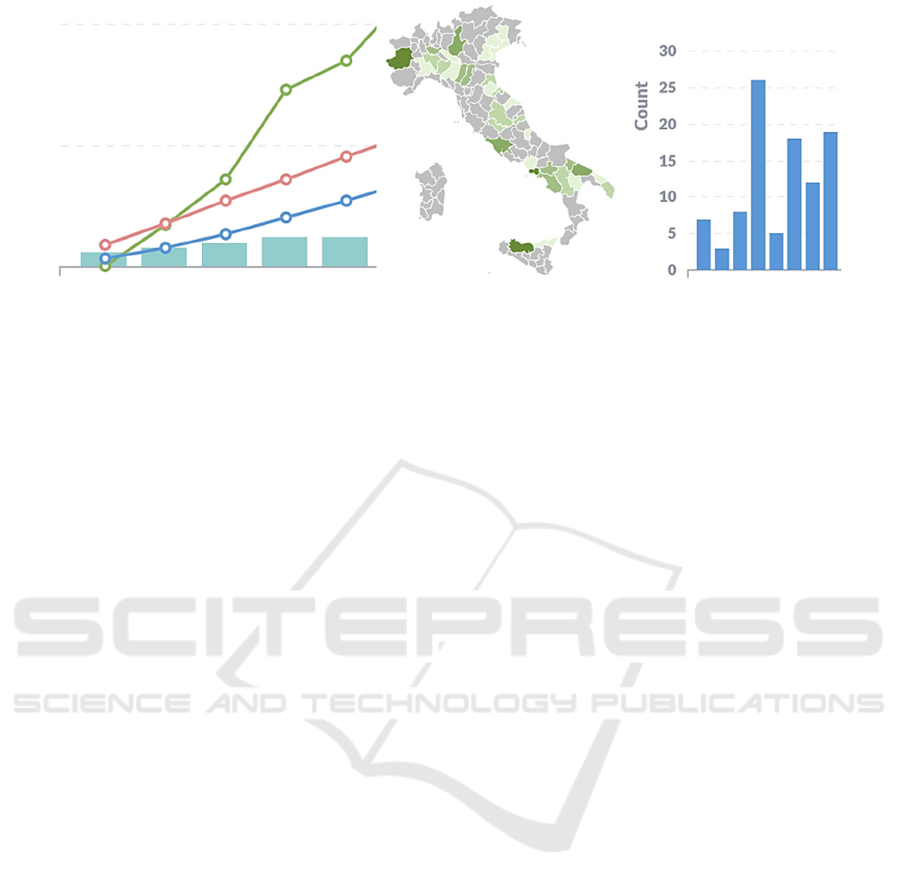
Figure 4: Part of the Enrolment dashboard.
cumulative number of sites that have started the local
enrolment. The blue and red lines represent the ideal
cumulative enrolment trend by considering or not the
active sites respectively. The green line represents the
actual enrolment. The central and the right boxes of
Fig. 4 represent the enrolment by geographical area
and the number of enrolments by the site (site names
are omitted).
Notably, as discussed above, organizational and
clinical users have different ways to access
dashboards and the BI tool. Indeed, clinical users
access only pre-built dashboards through the EDC
extensions. Technically speaking, each time a clinical
user wants to access the BI facilities, she visits a
specific webpage provided by the EDC extension.
Then, she is asked which kind of dashboards she
wants to visualize, choosing among available ones,
depending on her privileges. Notably, even clinical
users can choose between filtering dashboards on a
specific trial or not. However, non-filtered
dashboards show only data regarding the trials
accessible by the user at hand. After the choice, the
EDC extension contacts the BI software and requires
the specific dashboards, that are shown to the user
who can then apply further filters, if provided by the
dashboards. Notably, we implemented our
framework with Metabase (Metabase | Business
Intelligence, Dashboards, and Data Visualization,
n.d.), a BI open-source framework that greatly
facilitates such a kind of implementation.
On the other hand, organizational users can
directly access the BI framework (Metabase),
accessing both the pre-built dashboards and the
graphical query builder provided by the framework.
This task requires some technical expertise that can
be acquired in a few hours with a dedicated lesson or
following the online documentation. However,
considering the feedback received by the users, also
in this case, our approach based on conceptual
modelling has been useful. Indeed, the conceptual
model turned out to be useful in the definition of the
queries.
6 CONCLUSIONS
EDCs are gaining a primary role in medicine. In
particular, they constitute the primary software tool
used by clinical users to access and query clinical trial
data. Recently, Business intelligence (BI)
methodologies have been proposed to support
healthcare organizations in mechanizing the tasks of
analysis, decision-making, strategy formulation and
forecasting. The facilities provided by BI platforms
could be very useful not only for organizational users,
but also for clinical users. However, usually, the latter
only interact with EDC platforms.
In this paper, we propose a novel approach in
which BI and EDC platforms are integrated into a
homogeneous framework, to adequately support both
organizational and clinical users. We propose an
integrated architecture, in which integration is
enforced at different levels (conceptual model, ETL
and metadata, analysis). In particular, our approach is
also characterized by the adoption of a BI
methodology starting from the conceptual design of
facts. Concretely, we have operated in the context of
lymphoma trials managed by FIL, but the basic ideas
can be applied to other typologies of trials, and other
organizations.
Related approaches in the literature mostly do not
start from conceptual modelling (see, however (Bose
& Das, 2012)), and do not integrate with EDCs,
which does not support the interaction with clinical
users (who operate with EDCs and not with CTMS).
The approach in (Bettio et al., 2021) is the most
closely related to ours. However, it does not provide
conceptual modelling, it is mainly devoted to a
specific disease (facioscapulohumeral muscular
HEALTHINF 2024 - 17th International Conference on Health Informatics
542

dystrophy) and does not provide a metadata-based
loading. In this paper, we have described our
experience in providing DW and BI support for FIL
data about lymphoma trials. An innovative aspect of
our approach is the adoption of a conceptual design
phase (leading to an explicit conceptual model), and
of a user-friendly (conceptual) multidimensional
model. Such solutions have provided us with three
main advantages:
they have greatly facilitated our interaction
with FIL experts, and
they have provided us with a solid basis to
design a relational implementation of the Data
Warehouse, and
a user-friendly base to provide a graphical
interface to OLAP queries.
Notably, the conceptual models we developed are
independent of the specific trial, covering all trials of
FIL. The framework has been in use at FIL in the last
year, and the questionnaires we provided have shown
that users appreciate and exploit it, finding it very
useful. In particular:
Organizational users directly involved in the
management of clinical data (e.g., study
coordinators and drug vigilance staff) have
integrated the use of “pre-built” dashboards
(see Section 5) into their daily routines. On the
other hand, they require IT support when using
the graphical query builder.
Organizational users with less-standard
assignments (e.g., fundraising) have acquired
competencies in the use of the graphical query
builder provided by the framework and use
both it and the pre-built dashboards.
Operating officer dashboard has been revealed
to be a very useful tool for clinical users with
management roles, especially to monitor and
improve center performances.
As regards other clinical users, the framework
has been enabled only for a few of them for a
preliminary evaluation. Basically, clinical
users appreciated the framework but have
requested technical improvements (e.g.,
automatic reports sent by email) that we are
currently implementing. We plan to
implement such improvements and enable the
framework for all the clinical users in the next
year.
It is worth stressing that the work described in this
paper is not a standalone application. Even if in this
work we focused on a few BI tools (i.e., data
warehouse, visualization, dashboards), it is easy to
understand that clinical trial data management can
benefit from a broader range of BI techniques. In fact,
the work described in this paper integrates into a more
complex/extensive project aiming at extending EDCs
with an ad-hoc set of AI/BI methodologies to improve
not only data analysis, but also data and knowledge
acquisition. Indeed, our future work is twofold. On a
side, the next step of our work involves the definition
of ad-hoc data mining (machine and deep learning)
and predictive analytics techniques, mostly included
in the field of “in-silico” clinical trials (Harrer et al.,
2019; Z. Wang et al., 2022), to support practitioners
in the analysis of collected data with techniques for,
e.g., patient and site matching (see, e.g., (Gao et al.,
2020; Srinivasa et al., 2022)), data augmentation for
low-numerousness trials (e.g., (Pezoulas et al.,
2021)), patient status prediction (Berchialla et al.,
2022) and so on.
On the other side, we aim to develop techniques
supporting practitioners in the improvement of
collected datasets. With this in mind, we are currently
integrating the techniques usually adopted to support
the execution of Computer Interpretable Guidelines
(see, e.g., (Bottrighi & Terenziani, 2016; Piovesan et
al., 2015; Terenziani et al., 2002, 2008)) to support
both the design of trials and their data acquisition in
EDCs. Besides such techniques have been formerly
developed to support physicians in the treatment of
patients, they can be used to support practitioners in
standardizing data (e.g., providing a “standard”
representation for trials workflow), supporting data
collection (e.g., pointing out missing data) and
providing several other facilities such as automatic
constraint and conformance checking, also for
“complex” patients (see, e.g., (Piovesan et al., 2020)).
ACKNOWLEDGEMENTS
This work is partially supported by Fondazione
Italiana Linfomi.
Erica Raina is a PhD student enrolled in the
National PhD program in Artificial Intelligence,
XXXIX cycle, course on Health and life sciences,
organized by Università Campus Bio-Medico di
Roma.
REFERENCES
Berchialla, P., Lanera, C., Sciannameo, V., Gregori, D., &
Baldi, I. (2022). Prediction of treatment outcome in
clinical trials under a personalized medicine
perspective. Scientific Reports, 12(1), Article 1.
https://doi.org/10.1038/s41598-022-07801-4
Business Intelligence Enhancements to EDC for Clinical Trial Management
543

Bettio, C., Salsi, V., Orsini, M., Calanchi, E., Magnotta, L.,
Gagliardelli, L., Kinoshita, J., Bergamaschi, S., &
Tupler, R. (2021). The Italian National Registry for
FSHD: An enhanced data integration and an analytics
framework towards Smart Health Care and Precision
Medicine for a rare disease. Orphanet Journal of Rare
Diseases, 16(1), 470. https://doi.org/10.1186/s13023-
021-02100-z
Bose, A., & Das, S. (2012). Trial analytics—A tool for
clinical trial management. Acta Poloniae
Pharmaceutica, 69(3), 523–533.
Bottrighi, A., & Terenziani, P. (2016). META-GLARE: A
meta-system for defining your own computer
interpretable guideline system—Architecture and
acquisition. Artificial Intelligence in Medicine, 72, 22–
41. https://doi.org/10.1016/j.artmed.2016.07.002
Chelico, J. D., Wilcox, A. B., Vawdrey, D. K., &
Kuperman, G. J. (2017). Designing a Clinical Data
Warehouse Architecture to Support Quality
Improvement Initiatives. AMIA Annual Symposium
Proceedings, 2016, 381–390.
Farnum, M. A., Mohanty, L., Ashok, M., Konstant, P.,
Ciervo, J., Lobanov, V. S., & Agrafiotis, D. K. (2019).
A dimensional warehouse for integrating operational
data from clinical trials. Database: The Journal of
Biological Databases and Curation, 2019, baz039.
Gao, J., Xiao, C., Glass, L. M., & Sun, J. (2020).
COMPOSE: Cross-Modal Pseudo-Siamese Network
for Patient Trial Matching. Proceedings of the 26th
ACM SIGKDD International Conference on
Knowledge Discovery & Data Mining, 803–812.
https://doi.org/10.1145/3394486.3403123
Golfarelli, M. (2009). DFM as a Conceptual Model for Data
Warehouse. In J. Wang (Ed.), Encyclopedia of Data
Warehousing and Mining, Second Edition (4 Volumes)
(pp. 638–645). IGI Global. http://www.igi-
global.com/Bookstore/Chapter.aspx?TitleId=10888
Golfarelli, M., & Rizzi, S. (2021). Data Warehouse Design:
Modern principles and methodologies. McGraw-Hill.
Harrer, S., Shah, P., Antony, B., & Hu, J. (2019). Artificial
Intelligence for Clinical Trial Design. Trends in
Pharmacological Sciences, 40(8), 577–591.
https://doi.org/10.1016/j.tips.2019.05.005
ICD-11. (n.d.). Retrieved 27 October 2023, from
https://icd.who.int/en
Karami, M., Rahimi, A., & Shahmirzadi, A. H. (2017).
Clinical Data Warehouse: An Effective Tool to Create
Intelligence in Disease Management. The Health Care
Manager, 36(4), 380–384. https://doi.org/10.1097/
HCM.0000000000000113
Metabase | Business Intelligence, Dashboards, and Data
Visualization. (n.d.). Retrieved 24 January 2023, from
https://www.metabase.com
OpenClinica website. (n.d.). OpenClinica. Retrieved 26
October 2023, from https://www.openclinica.com/
Pezoulas, V. C., Grigoriadis, G. I., Gkois, G., Tachos, N. S.,
Smole, T., Bosnić, Z., Pičulin, M., Olivotto, I.,
Barlocco, F., Robnik-Šikonja, M., Jakovljevic, D. G.,
Goules, A., Tzioufas, A. G., & Fotiadis, D. I. (2021). A
computational pipeline for data augmentation towards
the improvement of disease classification and risk
stratification models: A case study in two clinical
domains. Computers in Biology and Medicine, 134,
104520.
https://doi.org/10.1016/j.compbiomed.2021.104520
Piovesan, L., Molino, G., & Terenziani, P. (2015).
Supporting Multi-Level User-Driven Detection of
Guideline Interactions. Proceedings of the
International Conference on Health Informatics
(HEALTHINF-2015), 413–422. https://doi.org/10.52
20/0005217404130422
Piovesan, L., Terenziani, P., & Theseider Dupré, D. (2020).
Conformance analysis for comorbid patients in Answer
Set Programming. Journal of Biomedical Informatics,
103, 103377. https://doi.org/10.1016/j.jbi.2020.103377
REDCap. (n.d.). Retrieved 12 August 2021, from
https://www.project-redcap.org/
Srinivasa, R. S., Qian, C., Theodorou, B., Spaeder, J., Xiao,
C., Glass, L., & Sun, J. (2022). Clinical trial site
matching with improved diversity using fair policy
learning (arXiv:2204.06501). arXiv. https://doi.org/
10.48550/arXiv.2204.06501
Terenziani, P., Carlini, C., & Montani, S. (2002). Towards
a comprehensive treatment of temporal constraints in
clinical guidelines. Proceedings Ninth International
Symposium on Temporal Representation and
Reasoning, 20–27. https://doi.org/10.1109/TIME.20
02.1027468
Terenziani, P., Montani, S., Bottrighi, A., Molino, G., &
Torchio, M. (2008). Applying artificial intelligence to
clinical guidelines: The GLARE approach. Studies in
Health Technology and Informatics, 139, 273–282.
Wang, Z., Gao, C., Glass, L. M., & Sun, J. (2022). Artificial
Intelligence for In Silico Clinical Trials: A Review.
https://doi.org/10.48550/ARXIV.2209.09023
World Health Organization. (2013). International
classification of diseases for oncology (ICD-O). World
Health Organization. https://apps.who.int/iris/handle/
10665/96612
Yang, E., Scheff, J. D., Shen, S. C., Farnum, M. A., Sefton,
J., Lobanov, V. S., & Agrafiotis, D. K. (2019). A late-
binding, distributed, NoSQL warehouse for integrating
patient data from clinical trials. Database: The Journal
of Biological Databases and Curation, 2019, baz032.
https://doi.org/10.1093/database/baz032
HEALTHINF 2024 - 17th International Conference on Health Informatics
544
