
Coreset Based Medical Image Anomaly Detection and Segmentation
Ciprian-Mihai Ceaus
,
escu
1
, Bogdan Alexe
1,2
and Riccardo Volpi
3,4
1
University of Bucharest, Romania
2
Gheorghe Mihoc-Caius Iacob Institute of Mathematical Statistics and Applied Mathematics of the Romanian Academy,
Romania
3
Quaesta AI, Cluj-Napoca, Romania
4
Transylvanian Institute of Neuroscience (TINS), Cluj-Napoca, Romania
Keywords:
Binary Classification of Medical Images, Anomaly Detection, Binary Segmentation of Medical Images,
PatchCore, Coreset.
Abstract:
We address the problem of binary classification of medical images employing an anomaly detection approach
that uses only normal images for training. We build our method on top of a state-of-the-art anomaly detection
method for visual inspection of industrial natural images, PatchCore, tailored to our tasks. We deal with the
distribution shift between natural and medical images either by fine-tuning a pre-trained encoder on a general
medical image dataset with ten classes or by training the encoder directly on a set of discriminative medical
tasks. We employ our method for binary classification and evaluate it on two datasets: lung cancer from CT
scan images and brain tumor from MRI images showing competitive results when compared to the baselines.
Conveniently, this approach is able to produce segmentation masks used for localizing the anomalous regions.
Additionally, we show how transformer encoders are up to the task allowing for improved F1 and AUC metrics
on the anomaly task, also producing a better segmentation.
1 INTRODUCTION
Robust and reliable medical image classification is
crucial for assisting doctors in taking accurate deci-
sions. For example, being able to spot early signs of a
brain tumor in a magnetic resonance imaging (MRI)
can save the life of a patient by administering the
needed treatment at the right time. Machine learning
can empower doctors to perform accurate quick deci-
sions under time constraints, as well as allow them to
perform a timely accurate screening of multiple pa-
tients, attempting to alleviate some of the pressure on
the healthcare system. The usual paradigm in medi-
cal image classification is to train a deep neural net-
work (Lakhani, 2017; Talo et al., 2019; Yang et al.,
2018; Lundervold and Lundervold, 2019) in a super-
vised way: the learner is exposed to training exam-
ples of both classes, normal and abnormal, with the
desired goal of capturing patterns that can distinguish
between them. However, the field of medical imaging
is facing the severe problem of scarcity of abnormal
data for many diseases (El Jiani et al., 2022). In these
cases, the particular datasets are heavily imbalanced,
with the number of normal training examples (com-
ing from healthy patients) overwhelming the number
of abnormal examples (coming from ill patients). A
natural way to address the scarcity in the abnormal
data is to rely exclusively on normal data at train-
ing time and then identifying the abnormal patterns
as the ones that deviate from the normal distribu-
tion learned. In this paper we employ the method
PatchCore (Roth et al., 2022), originally proposed in
anomaly detection for visual inspection of industrial
image data (Bergmann et al., 2021; Bergmann et al.,
2019), and we explore its potential on medical im-
ages, which follow a completely different distribution
and are usually more subject to domain shift. Accord-
ingly, we explore several strategies to obtain good
performances on our problem. Our framework is gen-
eral, in the sense that it can be used for binary classifi-
cation of medical images for different tasks based on
the fact that the neural network used in our pipeline
is familiar with respect to distribution of data, com-
puted tomography (CT) scan images or MRI images
of specific organs. The authors of (Xie and Rich-
mond, 2019) show that a pre-trained model on Ima-
geNet (Deng et al., 2009a) which is then fine-tuned
on a medical image dataset is a standard approach to
Ceau¸sescu, C., Alexe, B. and Volpi, R.
Coreset Based Medical Image Anomaly Detection and Segmentation.
DOI: 10.5220/0012395900003660
Paper published under CC license (CC BY-NC-ND 4.0)
In Proceedings of the 19th International Joint Conference on Computer Vision, Imaging and Computer Graphics Theory and Applications (VISIGRAPP 2024) - Volume 4: VISAPP, pages
549-558
ISBN: 978-989-758-679-8; ISSN: 2184-4321
Proceedings Copyright © 2024 by SCITEPRESS – Science and Technology Publications, Lda.
549

mitigate the constraints of limited-size medical im-
age datasets. In our work, we employ a ResNet50 ar-
chitecture (He et al., 2015), pre-trained on ImageNet
(Deng et al., 2009b) grayscale dataset and fine-tuned
to the Medical Segmentation Decathlon (Antonelli
et al., 2022; Simpson et al., 2019) dataset. The Med-
ical Segmentation Decathlon dataset contains a very
diverse range of medical images types like MRI mag-
netic resonance imaging, mp-MRI multiparametric-
magnetic and CT computed tomography for ten dif-
ferent classes. This makes it suitable for using it to
train our ResNet50 architecture to shift the distribu-
tion of features from natural images (learned from
ImageNet) to medical images (learned from Medi-
cal Segmentation Decathlon). Recently, Visual Trans-
formers gained success in the medical domain, they
have been employed both in classification and regres-
sion tasks (Yang et al., 2023), and in self-supervised
approaches (Xie et al., 2023) employing a MAE
autoencoder, combining representation learning and
clustering. We will also explore the expressivity of
a transformer backbone in comparison with our con-
volutional baseline. We use the adapted PatchCore
method in two tasks, for classifying CT scan im-
ages with lung from the IQ-OTH/NCCD Lung cancer
dataset (F. Al-Yasriy et al., 2020; Al-Huseiny et al.,
2021; Hamdalla and Muayed, 2023) and MRI images
with brain from the REMBRANDT dataset (K. et al.,
2013; L. et al., 2019). In summary we make the fol-
lowing contributions: (i) we explore the potential of
PatchCore on the binary image classification of medi-
cal images for different tasks, by employing different
strategies to adapt the backbones to the medical do-
main; (ii) we provide extensive experiments on two
datasets containing CT images with lung and MRI
images with brain validating our approach; (iii) we
compare the performances of transformer vs convolu-
tional encoders.
2 DATASETS
Medical professionals need to combine the informa-
tion from several data sources, to both enhance their
diagnostic accuracy and make more informed deci-
sions. Analogously, to train and evaluate our pro-
posed method we use data from multiple heteroge-
neous datasets:
1. Medical Segmentation Decathlon (Antonelli
et al., 2022; Simpson et al., 2019): dataset of
several anatomies of interest, collected using
modalities from different institutions. All images
passed through a reviewing process according to
certain board policies to ensure their quality. The
authors uniformed the data by saving them in the
same format, Neuroimaging Informatics Tech-
nology Initiative - NIfTI. The dataset contains
ten anatomies (brain, heart, liver, hippocampus,
prostate, lung, pancreas, hepatic vessel, spleen
and colon), in total 2.633 three-dimensional
images, collected using two modalities (Mag-
netic Resonance Imaging MRI and Computed
Tomography CT).
2. IQ-OTH/NCCD Lung cancer (F. Al-Yasriy et al.,
2020; Al-Huseiny et al., 2021; Hamdalla and
Muayed, 2023): dataset of lung cancer images. It
includes data of patients diagnosed with lung can-
cer and as well as healthy patients. The dataset
contains 1097 images representing CT scan slices
of 110 patients grouped into three classes: normal
(55 cases), benign (15 cases), and malignant (40
cases).
3. REMBRANDT (K. et al., 2013; L. et al.,
2019): dataset of pre-surgical magnetic res-
onance (MR) multi-sequence images collected
from 130 patients (created to augment the larger
REMBRANDT project). To enhance the ex-
isting dataset, the authors of (Sayah et al.,
2022), performed volumetric segmentation of de-
tect subregions of the brain images, providing
a dataset of segmentation labels for 65 patients
of the REMBRANDT brain cancer MRI image
collection. The dataset contains MRI images
taken from different modalities, T1-weighted,
T2-weighted, post-contrast T1-weighted, and T2
Fluid-Attenuated Inversion Recovery, each of
them having different contrast and brightness lev-
els.
4. MedMNIST (Yang et al., 2021; Yang et al.,
2023): dataset of 12 pre-processed 2D and 6 pre-
processed 3D datasets from a variety of medical
imaging modalities, such as X-Ray, OCT, Ultra-
sound, CT, Electron Microscope. These datasets
are designed for a range of classification tasks
such as binary/multi-class, ordinal regression and
multi-label.
3 RELATED WORK
Anomaly detection is defined as the task of recogniz-
ing and localizing abnormal patterns which deviate
from the normal data. It has been applied success-
fully in tasks related to anomaly detection in natural
images such as video anomaly detection (Lu et al.,
2013; Zhao et al., 2011; Ionescu et al., 2019), pixel-
level anomaly detection in complex driving scenes
VISAPP 2024 - 19th International Conference on Computer Vision Theory and Applications
550

(Di Biase et al., 2021), image-level anomaly detec-
tion for visual inspection of industrial data (Roth
et al., 2022; Liu et al., 2023). The task seems
harder to solve in medical images (Shvetsova et al.,
2021), as here the pattern anomalies seems to resem-
ble the normal data, which is not the case in natu-
ral images. Recent related studies (Shvetsova et al.,
2021; Siddalingappa and Kanagaraj, 2021; Tschuch-
nig and Gadermayr, 2022; Abunajm et al., 2023)
showed the effectiveness of classical autoencoders,
convolutional neural networks, and generative adver-
sarial networks in analysing complex medical images.
In anomaly detection, the fundamental role of an en-
coder is to map the input in a space (usually assumed
Euclidean) where we can measure the content dis-
similarity between the input and the output images
(Baur et al., 2019). Large differences resulting in
high reconstruction error localize the anomalous re-
gions. Other methods improve on these paradigms
by considering also non Euclidean distances in the la-
tent space (Albu et al., 2020). Additionally, we can
identify two major directions that emerged lately in
the anomaly detection research: (1) using a back-
bone to encode features and detect anomalous regions
based on large distances (Roth et al., 2022); (2) using
a teacher-student distillation framework (Bergmann
et al., 2020; Rudolph et al., 2023; Batzner et al., 2023)
where the student networks are trained on normal im-
ages to imitate the output of the teacher. The intuition
is that the behaviour of a student will be different on
anomalous images, that have not been seen as training
time. In this paper we focus on the first direction ex-
ploring the flexibility of a single pretrained backbone
on different medical domains.
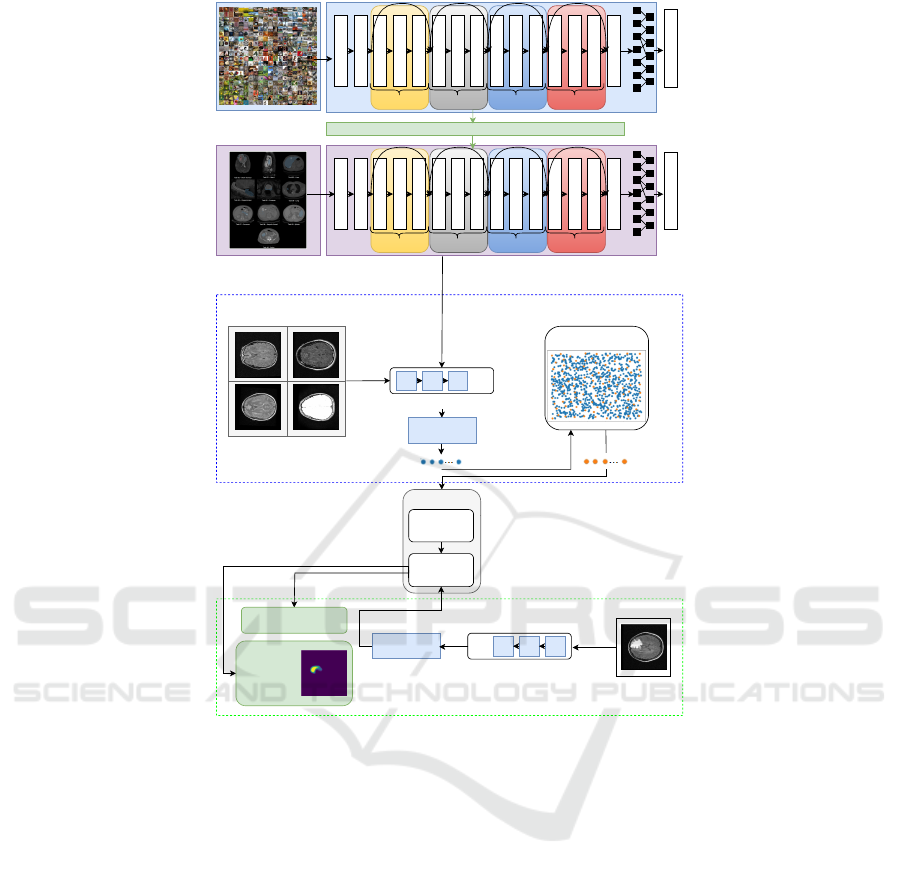
4 METHOD
4.1 PatchCore
We build our method on top of PatchCore (Roth et al.,
2022), an anomaly detection method used for visual
inspection of industrial image data (Bergmann et al.,
2021; Bergmann et al., 2019). The main challenge
solved by the authors of (Roth et al., 2022) is to fit
a model using only normal example images (with-
out anomalies) and to create systems that work well
on several different object classes with minimal re-
training needed. PatchCore uses a maximally repre-
sentative memory bank of patch-features that are ex-
tracted from the normal examples. The method con-
tains three main components: (1) extraction and ag-
gregation of features into a memory bank; (2) reduc-
tion of memory bank; (3) detection and localization
of the possible anomalies. In (1), the method uses
a network φ that is pre-trained on ImageNet (Deng
et al., 2009b) dataset to extract the patch-features.
For classification of medical images in the form of
MRIs or CTs, the data distribution follows a com-
pletely different distribution with respect to the dis-
tribution of data in ImageNet. Consequently, our net-
work φ should be pre-trained accordingly. The au-
thors of (Xie and Richmond, 2019) show that a pre-
trained model on ImageNet and fine-tuned on a medi-
cal dataset is a standard approach to mitigate the con-
straints of limited-size medical datasets. Our encoder
is represented by a ResNet50 architecture (He et al.,
2015), a 50-layer convolutional neural network, pre-
trained on ImageNet (Deng et al., 2009b) grayscale
dataset and fine-tuned on Medical Segmentation De-
cathlon (Antonelli et al., 2022; Simpson et al., 2019)
dataset (process presented on top of the Figure 1). Ad-
ditionally we will investigate also encoders pretrained
directly on medical classification tasks, and we will
explore the impact of different architectures as Vi-
sual Transformers in the creation of the patches. In
(2), Coreset selection algorithm is used to compute a
reduced memory bank of patch-features, maintaining
the same performance, while decreasing the inference
time and the required storage. During this process,
to decrease the selection time, the dimensionality of
the features is reduced through random linear projec-
tions. The Coreset method uses a parameter n that de-
notes the percentage of features subsampled from the
original memory bank. For example, n = 1% means
that the memory bank is reduced 100× times. In our
experiments, we analyze the impact of different val-
ues of n on the performance and inference time of the
method. An overview of the pipeline is depicted in
Figure 1.
5 EXPERIMENTAL EVALUATION
5.1 Evaluation Measures
Being anomaly detection an imbalanced problem by
definition, we will use the Area Under the Receiver
Operator Curve (AUROC) to measure the perfor-
mance. Analogously, we compute F1 score (balances
precision and recall to evaluate the performance), Pre-
cision (accuracy of positive predictions), Recall (abil-
ity to identify positive instances), Specificity (ability
to identify negative instances), and Accuracy (overall
correctness in classification). Metrics will either be
evaluated for the instance classification problem (cor-
rectness in the classification of an image as being nor-
mal or abnormal), and pixel-wise (correctness in the
Coreset Based Medical Image Anomaly Detection and Segmentation
551
ImageNet (grayscale)
1000 classes
1000
Output
Medical Segmentation
Decathlon
10 classes
10
Output
Transfer learning
1x1 Conv, 2048
3x3 Conv, 64
7x7 Conv, 64, stride 2
3x3 Max Pool, stride 2
1x1 Conv, 128
3x3 Conv, 128
1x1 Conv, 512
1x1 Conv, 256
3x3 Conv, 256
1x1 Conv, 1024
1x1 Conv, 512
3x3 Conv, 512
Average Pooling
x 3 x 4 x 6 x 3
1x1 Conv, 64
1x1 Conv, 256
1x1 Conv, 2048
3x3 Conv, 64
7x7 Conv, 64, stride 2
3x3 Max Pool, stride 2
1x1 Conv, 128
3x3 Conv, 128
1x1 Conv, 512
1x1 Conv, 256
3x3 Conv, 256
1x1 Conv, 1024
1x1 Conv, 512
3x3 Conv, 512
Average Pooling
x 3 x 4 x 6 x 3
1x1 Conv, 64
1x1 Conv, 256
Stage 1
Stage 1
Stage 2 Stage 3 Stage 4
Stage 2 Stage 3 Stage 4
Pre-trained
weights
Fine-Tuning
Coreset Subsampling
Nominal samples
...
Pretrained encoder
Memory Bank
M
Nearest
Neighbor
Search
PatchCore
Test sample
Anomaly
Segmentation
Training
Testing
...
Pretrained encoder
locally aware
patch features
locally aware
patch features
Anomaly score
Figure 1: Pipeline overview.
classification of a pixel as being normal or abnormal)
giving a measure of the segmentation quality.
5.2 Pre-Trained Encoder
As initial baseline, we leverage a ResNet50 architec-
ture, initially pre-trained on the ImageNet grayscale
dataset and subsequently fine-tuned on the Medical
Segmentation Decathlon dataset, conceptually simi-
lar to (Xie and Richmond, 2019). To achieve this,
we start by loading the pre-trained ResNet50 archi-
tecture on the ImageNet grayscale dataset. We replace
the output layer that was originally designed for 1000
classes (of ImageNet), with a new output layer for 10
classes (of Medical Segmentation Decathlon). The
model is fine-tuned in an end-to-end procedure on
the Medical Segmentation Decathlon dataset, using
the initial weights of the pre-trained ResNet50 model.
We train with learning rates (0.01, 0.001), both with a
decay factor of 10 every 20 epochs, keeping all the
other hyperparameters similar to the original training
of the ResNet50. We obtain the best performance af-
ter 125 epochs, using a learning rate of 0.01, when
training all parameters from all layers of the network.
This achieves an accuracy of 96.70% in classifying
the 10 classes, much higher than the 80.65% of the
initial ResNet50 architecture pre-trained on the Im-
ageNet grayscale dataset and fine-tuned in the last
classification layer. We call this fine-tuned network
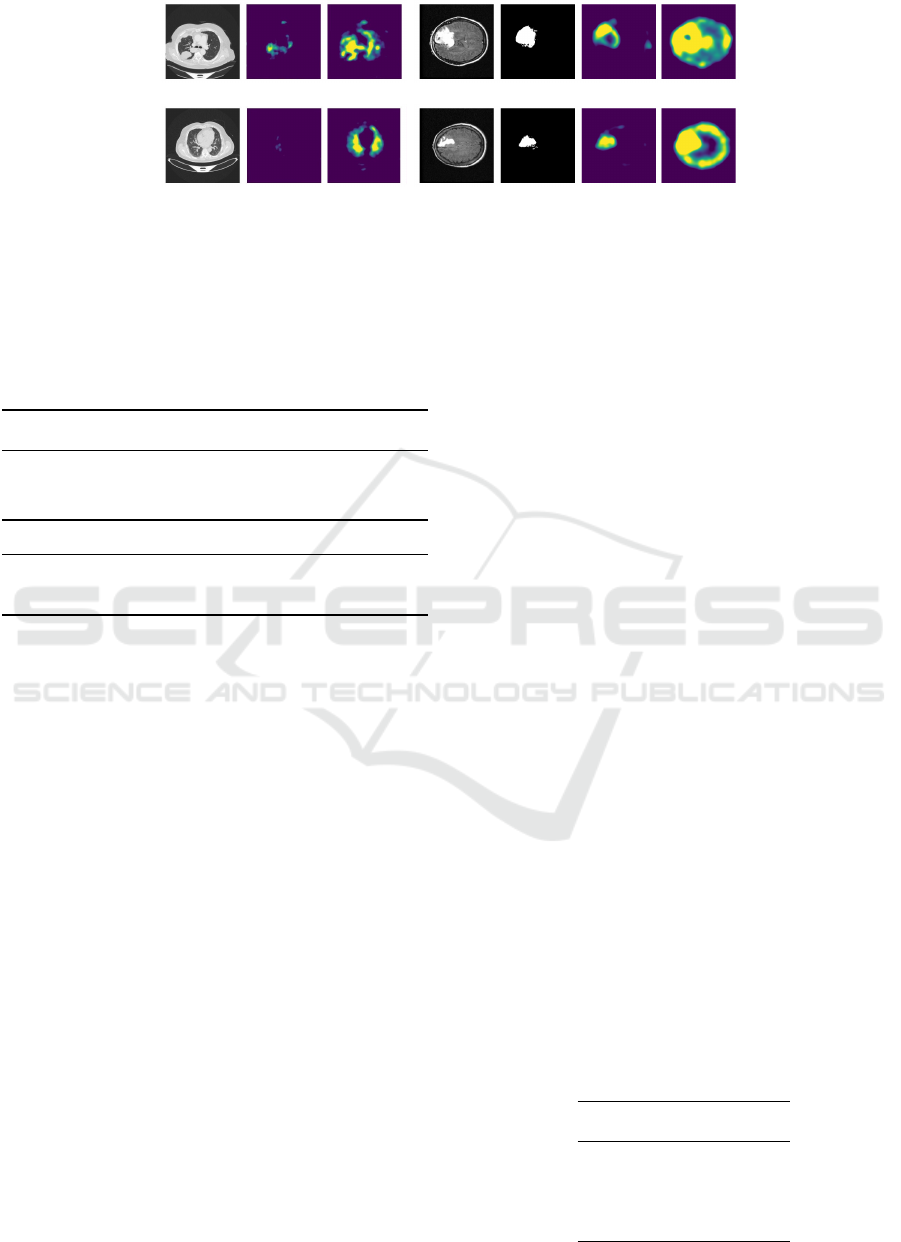
RN50msd. In Figure 2 we visualize the differences
between the output of the two encoders. We show the
anomaly heat maps computed for two samples from
the IQ-OTH/NCCD lung cancer dataset (columns a-
c) and two samples from the REMBRANDT brain
tumor dataset (columns d-g) using the ResNet50 pre-
trained on ImageNet grayscale and the ResNet50 fine-
tuned in end-to-end manner on Medical Segmentation
Decathlon.
VISAPP 2024 - 19th International Conference on Computer Vision Theory and Applications
552
(a)
(b)
(c)
(d)
(e)
(f)
(g)
Figure 2: Qualitative results of the pre-trained encoders: (a) two CT abnormal images from the lung cancer dataset; (b)
corresponding output of our ResNet50 model fine-tuned on Medical Segmentation Decathlon dataset; (c) corresponding
output of the initial ResNet50 model pre-trained on ImageNet grayscale; (d) two MRI abnormal images from the brain tumor
dataset; (e) corresponding ground-truth segmentations masks; (f) corresponding output of our ResNet50 model fine-tuned on
Medical Segmentation Decathlon dataset; (g) corresponding output of the initial ResNet50 model pre-trained on ImageNet
grayscale.
Table 1: Quantitative results for the task of lung cancer clas-
sification, for RN50msd (using different values for the pa-
rameter n) and comparing with (Abunajm et al., 2023).
n% Enc AUC
x
F1
x
Prec
x
Rec
x
Spec
x
Acc
x
1% our 96.54 97.80 98.85 96.78 89.80 96.24
10% our 96.69 97.63 99.01 96.30 92.88 95.97
25% our 96.69 97.63 99.17 96.14 94.90 95.97
- CNN - 94.16 91.66 96.80 94.09 95.18
5.3 Experiments on the Lung Cancer
Dataset
We evaluate our method on the IQ-OTH/NCCD lung
cancer dataset using the protocol of (Abunajm et al.,
2023).
Evaluation Protocol. We split the entire set into three
sets, retaining 70% of all data in the training set, 15%
in validation set, and 15% in testing set, with all im-
ages being resized to 512 × 512 pixels. We compare
our model to the approach implemented by (Abunajm
et al., 2023). In order to make a fair comparison to
the work of (Abunajm et al., 2023), we implemented
the CNN architecture presented by them, and trained
it and tested it in our scenario, using our split. The ad-
vantage of using PatchCore as a building block in our
method is that the training set can be formed exclu-
sively of normal data, and only the validation and test-
ing set is made of normal and abnormal data. Conse-
quently, our proposed method uses less data for train-
ing than the previous methods.
Reducing the Memory Bank. The Coreset proce-
dure from PatchCore method uses a parameter n used
to reduce the memory bank. In Table 1, we compare
the performances of our method using different val-
ues for n.
Optimal Threshold for Classification. We consider
the optimal threshold to classify an image as being
normal or abnormal as the threshold that maximizes
the F1-score.
Performance of Our Method. We consider our best
model the one that achieves the best performance on
the validation set. In our experiments, this corre-
sponds to the choice of hyperparameter n = 25%. For
completeness, we show in Table 1 the performance of
our model on the test set also for values n = 1% and
n = 10%.
Comparison to (Abunajm et al., 2023). We com-
pare our model with n = 25% (row 3) to the CNN-
architecture of (Abunajm et al., 2023) (row 4) in Ta-
ble 1. The experimental results from Table 1 show our
method to outperform the method of (Abunajm et al.,
2023) in terms of F1-score, precision, specificity and
accuracy while in terms of recall our method is less
than 1% off. It is worth noticing that our method is
not requiring abnormal labels, while (Abunajm et al.,
2023) is fully supervised.
Inference Times. An important aspect is the infer-
ence time of our method applied on images of the IQ-
OTH/NCCD lung cancer dataset. All experiments in
this paper were conducted on one Nvidia RTX 3090-
24GB and Intel Core i9-10940X CPU-3.30GHz pro-
cessor. We report details in Table 2, the inference
times is increasing with the value of n, the parame-
ter that denotes the percentage of features subsampled
from the original memory bank of features.
Table 2: Inference times for RN50msd applied on the task
of lung cancer classification.
n% Sec/img
1% 0.1443
10% 0.1689
25% 0.2233
Coreset Based Medical Image Anomaly Detection and Segmentation
553
(a)
(b)
(c)
(d)
(e)
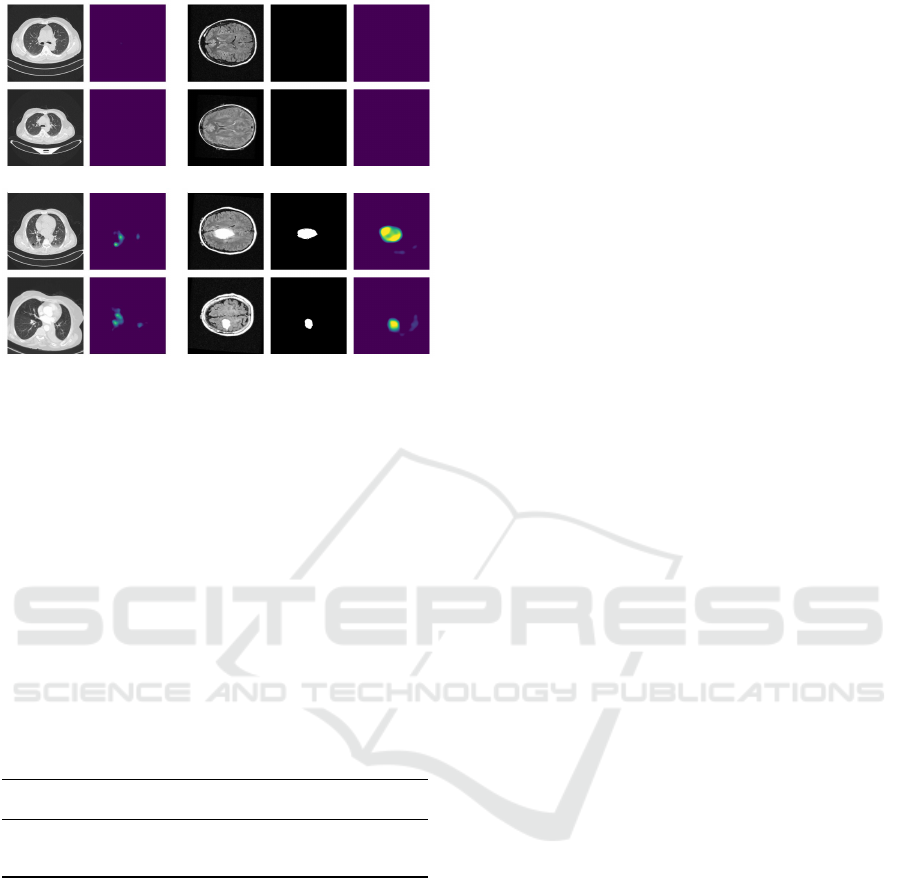
Figure 3: Qualitative results by using RN50msd encoder.
(a): input images from the lung cancer dataset: normal im-
ages (top) and abnormal images (bottom); (b) output of our
method in the form of segmentation maps; (c) input images
from the brain tumor dataset: normal images (top) and ab-
normal images (bottom); (d) ground-truth binary masks; (e)
output of our method in the form of segmentation maps.
K-fold Cross Validation. To better estimate the
overall performance of our model in different sce-
narios, we employ K Fold Cross-Validation (Kohavi,
2001) technique, by splitting the data randomly in
K=5 folds. In Table 3, we can observe robust con-
sistency of K Fold Cross Validation by obtaining ho-
mogeneous results across all the 5 folds.
Table 3: Performance of RN50msd applied on the task of
lung cancer classification (using K Fold Cross-Validation,
with K = 5).
n% AUC
x
F1
x
Prec
x
Rec
x
Spec
x
Acc
x
25% 96.77
±0.22
96.25
±1.20
96.15
±1.73
96.37
±1.82
94.38
±1.25
95.55
±1.12
Qualitative Results. Figure 3 illustrates in columns
(a) and (b) the behaviour of our method for two nor-
mal and two abnormal samples from the lung can-
cer dataset. Our method is able to correctly classify
the images as being normal or abnormal using the
anomaly scores at image-level which are correlated to
the pixel-wise scores visualized as segmentation maps
in Figure 3.
5.4 Experiments on the Brain Tumor
Dataset
The enhanced REMBRANDT dataset (Sayah et al.,
2022) contains for each of the 65 patients a number
of 155 slices (normal or abnormal) of size 240 × 240
pixels.
Evaluation Protocol. We split the initial dataset
into two subsets: a training set containing data for
55 patients and a testing set containing data for 10
patients. Following our preliminary data analysis,
on average, if a patient has a tumor, it becomes
apparent starting at slice 50, gradually increasing and
then decreasing, ceasing to be discernible starting at
slice 113. Additionally, the first and the last slices
contain data that are not aligned and the differences
in the skull structure of each patient might mislead
PatchCore to classify the test features as false positive
anomalies. For these reasons, we aim to train our
model only on the aligned images that ideally do not
contain information of the skull structure. In order
to achieve this, we take a subset of 30 patients and
create a dataset consisting of two distinct classes:
inlier slices and outlier slices. We form the outlier
class of images by selecting the initial 31 slices and
the final 31 slices from each patient. The remaining
slices, from slice 32 to slice 124, make up the inlier
class of images. We train a binary classifier, based on
a Convolutional Neural Network (LeCun et al., 2015;
Schmidhuber, 2015), designed to classify outlier
slices and inlier slices. To ensure a robust training
of the model, we implement both a learning rate
scheduler and early stopping procedures. After 110
epochs, the model demonstrated good performances,
achieving accuracies of 97.64% on the training set
(70% of the data), 97.55% on the validation set (15%
of the data), and 96.83% on the test set (15% of the
data). The whole pipeline is presented in Figure
4. Furthermore, after creating a robust inlier vs
outlier classifier, we extract all the slices from the 55
patients in the training set and we select from them
only the inlier normal images to construct the training
set for our method. At inference time, we take all
the slices, whether they are normal or abnormal,
from the testing set of 10 patients, we pass them
through the binary classifier. We select only the inlier
images to generate the testing set for our method.
After data preparation, we employ the same series of
experiments as per the lung cancer dataset, by using
the encoder fine-tuned on the Medical Segmentation
decathlon dataset.
Performance of Our Method. Similarly as before,
with the lung cancer dataset, for n = 25% we obtain
the best performances. For completeness, we show in
Table 4 the performance of the model on the test set
also for values n = 1% and n = 10%. Additionally,
give that for this dataset we have ground-truth seg-
mentation masks, we compute the full-pixel AUROC
(76.3%) and anomaly-pixel AUROC (75.9%).
VISAPP 2024 - 19th International Conference on Computer Vision Theory and Applications
554
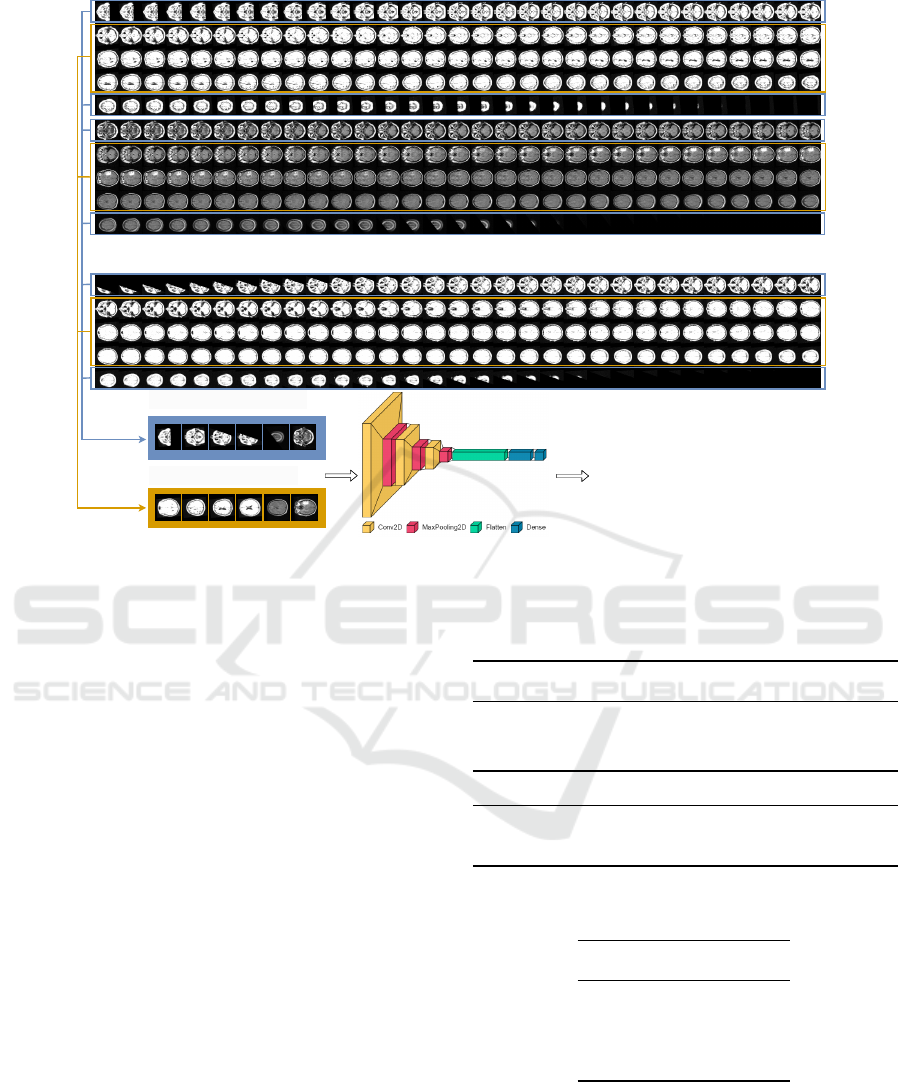
...
Probability
OUTLIER
or INLIER
OUTLIER CLASS
INLIER CLASS
Figure 4: Inlier vs outlier classifier.
Comparison to Other Baselines. To the best of
our knowledge, there are no existing benchmarks for
this particular dataset. To compare the performance
of our method, we employ the architecture presented
by (Abunajm et al., 2023) in their work, trained and
tested it on our data. Table 4 outlines the comparison
between the results of the two methods. Our method
reaches a higher performance in terms of Precision
and Recall, thus having a higher F1- score but is un-
able to detect better the anomalous cases thus having a
smaller specificity and accuracy performance wrt the
considered baseline.
Inference Times. Table 5 lists the inference time of
our method applied on the enhanced REMBRANDT
dataset. As the image resolutions are smaller, these
times are smaller when compared to the ones from
the lung cancer dataset.
Different MRI Modalities and K-fold Cross Vali-
dation. MRI images can be obtained using different
modalities, each of them having different contrast and
brightness levels. Table 6 outlines a comparison of the
outcomes between the results on two different modal-
ities in K-fold cross validation setup with K = 5. We
can observe that the specificity for the T2 weighted
modality is significantly lower than for the T2 Fluid-
Attenuated Inversion Recovery modality, while the
other metrics demonstrate similar performances. Ac-
cording to our analysis, this occurs because certain
Table 4: RN50msd on the task of brain tumor classification,
using different values for the parameter n, on the FLAIR
MRI modality.
n% Enc AUC
x
F1
x
Prec
x
Rec
x
Spec
x
Acc
x
1% our 93.49 94.65 99.40 90.33 85.00 90.14
10% our 98.42 97.98 99.59 96.41 89.00 96.16
25% our 98.20 98.05 99.78 96.38 94.00 96.30
- CNN - 93.76 95.36 92.22 98.15 96.42
Table 5: Inference times for RN50msd applied on the task
of brain tumor classification.
n% Sec/img
1% 0.0265
10% 0.0283
25% 0.0329
MRI modalities contain more comprehensive infor-
mation regarding brain tumors compared to others.
Qualitative Results. Figure 3 illustrates the be-
haviour of our method in columns (c) - (e) for two
normal and two abnormal samples from the brain tu-
mor dataset. Our method is able to correctly clas-
Coreset Based Medical Image Anomaly Detection and Segmentation
555

Table 6: RN50msd applied on the task of brain tumor clas-
sification, using K Fold Cross-Validation, with k = 5, on the
T2 and FLAIR MRI modalities.
n% AUC
x
F1
x
Prec
x
Rec
x
Spec
x
Acc
x
25%
T2
96.09
±0.75
95.83
±0.80
96.52
±0.08
95.17
±1.59
85.80
±0.45
93.35
±1.23
25%
FLAIR
98.06
±0.48
95.96
±0.99
98.93
±0.26
93.19
±2.08
95.80
±1.10
93.70
±1.48
sify the images as being normal or abnormal using
the anomaly scores at image-level which are corre-
lated to the pixel-wise scores visualized as segmen-
tation maps in Figure 3. In addition, we also show
the ground-truth binary segmentation masks localiz-
ing the anomalous regions.
5.5 Visual Transformer Backbone
We present additional experiments comparing the per-
formances of the ResNet50 encoder with a Visual
Transformer (Dosovitskiy et al., 2021) encoder. In
particular, we use the MedViT transformer (Man-
zari et al., 2023) which is initially pre-trained on the
MedMNIST dataset. For a proper comparison be-
tween the two encoders, we also trained a ResNet50
architecture on the MedMNIST dataset. When us-
ing the two encoders in our pipeline we take features
at specific network level, for example stages 2 and
3 for both architectures. Both models were trained
with input size 224 × 224, and the same hyperparam-
eters (learning rate, number of epochs, optimizer).
The MedViT model was trained using the same hy-
perparameters from the original paper. We compare
four encoders: (1) ResNet50 trained on MedMNIST
(RN50
MedMN
); (2) ResNet50 trained on MedMNIST
and fine-tuned on Medical Segmentation Decathlon
(RN50
MSDec
); (3) the original MedViT trained on
MedMNIST (MedViT
MedMN
); (4) MedViT trained on
MedMNIST and fine-tuned on Medical Segmentation
Decathlon (MedViT
MSDec
). Table 7 shows the com-
parison of these four encoders when included in our
method on the two datasets: the IQ-OTH/NCCD lung
cancer dataset (first four rows) and REMBRANDT
brain tumor dataset (last four rows). Overall, our
method equipped with features from the ResNet50 en-
coder trained on MedMNIST and fine-tuned on Med-
ical Segmentation Decathlon performs slightly bet-
ter on both datasets in terms of precision and speci-
ficity. On the other hand, on F1 score and AUC, typ-
ically employed for imbalanced classification tasks,
our method equipped with features from the Med-
ViT encoder achieves better results, also exhibiting
large gains wrt recall. Different variants of the Med-
Table 7: Comparison of our method applied on the task of
lung cancer (first four rows) and brain tumor classification
(last four rows), using different encoders as feature extrac-
tors, and n = 25%.
Enc AUC
x
F1
x
Prec
x
Rec
x
Spec
x
Acc
x
RN50
MedMN
97.56 97.72 98.69 96.78 91.84 96.11
RN50
MSDec
97.31 96.78 99.16 94.52 94.90 94.58
MedViT
MedMN
98.30 98.30 98.70 97.91 91.84 97.08
MedViT
MSDec
98.30 98.46 98.86 98.07 92.86 97.36
RN50
MedMN
98.33 96.30 99.88 92.97 97.00 93.11
RN50
MSDec
98.69 95.22 99.98 90.87 99.98 91.19
MedViT
MedMN
98.85 98.59 99.81 97.39 95.00 97.31
MedViT
MSDec
97.34 97.87 99.92 95.91 98.00 95.98
ViT encoder perform better on the two dataset, with
the MedViT encoder trained on MedMNIST and fine-
tuned on Medical Segmentation Decathlon perform-
ing better on the lung cancer dataset while the orig-
inal MedViT trained on MedMNIST performs bet-
ter on the brain tumor dataset. For the Brain tumor
dataset, we can also compare the segmentation masks
obtained by our method with the ground truth, obtain-
ing 78.20 AUC for RN50
MSDec
and 79.39 AUC for
MedViT
MedMN
. This shows how MedViT is addition-
ally allowing for an improved anomaly segmentation.
6 CONCLUSIONS AND FUTURE
WORK
In this paper we addressed the problem of binary clas-
sification of medical images employing an anomaly
detection approach that uses only normal images for
training. We employ different strategies to adapt
the encoder features to the medical domain, using a
ResNet50 model pre-trained on ImageNet grayscale
and fine-tuned on Medical Segmentation Decathlon
achieves higher accuracy than the initial pre-trained
model. We find out that MedViT is also very effective
as encoder for Patchcore, achieving a better F1 and
AUC score overall with respect to ResNet50.
Both Brain MRI and Lung CT data are originally
3D in nature, so analyzing 3D volumes instead of 2D
images holds the promise of better capturing the cor-
relations in data and providing a more reliable feature
extraction. Explore the tridimensional spatial locality
will be object of future work.
VISAPP 2024 - 19th International Conference on Computer Vision Theory and Applications
556

ACKNOWLEDGMENT
We thank professor Denis En
˘
achescu and Luigi
Malag
`
o for their useful advices.
REFERENCES
Abunajm, S., Elsayed, N., ElSayed, Z., and Ozer, M.
(2023). Deep learning approach for early stage lung
cancer detection.
Al-Huseiny, M., Mohsen, F., Khalil, E., Hassan, Z., Fadil,
H., and F. Al-Yasriy, H. (2021). Evaluation of svm
performance in the detection of lung cancer in marked
ct scan dataset. Indonesian Journal of Electrical En-
gineering and Computer Science, 21.
Albu, A.-I., Enescu, A., and Malag
`
o, L. (2020). Improved
slice-wise tumour detection in brain mris by com-
puting dissimilarities between latent representations.
arXiv preprint arXiv:2007.12528.
Antonelli, M., Reinke, A., Bakas, S., Farahani, K., Kopp-
Schneider, A., Landman, B. A., Litjens, G., Menze,
B., Ronneberger, O., Summers, R. M., van Ginneken,
B., Bilello, M., Bilic, P., Christ, P. F., Do, R. K. G.,
Gollub, M. J., Heckers, S. H., Huisman, H., Jarnagin,
W. R., McHugo, M. K., Napel, S., Pernicka, J. S. G.,
Rhode, K., Tobon-Gomez, C., Vorontsov, E., Meakin,
J. A., Ourselin, S., Wiesenfarth, M., Arbel
´
aez, P., Bae,
B., Chen, S., Daza, L., Feng, J., He, B., Isensee, F., Ji,
Y., Jia, F., Kim, I., Maier-Hein, K., Merhof, D., Pai,
A., Park, B., Perslev, M., Rezaiifar, R., Rippel, O.,
Sarasua, I., Shen, W., Son, J., Wachinger, C., Wang,
L., Wang, Y., Xia, Y., Xu, D., Xu, Z., Zheng, Y., Simp-
son, A. L., Maier-Hein, L., and Cardoso, M. J. (2022).
The medical segmentation decathlon. Nature Commu-
nications, 13(1).
Batzner, K., Heckler, L., and K
¨
onig, R. (2023). Efficientad:
Accurate visual anomaly detection at millisecond-
level latencies.
Baur, C., Wiestler, B., Albarqouni, S., and Navab, N.
(2019). Deep autoencoding models for unsupervised
anomaly segmentation in brain mr images. In Crimi,
A., Bakas, S., Kuijf, H., Keyvan, F., Reyes, M., and
van Walsum, T., editors, Brainlesion: Glioma, Mul-
tiple Sclerosis, Stroke and Traumatic Brain Injuries,
pages 161–169, Cham. Springer International Pub-
lishing.
Bergmann, P., Batzner, K., Fauser, M., Sattlegger, D., and
Steger, C. (2021). The mvtec anomaly detection
dataset: A comprehensive real-world dataset for un-
supervised anomaly detection. International Journal
of Computer Vision, 129.
Bergmann, P., Fauser, M., Sattlegger, D., and Steger, C.
(2019). Mvtec ad — a comprehensive real-world
dataset for unsupervised anomaly detection. In 2019
IEEE/CVF Conference on Computer Vision and Pat-
tern Recognition (CVPR), pages 9584–9592.
Bergmann, P., Fauser, M., Sattlegger, D., and Steger,
C. (2020). Uninformed students: Student-teacher
anomaly detection with discriminative latent embed-
dings. In IEEE/CVF Conference on Computer Vision
and Pattern Recognition (CVPR).
Deng, J., Dong, W., Socher, R., Li, L.-J., Li, K., and Fei-Fei,
L. (2009a). Imagenet: A large-scale hierarchical im-
age database. In 2009 IEEE Conference on Computer
Vision and Pattern Recognition, pages 248–255.
Deng, J., Dong, W., Socher, R., Li, L.-J., Li, K., and Fei-Fei,
L. (2009b). Imagenet: A large-scale hierarchical im-
age database. In 2009 IEEE Conference on Computer
Vision and Pattern Recognition, pages 248–255.
Di Biase, G., Blum, H., Siegwart, R., and Cadena, C.
(2021). Pixel-wise anomaly detection in complex
driving scenes. In Proceedings of the IEEE/CVF Con-
ference on Computer Vision and Pattern Recognition
(CVPR), pages 16918–16927.
Dosovitskiy, A., Beyer, L., Kolesnikov, A., Weissenborn,
D., Zhai, X., Unterthiner, T., Dehghani, M., Minderer,
M., Heigold, G., Gelly, S., Uszkoreit, J., and Houlsby,
N. (2021). An image is worth 16x16 words: Trans-
formers for image recognition at scale.
El Jiani, L., El Filali, S., and Benlahmer, E. H. (2022).
Overcome medical image data scarcity by data aug-
mentation techniques: A review. In 2022 Interna-
tional Conference on Microelectronics (ICM), pages
21–24.
F. Al-Yasriy, H., Al-Huseiny, M., Mohsen, F., Khalil, E.,
and Hassan, Z. (2020). Diagnosis of lung cancer based
on ct scans using cnn. IOP Conference Series: Mate-
rials Science and Engineering, 928:022035.
Hamdalla, A. and Muayed, A.-H. (2023). The iq-oth/nccd
lung cancer dataset.
He, K., Zhang, X., Ren, S., and Sun, J. (2015). Deep
residual learning for image recognition. CoRR,
abs/1512.03385.
Ionescu, R. T., Khan, F. S., Georgescu, M.-I., and Shao,
L. (2019). Object-centric auto-encoders and dummy
anomalies for abnormal event detection in video. In
Proceedings of the IEEE/CVF Conference on Com-
puter Vision and Pattern Recognition (CVPR).
K., C., B., V., K., S., J., F., J., K., P., K., S., M., S., P., D.,
M., M., P., L., T., and F., P. (2013). The cancer imag-
ing archive (tcia): Maintaining and operating a public
information repository. Journal of Digital Imaging,
26(6), 1045–1057.
Kohavi, R. (2001). A study of cross-validation and boot-
strap for accuracy estimation and model selection. 14.
L., S., E., F. A., R., J., Mikkelsen, T., and W., A. D.
(2019). Data From REMBRANDT [Data set]. The
Cancer Imaging Archive.
Lakhani, P. (2017). Deep convolutional neural networks for
endotracheal tube position and x-ray image classifica-
tion: Challenges and opportunities. Journal of Digital
Imaging, 30:460–468.
LeCun, Y., Bengio, Y., and Hinton, G. (2015). Deep learn-
ing. Nature, 521:436–44.
Liu, J., Xie, G., Wang, J., Li, S., Wang, C., Zheng,
F., and Jin, Y. (2023). Deep Industrial Image
Anomaly Detection: A Survey. arXiv e-prints, page
arXiv:2301.11514.
Coreset Based Medical Image Anomaly Detection and Segmentation
557

Lu, C., Shi, J., and Jia, J. (2013). Abnormal event detection
at 150 fps in matlab. In Proceedings of the IEEE In-
ternational Conference on Computer Vision (ICCV).
Lundervold, A. S. and Lundervold, A. (2019). An overview
of deep learning in medical imaging focusing on mri.
Zeitschrift f
¨
ur Medizinische Physik, 29(2):102–127.
Special Issue: Deep Learning in Medical Physics.
Manzari, O. N., Ahmadabadi, H., Kashiani, H., Shokouhi,
S. B., and Ayatollahi, A. (2023). Medvit: A ro-
bust vision transformer for generalized medical image
classification. Computers in Biology and Medicine,
157:106791.
Roth, K., Pemula, L., Zepeda, J., Scholkopf, B., Brox, T.,
and Gehler, P. (2022). Towards total recall in indus-
trial anomaly detection. pages 14298–14308.
Rudolph, M., Wehrbein, T., Rosenhahn, B., and Wandt, B.
(2023). Asymmetric student-teacher networks for in-
dustrial anomaly detection. In Winter Conference on
Applications of Computer Vision (WACV).
Sayah, A., Bencheqroun, C., Bhuvaneshwar, K., Belouali,
A., Bakas, S., Sako, C., Davatzikos, C., Alaoui, A.,
Madhavan, S., and Gusev, Y. (2022). Enhancing the
rembrandt mri collection with expert segmentation
labels and quantitative radiomic features. Scientific
Data, 9:338.
Schmidhuber, J. (2015). Deep learning in neural networks:
An overview. Neural Networks, 61:85–117.
Shvetsova, N., Bakker, B., Fedulova, I., Schulz, H., and
Dylov, D. V. (2021). Anomaly detection in medical
imaging with deep perceptual autoencoders. IEEE Ac-
cess, 9:118571–118583.
Siddalingappa, R. and Kanagaraj, S. (2021). Anomaly de-
tection on medical images using autoencoder and con-
volutional neural network.
Simpson, A. L., Antonelli, M., Bakas, S., Bilello, M.,
Farahani, K., van Ginneken, B., Kopp-Schneider, A.,
Landman, B. A., Litjens, G., Menze, B., Ronneberger,
O., Summers, R. M., Bilic, P., Christ, P. F., Do,
R. K. G., Gollub, M., Golia-Pernicka, J., Heckers,
S. H., Jarnagin, W. R., McHugo, M. K., Napel, S.,
Vorontsov, E., Maier-Hein, L., and Cardoso, M. J.
(2019). A large annotated medical image dataset for
the development and evaluation of segmentation algo-
rithms.
Talo, M., Yildirim, O., Baloglu, U. B., Aydin, G., and
Acharya, U. R. (2019). Convolutional neural networks
for multi-class brain disease detection using mri im-
ages. Computerized Medical Imaging and Graphics,
78:101673.
Tschuchnig, M. E. and Gadermayr, M. (2022). Anomaly
detection in medical imaging - a mini review. In Data
Science – Analytics and Applications, pages 33–38.
Springer Fachmedien Wiesbaden.
Xie, R., Pang, K., Bader, G. D., and Wang, B. (2023).
Maester: Masked autoencoder guided segmentation
at pixel resolution for accurate, self-supervised sub-
cellular structure recognition. In Proceedings of the
IEEE/CVF Conference on Computer Vision and Pat-
tern Recognition (CVPR), pages 3292–3301.
Xie, Y. and Richmond, D. (2019). Pre-training on grayscale
imagenet improves medical image classification. In
Leal-Taix
´
e, L. and Roth, S., editors, Computer Vi-
sion – ECCV 2018 Workshops, pages 476–484, Cham.
Springer International Publishing.
Yang, H., Zhang, J., Liu, Q., and Wang, Y. (2018). Mul-
timodal mri-based classification of migraine: using
deep learning convolutional neural network. BioMed-
ical Engineering OnLine, 17.
Yang, J., Shi, R., and Ni, B. (2021). Medmnist classification
decathlon: A lightweight automl benchmark for med-
ical image analysis. In IEEE 18th International Sym-
posium on Biomedical Imaging (ISBI), pages 191–
195.
Yang, J., Shi, R., Wei, D., Liu, Z., Zhao, L., Ke, B., Pfis-
ter, H., and Ni, B. (2023). Medmnist v2-a large-scale
lightweight benchmark for 2d and 3d biomedical im-
age classification. Scientific Data, 10(1):41.
Zhao, B., Fei-Fei, L., and Xing, E. P. (2011). Online detec-
tion of unusual events in videos via dynamic sparse
coding. In CVPR 2011, pages 3313–3320.
VISAPP 2024 - 19th International Conference on Computer Vision Theory and Applications
558
