
RailCloud-HdF: A Large-Scale Point Cloud Dataset for Railway Scene
Semantic Segmentation
Mahdi Abid
a
, Mathis Teixeira, Ankur Mahtani
∗ b
and Thomas Laurent
FCS Railenium, F-59300 Famars, France
Keywords:
Point Cloud Dataset, Railway Scenes, Semantic Segmentation, Deep Learning, LiDAR.
Abstract:
Semantic scene perception is critical for various applications, including railway systems where safety and
efficiency are paramount. Railway applications demand precise knowledge of the environment, making Light
Detection and Ranging (LiDAR) a fundamental component of sensor suites. Despite the significance of 3D
semantic scene understanding in railway context, there exists no publicly available railborne LiDAR dataset
tailored for this purpose. In this work, we present a large-scale point cloud dataset designed to advance
research in LiDAR-based semantic scene segmentation for railway applications. Our dataset offers dense
point-wise annotations for diverse railway scenes, covering over 267km. To facilitate rigorous evaluation and
benchmarking, we propose semantic segmentation of point clouds from a single LiDAR scan as a challenging
task. Furthermore, we provide baseline experiments to showcase some state-of-the-art deep learning methods
for this task. Our findings highlight the need for more advanced models to effectively address this task.
This dataset not only catalyzes the development of sophisticated methods for railway applications, but also
encourages exploration of novel research directions.
1 INTRODUCTION
3D data are crucial for environment perception, and
substitute images in various applications e.g. urban
mapping, autonomous cars. The most common form
of such data is point clouds with 3D coordinates
and associated radiometry information. Different
machine vision methods have been applied to the
environment recognition and visualization using
three-dimensional data, especially in different areas
of robotics, e.g. laser scanning system (Sergiyenko
et al., 2023). However, these methods usually
result in a contradiction between data processing
time and obtained performance. As a result, deep-
learning-based techniques have attracted considerable
attention recently, inspired by their powerful capacity
in other fields (Abid and Lefebvre, 2021; Com-
pagnon et al., 2023). As deep learning for image
processing has already developed towards industrial
use, deep learning for 3D point cloud processing
remains an ongoing field of research. Regarding
the application of deep learning methods for point
cloud analysis, the main tasks include semantic
a
https://orcid.org/0000-0001-5504-3014
b
https://orcid.org/0000-0003-2738-4705
∗
Corrresponding author
segmentation (Guo et al., 2021). In recent years, the
autonomous car industry has played a crucial role
in its development, particularly by providing open
source data e.g. SemanticKITTI (Behley et al., 2019).
With the growing embeddability and reduced
cost of LiDAR (Light Detection And Ranging)
scanners, point cloud data for large-scale geomatics
become widely available, e.g. the OpenTopography
1
database. Several high-density open source LiDAR
datasets, e.g. Hessigheim Benchmark (K
¨
olle et al.,
2021), address the issue of Point Cloud Semantic
Segmentation (PCSS) i.e. providing a label to each
point based on the object or structure to which it
belongs. Although this information is low-level,
it is used to build meaningful representations
for real-world applications like vegetation mass
estimate and infrastructure cartography (Soil
´
an
et al., 2019). Deep-learning-based processing is
at its early stages of development in the railway
field. Point cloud semantic information could
simplify existing use cases and lead to new railway
applications e.g. condition estimate of level crossing
barriers, automated site inventory, etc. Reliable
railway LiDAR PCSS marks an initial step towards
optimizing maintenance.
1
https://opentopography.org
Abid, M., Teixeira, M., Mahtani, A. and Laurent, T.
RailCloud-HdF: A Large-Scale Point Cloud Dataset for Railway Scene Semantic Segmentation.
DOI: 10.5220/0012394800003660
Paper published under CC license (CC BY-NC-ND 4.0)
In Proceedings of the 19th International Joint Conference on Computer Vision, Imaging and Computer Graphics Theory and Applications (VISIGRAPP 2024) - Volume 2: VISAPP, pages
159-170
ISBN: 978-989-758-679-8; ISSN: 2184-4321
Proceedings Copyright © 2024 by SCITEPRESS – Science and Technology Publications, Lda.
159

In this paper, we address the issue of lack of
accessible LiDAR data in railway sector, which
are crucial for empirical evaluation of approaches
dedicated to tasks in railway applications. We
propose RailCloud-HdF
2
, a large-scale LiDAR point
cloud dataset with point-wise annotation of railway
scenes. Compared to other railway point cloud
datasets mentioned in literature, our dataset is the
largest one with a relatively good precision, and to
the best of our knowledge, it is the first in railway
category to be made publicly available. We consider
semantic segmentation of point clouds from a single
LiDAR scan as a task for our dataset benchmarking.
To address this task, training and evaluation of
deep-learning-based state-of-the-art approaches is
performed using splits from our dataset. The paper is
organized as follows: we first introduce works related
to the topic, along with our dataset. Then, we present
the choice of our baseline methods, and explain the
methodology developed for the segmentation task.
Afterwards, we discuss our segmentation results,
speed and robustness to point density. We finally
detail some future research directions.
2 RELATED WORK
This section is devoted to the presentation of recent
works related to the methods and domain of our
study. These works can be divided into three main
categories: (1) Existing 3D LiDAR point cloud
datasets, (2) Railway LiDAR PCSS, and (3) Deep
learning methods for LiDAR PCSS.
2.1 Existing Datasets
Datasets are essential for empirical assessment of
studied approaches. When they are publicly available
along with benchmarks, they serve two primary
functions: firstly, they establish a foundation for
tracking progress, as they enable the presentation of
results that can be reproduced and assessed against
each other, and secondly, they facilitate the creation
of innovative methods without the initial costly task
of gathering and annotating data. Although there are
several datasets designed for image-based semantic
segmentation (Neuhold et al., 2017; Cordts et al.,
2016), the availability of datasets featuring point-wise
annotations for 3D point clouds remains relatively
limited. Table 1 shows recent examples, which can
be categorized into urban datasets generally proposed
2
The dataset can be downloaded from:
railenium sharepoint mahtani
For any queries, please contact: mahdiabid91@gmail.com
for self-driving car applications, and railway datasets
used for mobile mapping systems or environment
monitoring tasks.
Among the railway datasets, one can cite Saint-
Etienne dataset which is a LiDAR point cloud
dataset acquired in industrial settings to illustrate
performances of a novel deep-learning-based method
for 3D PCSS. Other examples are the datasets used
in (Grandio et al., 2022) to test a methodology
that segments both punctual and linear elements
from railway infrastructure. The most notable
difference between these datasets and those from
urban environments is that they are not made publicly
available, which highlights the gap between the two
sectors in terms of availability of data acquired using
LiDAR sensors.
2.2 Railborne LiDAR PCSS
In the railway industrial context, standard model-
based methods often rely on user-implemented
global and local geometrical features and trajectory
information, and are usually object-oriented (Lamas
et al., 2021). While these methods tend to perform
well in controlled environments, they need to be
refined for any use case changes and are sensitive to
unanticipated features.
In a recent study conducted by Guinard et
al. (Guinard et al., 2021), a fast random forest
classifier is introduced, which relies on a set of
handcrafted features derived from eigenvalues of
local point-neighborhood covariance matrices. To
enhance the algorithm’s robustness to ill-sampled
data and to speed up the process, the authors
have developed a pre-segmentation step, partitioning
the point cloud into geometrically homogeneous
segments for subsequent classification, which is then
propagated back to the original cloud.
Exploring deep-learning methods, Soil
´
an et al.
(Soil
´
an et al., 2020) apply PointNet (Qi et al.,
2017a) and KPConv (Thomas et al., 2019) methods
to segment point cloud data from railway tunnels.
Despite the simplicity of the test environment, their
research has revealed promising outcomes in the
context of thorough infrastructure segmentation. In
a similar vein, Manier et al. (Manier et al., 2022)
introduce a deep-learning-based approach for 3D
PCSS tailored for LiDAR captured railway scenes.
It relies on local point cloud transformations for
convolutional learning, and effectively extracts useful
information for maintenance and topological analysis,
while demonstrating remarkable robustness against
variations in point distribution and redundancy.
VISAPP 2024 - 19th International Conference on Computer Vision Theory and Applications
160

Table 1: Overview of recent urban and railway point cloud datasets with point-wise semantic annotation. Missing information
is not mentioned in the corresponding references.
1
Total number of points given in millions,
2
Number of classes used for
evaluation and number of annotated classes in brackets,
3
Total distance covered by the sensor during data acquisition in km,
4
Length of tiles in which the entire point clouds are subdivided,
5
Range precision which is the maximum distance separating
two contiguous points,
6
Number of points per m
2
(average value or range),
7
(Vallet et al., 2015),
8
(Hackel et al., 2017),
9
(Roynard et al., 2018),
10
(Behley et al., 2019),
11
(Manier et al., 2022).
Dataset #points
1
#classes
2
length
3
tile
4
precision
5
density
6
sensor published
IQmulus
7
12 22 (22) 0.21 - - - Riegl LMS-Q120i ✓
(Zhang et al., 2015) 32 10 (10) - - - - Velodyne HDL-64E ✓
Semantic3d
8
4009 8 (8) - - - - Terrestrial Laser Scanner ✓
Paris-Lille-3D
9
143.1 9 (50) 1.94 - - 1000-2000 Velodyne HDL-32E ✓
SemanticKITTI
10
4549 25 (28) - 100m - - Velodyne HDL-64E ✓
(Lamas et al., 2021) >3000 10 (10) 90 200m 5mm 980 Lynx Mobile Mapper ✗
(Grandio et al., 2022) 39 - 2 - 30mm 644 G lidar ✗
(Grandio et al., 2022) 129 - 0.4 200m 5mm 11000 RIEGL LiDAR ✗
Saint-Etienne
11
257 9 (9) 13 - - - - ✗
RailCloud-HdF 8060.3 8 (9) 267.52 50m 7mm 2400 RIEGL VUX-1HA ✓
2.3 Deep Learning Methods for LiDAR
PCSS
Irrespective of the lack of implemented deep learning
approaches for PCSS in railway context, the design
and application of such approaches to general
purposes have been significantly growing over the
recent years. Indeed, due to the very broad range of
approaches adopted in this area, it is useful to divide
them into different categories.
Projection-based methods in LiDAR PCSS
operate by first generating images by projecting
the 3D point cloud onto a 2D plane. Convolutional
Neural Networks (CNNs) are then applied to these
images to perform segmentation, and the result is
projected back onto the original point cloud. A
well-known method is RangeNet++ (Milioto et al.,
2019), which projects 3D points onto a 2D spherical
grid. One notable advantage is that CNNs are known
to yield state-of-the-art results for image-based tasks.
However, projection-based methods are sensitive
to the choice of viewpoint for generating images,
which can lead to inconsistencies in segmentation
results. Moreover, they may not fully exploit the
entire geometric information present in point cloud
data.
Discretization-based methods aim to transform
the unordered and sparse LiDAR point clouds
into structured 3D grids, often using a process
called voxelization. This transformation enables
the application of 3D-CNNs, the 3D equivalent
of traditional 2D-CNNs used for image data.
However, voxelization introduces memory and
precision constraints, as the memory usage grows
cubically with the point cloud size, making these
methods unsuitable for large-scale data. To mitigate
memory usage, sparse representations ignoring empty
cells have been introduced with Minkowski CNN
(Choy et al., 2019). While these techniques improve
memory efficiency, they may still struggle with
extremely large-scale point clouds.
Point-wise methods operate directly on raw
coordinates. PointNet (Qi et al., 2017a), the pioneer
of these methods, applies Multi Layer Perceptron
(MLP) to individual points to extract features,
providing a foundation for subsequent approaches.
PointNet++ (Qi et al., 2017b) introduces hierarchical
feature learning from larger to local regions, which
enhances its robustness. RandLA-Net (Hu et al.,
2020) addresses the challenge of large-scale point
clouds by adopting random sampling and local
feature aggregation, although it may suffer from
reduced accuracy due to this sampling strategy.
KPConv (Thomas et al., 2019) proposes Kernel Point
Convolutions, which determine convolution weights
based on Euclidean distances to points, offering
a novel approach to extracting local structures
efficiently. Expanding on this kernel-based approach,
ConvPoint (Boulch, 2020) takes it a step further
by replacing discrete kernels with continuous ones,
further refining the technique for local structure
extraction. These point-wise methods excel in
preserving the original point information, which is
beneficial for maintaining detailed geometry in the
segmentation process. However, they may struggle
with inefficient local context extraction.
Table 2: Specifications of data acquisition systems.
Laser Scanner RIEGL VUX-1HA
INS system IGI Compact MEMS (ROBIN)
GNSS receiver Septentrio Dual GNSS
Camera FLIR Grasshopper 3 12MP
camera - CX-Format CMOS
RailCloud-HdF: A Large-Scale Point Cloud Dataset for Railway Scene Semantic Segmentation
161
3 THE RailCloud-HdF DATASET
3.1 Data Acquisition
In order to collect railway point cloud data, two
identical systems
3
combining LiDAR technology
with an accurate and lightweight INS (Inertial
Navigation System) were used. Each system
integrates a laser scanner with a field angle view of
360
◦
, an acquisition rate of 200Hz and 1mm precision
within a range of 119m around the surveying
wagon. It also integrates a 12MP camera, two
GNSS (Global Navigation Satellite System) antennas,
a GIS (Geographic Information System) quality
IMU (Inertial Measurement Unit) navigation system,
a touch screen control unit, and three mounting
systems. System specifications are given in Table 2.
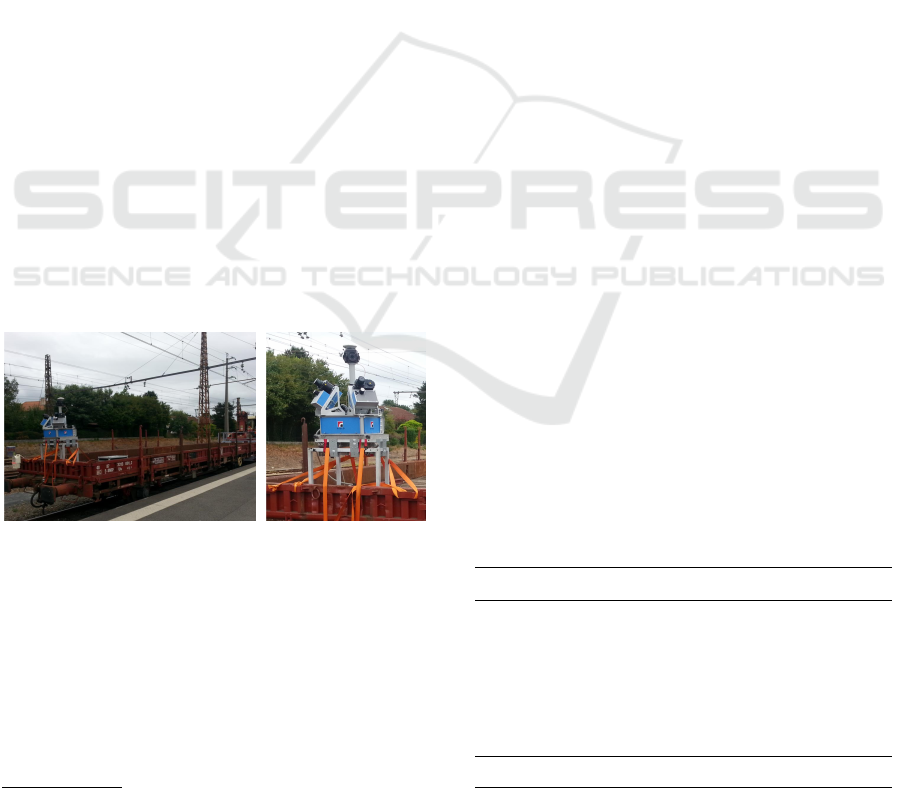
The two systems were installed on a railborne flat
wagon as shown in Figure 1(a). The systems were
mounted horizontally on the top of the wagon by
means of a mounting frame, and at a height of 3.61m
as if it were positioned on both sides of a train front at
the level of the driver’s cab (cf. Figure 1(b)). The
mounting frame is equipped with damping devices
capable of resisting the weight of the system and all
other forms of load in order to limit the vibrations and
torsion effects of the acquisition device and to ensure
the quality of data. The device is equipped with
a long-life battery that allows it to be autonomous
during the entire acquisition sequence. Its autonomy
enables to cover about 350km of tracks at 60km/h on
average over a day.
(a)
(b)
Figure 1: Experimental platform: (a) overview of the
wagon, (b) acquisition device.
A large amount of LiDAR point cloud data was
acquired from eight railway lanes connecting 11 cities
in the Hauts-de-France region in northern France,
hence the suffix “HdF” added to the dataset name.
The connected cities are Aulnoye, Busigny, Lille,
Douai, Lens, Ostricourt, Don, Bethune, Hazebrouck,
Calais and Dunkerque. The railway lanes are
3
The data acquisition systems are made by GEOSAT:
https://www.geo-sat.com/fr/moyens-materiels-logiciels/
267.52km long in total. To further densify the
obtained point clouds, the travels on the eight lanes
were conducted in round trip. In order to obtain
quality data, the acquisitions were carried out in
adequate meteorological conditions (absence of rain
and fog) and sufficient light conditions (acquisition
during the day). The acquisitions guarantee a
minimum density of one point every 5cm per scan by
combining both passes of round trip, on a corridor of
20m centered on the acquisition system (10m on both
sides), regardless the measured surface and the wagon
velocity. Data acquisition on the different lanes took
place in the interval of four days.
3.2 Annotation Process
For point-wise annotation, manual segmentation in
3D was performed tile by tile using CloudCompare
software (version 2.12.2) (CloudCompare, 2022). In
order to obtain consistent, geometrically reliable and
correct labels, annotators rely on the colorized point
clouds. Color channels are the result of adjusting the
images acquired by the cameras to the point clouds.
Annotating 3D point clouds is laborious since
the annotator often has to adjust the viewpoint. On
average, an annotator needs 1.5 hours per tile. Each
tile labels are also verified by a different annotator,
which adds 10 minutes on average per tile.
3.3 Dataset Format
Acquired LiDAR point data records are contained
in compressed LAS files (.laz extension) of version
LAS 1.2 and point data format type 3. This format
stores 3D coordinates, intensity, classification and
color channels, with the addition of GPS time.
Table 3: Statistics related to point cloud data collected for
each of the eight railway lanes.
1
Name of railway lane
in departure-arrival format,
2
Total number of points given
in millions,
3
Distance covered by the sensor during data
acquisition in km,
4
Number of tiles in which the acquired
point clouds are subdivided.
Railway lane
1
#points
2
length
3
#tiles
4
Aulnoye-Busigny 1051.2 34.62 693
Lille-Douai 1496 43.01 861
Lens-Ostricourt 424.7 14.78 296
Don-Lens 435.4 16.13 323
Don-Bethune 686.8 23.09 463
Lille-Don 873 27.63 553
Hazebrouck-Calais 1689.1 60.73 1215
Hazebrouck-Dunkerque 1404.2 47.53 949
Total 8060.3 267.52 5353
VISAPP 2024 - 19th International Conference on Computer Vision Theory and Applications
162
3.4 Dataset Statistics
The resulting point clouds, saved each in a .laz file,
have an average of 1.5 million points. So, more
than 8 billion points are comprised in the complete
dataset. Some files have many millions of points
while the majority of files contain nearly one million
points. This is due to the fact that the density of
points depends on the geometrical properties of the
captured environment, as well as the velocity of the
wagon. The files representing a large number of
points correspond to the phases when the train is close
to the departure or arrival stations, because of the
complexity of the station infrastructures and the low
speed of the wagon during these phases. Point cloud
data statistics per lane are shown in Table 3.
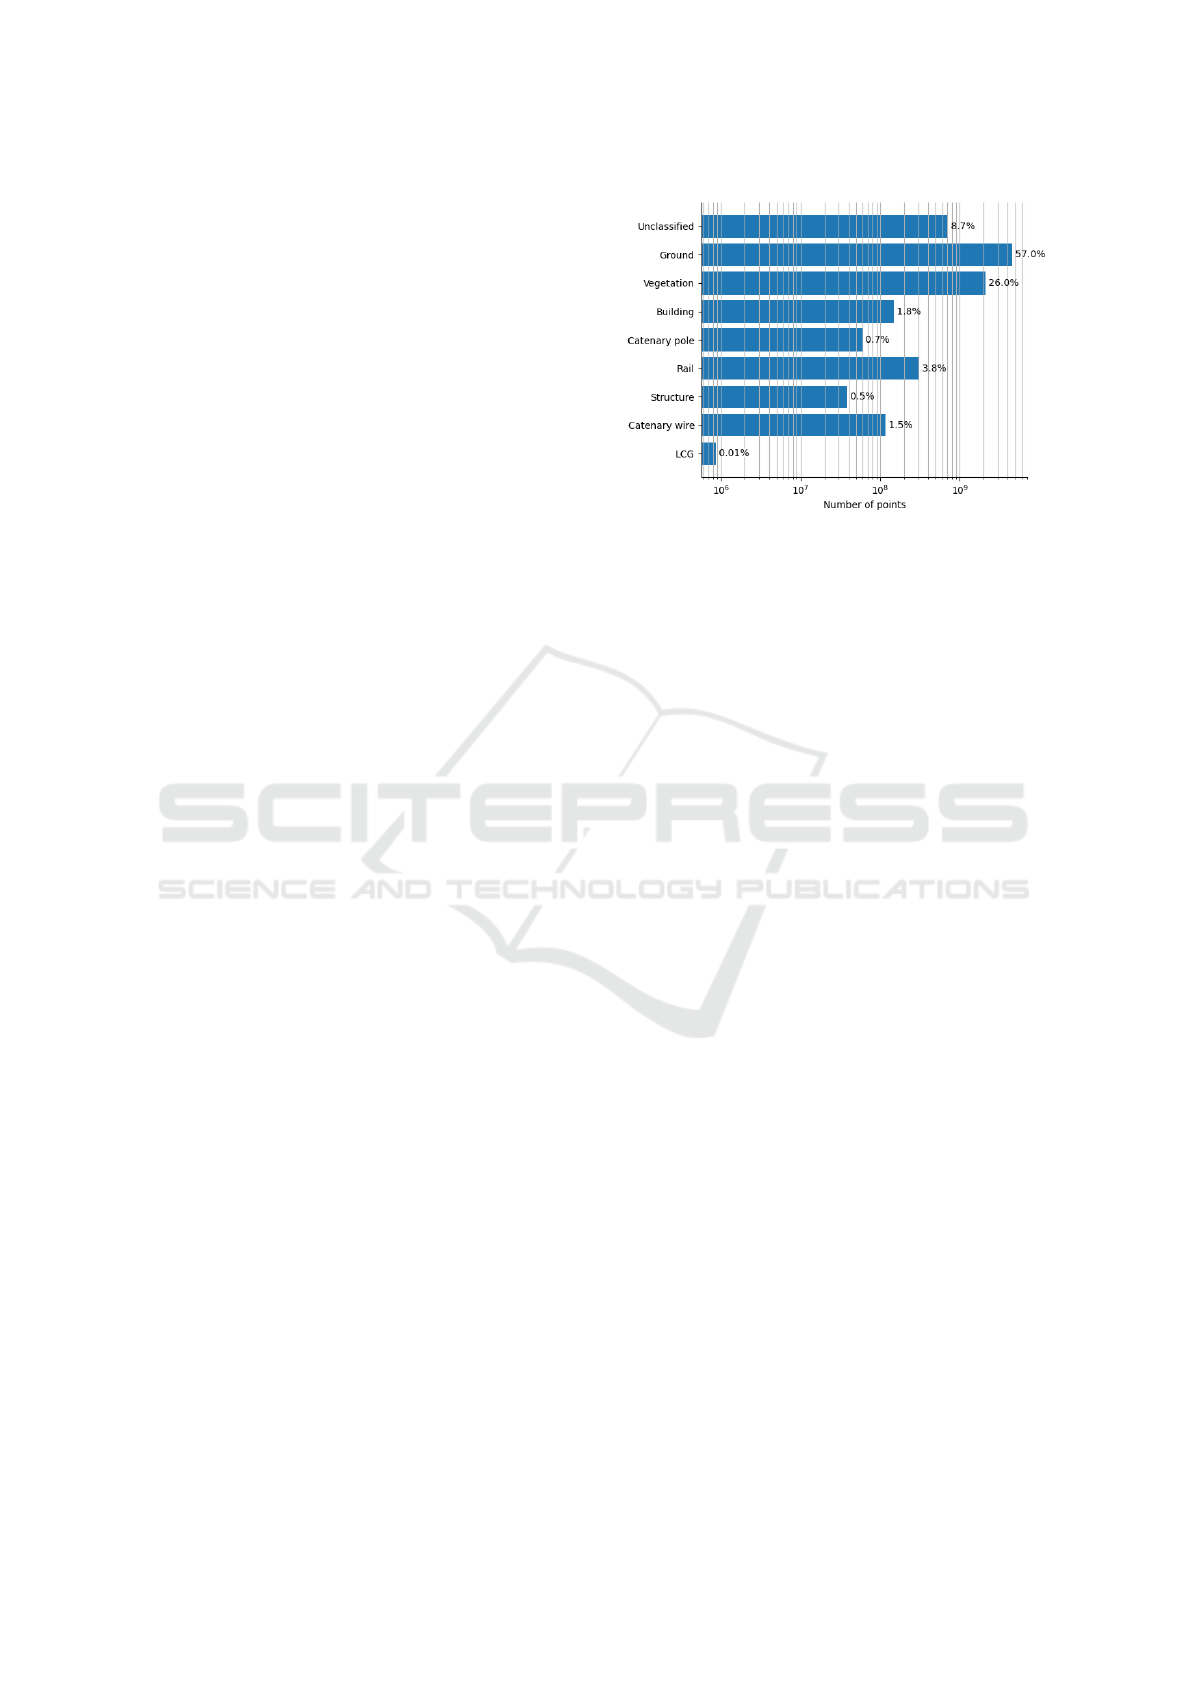
The number and percentage of points belonging
to each class are shown in Figure 2. The ground,
vegetation and unclassified classes are the most
frequent classes. The level crossing gate (LCG) class
is weakly represented in the dataset since the wagon
rarely encounters a level crossing during its travel, but
still more than 860 thousand points are labeled.
For datasets collected in natural environments, the
distribution of classes is commonly unbalanced, and
some classes corresponding to objects or structures
that rarely occur are always under-represented.
Overall, the unbalanced class distribution is quite
comparable in other datasets, e.g. SemanticKITTI
(Behley et al., 2019) and Saint-Etienne (Manier et al.,
2022).
4 EVALUATION OF SEMANTIC
SEGMENTATION
In this section, the evaluation of some state-of-the-art
methods for scene semantic segmentation exploiting
information of a single scan is depicted.
As the class unclassified includes outliers, other
structures and objects, and is then too diverse with a
high intra-class variation, we decided not to include
it in the performance evaluation. Thus, eight instead
of nine classes are taken into account during training
and testing phases.
4.1 Baseline Approaches
Given the strengths and limitations of different
categories of state-of-the-art methods presented in
Section 2.3, we choose to use four point-wise
architectures to provide results on our dataset.
We consider PointNet and its improved version
PointNet++, which have been widely tested across
Figure 2: Class distribution. The number and percentage of
labeled points per class are shown.
the existing literature. We distinguish two versions
of PointNet, where PointNet (Vanilla) is the one in
(Qi et al., 2017a) that does not use transformation
networks. For PointNet++ as well, we test two
versions, where PointNet++ (MSG) (Qi et al., 2017b)
is the network that applies multi-scale grouping
followed by according PointNets to extract features
at different scales. Another point-wise MLP method
that we test is RandLA-Net (Hu et al., 2020). We
finally add a convolution-based architecture which is
ConvPoint (Boulch, 2020) that was recently used as
a baseline in (Manier et al., 2022) for PCSS in both
railborne and airborne LiDAR datasets.
Note that for these baseline networks, we
consider the same architectures and hyperparameters
as described in the corresponding references. One
exception is that for RandLA-Net, point clouds are
downsampled with a five-fold decimation ratio and
the number of nearest points is set as 32.
4.2 Input and Output of the Methods
In PCSS, per-point classification has been extensively
studied (Kaijaluoto et al., 2022). Since there are
several attributes to characterize each point of a
3D cloud, the input features that are fed to the
networks have to be declared. Hence, in this work,
Euclidian coordinates along with intensity values are
considered, having as input matrix X ∈ R
N×4
:
X =
x y z I
=
x
1
y
1
z
1
I
1
.
.
.
.
.
.
.
.
.
.
.
.
x
N
y
N
z
N
I
N
(1)
Where N is the number of input points, (x
i
, y
i
, z
i
) and
I
i
, i=1,. . . ,N, correspond to the Euclidean coordinates
and the intensity value of each point, respectively.
RailCloud-HdF: A Large-Scale Point Cloud Dataset for Railway Scene Semantic Segmentation
163

Then, the used deep-learning-based methods aim
to estimate the class of each input point of the cloud.
4.3 Preprocessing
Once the input features are defined, preprocessing
steps are applied to the point clouds for training
phase. These steps are the following:
• Grid Sampling. The density of points varies
depending on the scanned environment, and the
velocity of the wagon when surveying. This
makes mandatory the capability of processing
point clouds with different point densities. In
order to alleviate the task to a neural network, all
the point clouds are first subsampled using grid
subsampling. The used grid size is 15cm;
• Cube Crop. To provide a homogeneous point
cloud size to a neural network, it is fed by cubes
of 10m each side. During training, only one cube
from each scan is sampled in each epoch. For this
purpose, a random point of the original scan is
taken, and the cube around that point is sampled.
With this, different sub-clouds are fed from the
same cloud at different epochs;
• Scale Intensity. Intensity data are represented
as integers, and the LiDAR has 16-bit scanner,
then the largest value allowed is 65535. Using
this value as a scale factor, intensity data are
normalized to [0,1];
• Scale Coordinates. The coordinates of the point
clouds are usually high, and having high input
values may cause instability while training neural
networks. To avoid this issue, once a cube is
taken, its coordinates are scaled to [0,1] in all
axes, using the 10m as the scale factor;
• Data Augmentation. The data augmentation
consists of duplicating and applying geometric
transformations to cubes from the training set
that have points labeled as LCG, catenary pole
or structure, which are the least represented
classes. Cubes containing those objects have
been replicated, rotated, cropped each around
its barycenter, and Gaussian noise of 2×10
-3
standard deviation is applied to their point
features. To avoid segmentation dependency
on the orientation of the railway track, the
training cubes were randomly rotated around
z-axis, where the maximum rotation is restricted
to 180°. With this, the number of points with
those labels is incremented and more variability
in the training data helps the network to generalize
better afterwards;
• Fixed Number of Points. Since the considered
architectures need to be fed always by a given
number of points, the cube points are randomly
duplicated or subsampled with replacement to N
points. N must be big enough to be representative
of the cloud, but the smaller it is, the faster
the network will process. We consider N=8192
points.
4.4 Training Details
The dataset need to be split for training, validation,
and testing of the models. The scans are shuffled,
with 95% used for the training process and the
remaining 5% reserved for testing. The training
process scans are in their turn split into 80% for model
training and 20% for validation. The training process
minimizes cross entropy loss between the point labels
relative to cubes cropped from training scans and
their estimates. As the labels present in the dataset
are clearly unbalanced, a loss weighting coefficient is
applied allowing stronger error back-propagation for
the least populated classes: ρ =
2.5
q
P
max
P
c
, ∀c ∈ C the
classes, with P the percentage of points belonging to
a class within the training dataset.
The training set is decomposed in batches of eight
sequences, and from the 50
th
epoch, early stopping
method is used to end each training process if the
validation loss doesn’t improve for 20 consecutive
epochs. Adam optimizer is used with an initial
learning rate of 1×10
-3
. The maximum number
of training epochs is set to 300, and for the first
five epochs, a gradual warmup strategy that linearly
increases the learning rate from 0 to the initial
learning rate is adopted to avoid numerical instability
and very slow convergence to the final solution (Goyal
et al., 2017). For the next epochs, a cosine learning
rate decay (He et al., 2019) is used to decrease the
learning rate from the initial value to 0 by following
the cosine function, which potentially improves the
training progress.
The training is implemented using PyTorch
library, and the used hardware consists of an NVIDIA
RTX A6000 GPU with 48GB GDDR6 memory and
CUDA toolkit 10.1.
As explained in Section 4.2, the intensity is one
of the inputs. It is interesting to study whether this
feature has a significative impact on the segmentation
performance or if it is worth not relying on it to
perform well on the task. In consequence, for each
of the baseline networks, training is performed using
and obviating intensity values to compare both results
obtained in the testing phase.
VISAPP 2024 - 19th International Conference on Computer Vision Theory and Applications
164
4.5 Performance Evaluation Metrics
To evaluate the results in our study, the metrics used
are common for semantic segmentation task, both for
image and three-dimensional data. These metrics are
the following (Everingham et al., 2015):
• Overall accuracy (OA): It measures the rate
of correctly classified points over all points,
irrespective of their classes. The more unbalanced
data is present in the dataset, the less significative
this criterion is;
• Mean accuracy (MA): Unlike OA, this metric
considers the accuracies of all classes and
calculates their mean value;
• Intersection over Union (IoU): It represents the
number of common points between the label and
prediction masks, divided by the number of all
points present across both masks. It is given by
the following equation:
IoU =
TP
TP + FP + FN
(2)
where TP, FP and FN are respectively the number
of true positive, false positive, and false negative
predictions;
• Mean IoU (mIoU): This metric considers the IoUs
of all classes and calculates their mean value as
follows:
mIoU =
1
N
c
N
c
∑
c=1
TP
c
TP
c
+ FP
c
+ FN
c
(3)
where TP
c
, FP
c
and FN
c
are respectively the
number of true positive, false positive, and false
negative predictions for the c
th
class, and N
c
corresponds to the number of classes.
4.6 Testing Results
Once the baseline networks are trained, they are
tested against the test tiles. The difference between
the testing and training processes is mainly the data
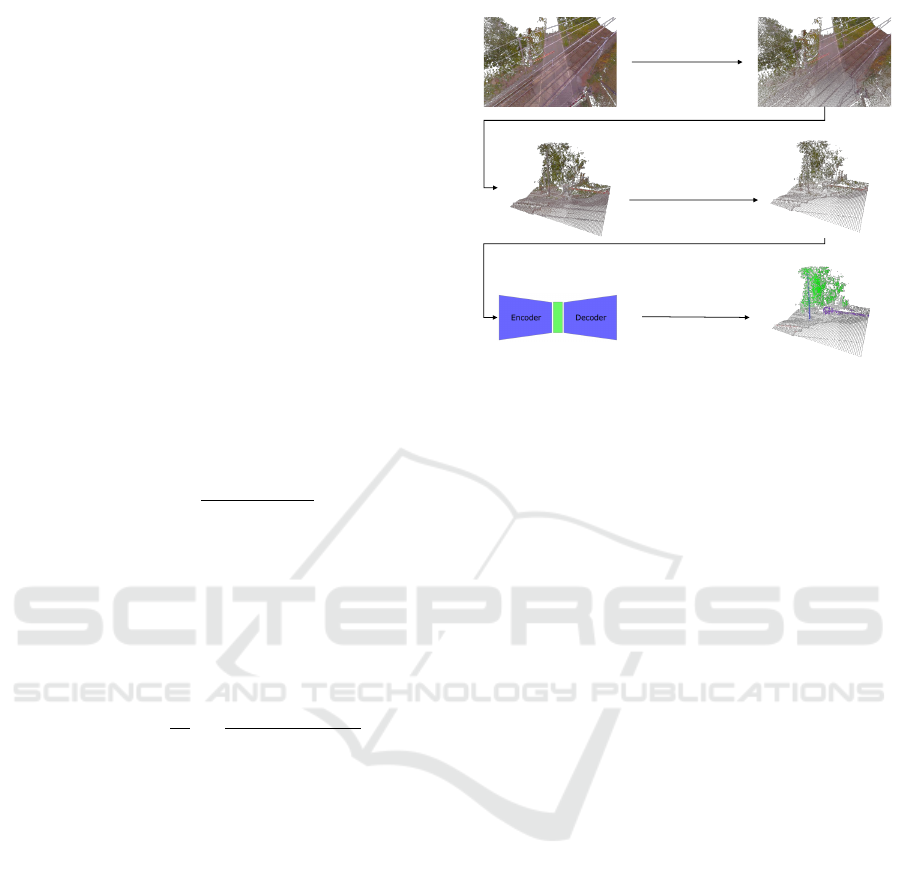
pre-processing. A graphical summary of the inference
steps undergone by test scans is presented in Figure
3. First, each point cloud is grid-subsampled. Then
a grid of resolution 10m is applied to get cropped
cubes, which features are scaled, and from which N
points are considered. Finally, these fully processed
cubes are fed to the network, and its predictions are
obtained for final segmentation result. Then, the
results are compared to the ground truth of testing
data to calculate the metrics.
a)
b)
c) d)
e)
Neural network
Predictions
Grid subsampling
Fixed number
of points
Cube crop
Scale features
Figure 3: A graphical summary of processing steps involved
in the testing phase. (a) raw point cloud, (b) subsampled
point cloud, (c) cropped cube, (d) processed cube, (e)
prediction result.
4.6.1 Analysis of Semantic Segmentation
Performance
Test clouds are completely predicted for segmentation
to calculate the metrics shown in Table 4. In the
first place, when using intensity values as input, the
networks provide much more accurate segmentation,
except for RandLA-Net and ConvPoint where the gap
in overall and mean metrics is not significant between
both intensity use cases. In addition, ConvPoint
provides the best accuracy and IoU metrics when only
considering 3D point coordinates. Specifically, for
level crossing barriers, intensity range is high due
to their particular surfaces. Then, this feature helps
to better distinguish LCG objects from other classes,
which is reflected for all networks in a considerable
improvement in LCG IoU values when using intensity
feature.
Regarding the test mIoU metric, while the most
performing approaches have values around 75%, this
metric drops for PointNet versions and RandLA-Net.
As for the IoU values obtained for each class, it is
clear that the main issues are structure and LCG.
Since the presence of objects belonging to those
classes in the dataset is low, small errors reduce
more significantly the IoU. PointNet versions and
RandLA-Net mostly underperform while segmenting
the least represented objects, and in particular,
PointNet versions underperform while segmenting
classes without a dominant vertical component (i.e.
ground, vegetation or rails). This result supports
the fact that PointNet cannot capture the local
structural information between points which can be
essential for semantic segmentation tasks, and the
RailCloud-HdF: A Large-Scale Point Cloud Dataset for Railway Scene Semantic Segmentation
165

Table 4: The testing results obtained for all baselines. Overall accuracy, mean accuracy, mIoU and IoU metrics for each asset
are presented. For both intensity feature use cases, the best values of different metrics across the networks are bolded.
Class IoU
Network OA MA Ground Vegetation Building Catenary pole
Intensity IoU mIoU Rail Structure Catenary wire LCG
PointNet (Vanilla) 87.11% 77.47% 73.24% 83.49% 63.84% 38.95%
Yes 77.17% 54.84% 45.25% 36.52% 78.74% 18.73%
PointNet 89.20% 75.74% 77.49% 85.73% 67.98% 48.50%
Yes 80.50% 57.01% 53.91% 21.39% 79.45% 21.61%
PointNet++ 93.08% 87.83% 84.14% 91.47% 80.80% 75.34%
Yes 87.06% 72.63% 52.33% 51.16% 96.07% 49.70%
PointNet++ (MSG) 93.98% 87.80% 86.10% 92.57% 82.02% 79.89%
Yes 88.64% 74.85% 57.18% 47.42% 96.17% 57.49%
RandLA-Net 91.64% 81.72% 83.73% 89.95% 65.33% 59.03%
Yes 84.58% 59.97% 66.77% 21.56% 69.31% 24.05%
ConvPoint 94.01% 86.98% 86.48% 91.69% 81.27% 75.91%
Yes 88.70% 74.38% 75.52% 41.14% 93.50% 49.53%
PointNet (Vanilla) 82.27% 54.14% 70.12% 77.22% 34.98% 26.89%
No 69.88% 37.68% 13.16% 16.74% 61.31% 01.02%
PointNet 84.76% 66.11% 74.51% 80.52% 40.92% 34.79%
No 73.55% 43.58% 28.92% 19.41% 66.95% 02.61%
PointNet++ 92.93% 85.37% 83.83% 91.45% 79.99% 72.74%
No 86.79% 67.97% 50.65% 43.22% 94.09% 27.81%
PointNet++ (MSG) 93.77% 84.40% 86.08% 92.34% 81.61% 81.55%
No 88.26% 68.22% 56.19% 25.75% 94.19% 28.04%
RandLA-Net 91.66% 82.55% 85.26% 88.62% 60.38% 55.04%
No 84.60% 59.07% 69.13% 27.19% 82.94% 04.01%
ConvPoint 94.01% 87.43% 86.58% 91.80% 79.70% 76.56%
No 88.70% 73.05% 75.96% 47.69% 90.90% 35.22%
fact that RandLA-Net is better suited for large-scale
point clouds than 10m-size cubes. Also, it is
interesting how structure objects perform better with
the approaches that provide the worst general results.
The best class IoU metrics are achieved by either
PointNet++ (MSG) or ConvPoint, except for structure
IoU which best value (51.16%) is obtained with
PointNet++ when using intensity feature. Overall,
the results demonstrate how different architectures
perform better for different objects.
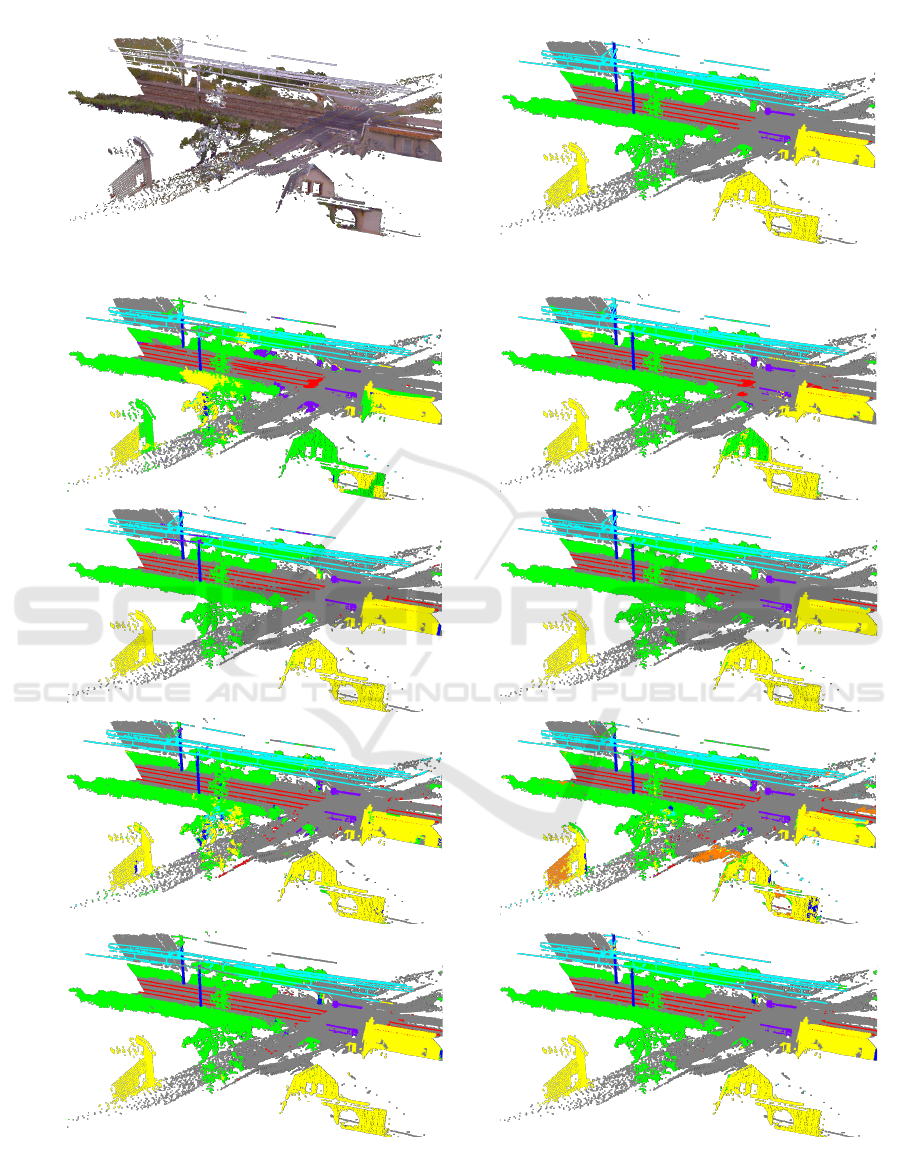
To gain a deeper insight into the limitations
associated with the metrics, we display comparative
views of the segmented point clouds for a sample
test scan in Figure 4. For the sake of clarity, we
have omitted PointNet (Vanilla) and PointNet++ from
this illustration, as these are the least performing
versions of their networks. First, we notice
that for our baseline, considering the intensity
significantly enhances segmentation quality, except
for RandLA-Net where an inverse trend is observed.
In fact, with intensity, RandLA-Net confuses the
structure class with building and ground ones.
Second, PointNet shows confusion between rail and
ground classes while other approaches do not. This
is most likely due to its limited ability to capture
fine-grained patterns. Besides, for most cases, and
despite their low occurence in the training data,
LCG objects are completely segmented, but the few
predicted false positives drastically decrease the class
IoU. Finally, ConvPoint and PointNet++ (MSG) seem
to be less sensitive to spatial noise while segmenting
objects near the vegetation, such as catenary poles and
wires, LCG bases, and buildings.
4.6.2 Processing Speed and Robustness to Point
Density
The results of our baseline experiments show that the
current state of the art for PCSS falls short for the
size and complexity of our dataset. This is caused
by the limited capacity of the tested networks, since
their number of parameters (see Table 5) is much
lower compared to leading image-based semantic
segmentation architectures.
PointNet++ versions provide better results than
PointNet ones, yet they show longer training time
per epoch, attaining more than five times that of
PointNet. For PointNet++ and PointNet++ (MSG),
the inference time on a single scan is at least
twice and three times that of PointNet, respectively.
It’s worth noting that the MSG version is more
expensive than PointNet++ due to the multi-scale
region feature extraction. Compared to PointNet++
versions, using RandLA-Net results in a higher
inference time, while delivering lower segmentation
performance. Although ConvPoint and PointNet++
(MSG) provide quite similar results, ConvPoint
shows a 62% decrease in average training epoch time,
VISAPP 2024 - 19th International Conference on Computer Vision Theory and Applications
166
Original scan Ground truth
no Intensity
with Intensity
PointNet
PointNet
++
(MSG)
RandLA
-Net
ConvPoint
Figure 4: Qualitative segmentation results on a sample test scan, with ground in grey, vegetation in green, building in yellow,
catenary pole in blue, rail in red, structure in orange, catenary wire in cyan, and LCG in purple.
RailCloud-HdF: A Large-Scale Point Cloud Dataset for Railway Scene Semantic Segmentation
167
and reduces inference time by a third. We therefore
deduce that ConvPoint offers a fair compromise
between segmentation performance and training and
inference speed.
Table 5: Network statistics.
Network #parameters
(million)
training time
(
GPU mins
epoch
)
inference time
(
seconds
scan
)
PointNet (Vanilla) 1.67 1.0 1.40
PointNet 3.53 1.2 1.47
PointNet++ 0.97 6.5 2.91
PointNet++ (MSG) 1.88 7.8 3.71
RandLA-Net 1.30 6.8 5.80
ConvPoint 2.33 3.0 2.37
The mIoU values obtained with the network
categorized as the best are 74.38% and 73.05% when
using and obviating the intensity, respectively. These
values are comparable with railway scene semantic
segmentation works where metrics are calculated
point-wise. For instance, in (Grandio et al., 2022),
the test mIoU achieved by a modified PointNet++
architecture on the dataset presented in (Lamas et al.,
2021) is 74.89%. Another example for comparison
is the 77.3% mIoU value obtained with a novel
deep-learning-based method (Manier et al., 2022)
on Saint-Etienne dataset. Furthermore, compared
to mIoU values presented in (Guo et al., 2021) for
different architectures and benchmarks, our result is
well above the average.
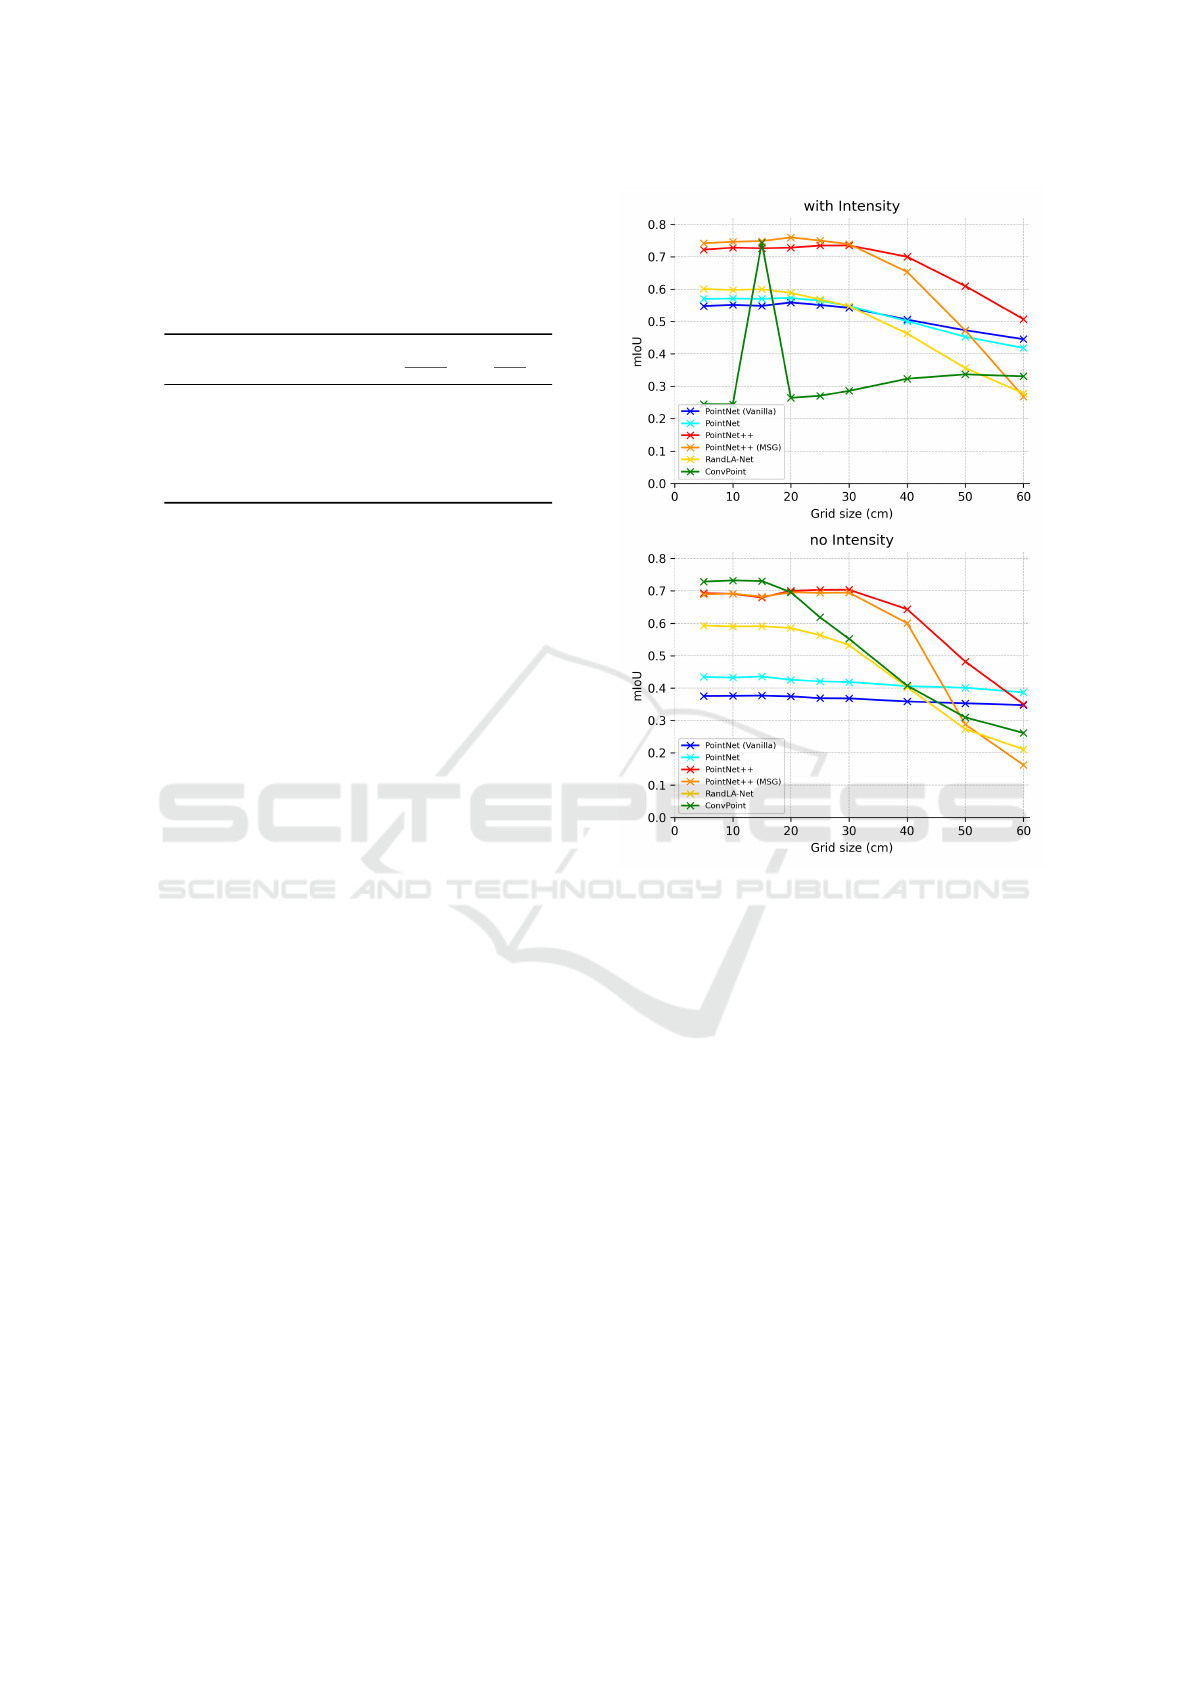
We assess our baseline methods robustness
to varying point density by testing them with
subsampled point clouds only at inference and
compare their segmentation performances (see Figure
5). Although the grid size varies, the number of points
per cube remains the same to have a fixed number
of points per batch which makes the algorithm
parallelizable. Therefore, a higher sampling grid
size increases the redundancy of points in the input
batches.
For sub-sampling grid resolutions lower than that
used for training, all networks perform as good as
in the initial testing phase, except for the case of
using ConvPoint with intensity, where the test mIoU
drastically drops from 74.38% to values under 34%.
We notice that PointNet (Vanilla) is fairly robust
under density decrease due to its focus on global
abstraction rather than fine details. Interestingly,
the segmentation performances of PointNet++ are
less impaired by low point densities than PointNet++
(MSG). Moreover, for all grid sizes higher than 15cm,
PointNet++ delivers one of the two best mIoU values
among the networks.
In an industrial context, these robustness test
results are particularly promising for PointNet++
Figure 5: Effect of different grid-sampling resolutions with
the test subset on the segmentation mIoU metric. The tested
grid sizes are 5cm, 10cm, 15cm, 20cm, 25cm, 30cm, 40cm,
50cm, and 60cm.
taking into consideration the quantities of data that
have to be processed. In fact, the inference
protocol could be redesigned to perform on roughly
subsampled scans using a much larger grid size to
provide a fast global scene segmentation of very large
data with a minimal loss of information e.g. for a fast
count of catenary poles over long travelled distances.
5 CONCLUSION
In this paper, we presented a large-scale dataset
showing unprecedented scale in point-wise
annotation of railway scene point clouds.
Baseline experiments were provided for semantic
segmentation of point clouds from a single LiDAR
scan. We experimented with four point-wise
state-of-the-art architectures on our dataset. Our
best baselines show similar segmentation results
compared to other related baselines and outperforms
VISAPP 2024 - 19th International Conference on Computer Vision Theory and Applications
168

the average results reported by benchmark studies
on indoor or urban scene segmentation. Yet,
there’s still room for improvement of metric values
obtained for railway-specific objects, and results are
mitigated regarding training and inference times.
Finally, the ability of some methods to process
strongly subsampled scans without showing a severe
drop in segmentation performance could meet
industrial expectations in terms of speed for specific
maintenance use cases.
Other than the complexity and size of our dataset,
another possible reason for limited segmentation
performance is that the point clouds captured by
the rotating scanner are relatively sparse. It would
therefore be feasible to test other methods like
SPGraph (Landrieu and Simonovsky, 2018) that is
less affected by distance-dependent sparsity, and
SqueezeSeg (Wu et al., 2018) which exploits the way
the LiDAR captures the data to generate a dense range
image, where each pixel corresponds roughly to a
point in the scan.
Future work also includes completing the dataset
with additional data, compensating for the statistical
class imbalance. Another development to further
evaluate our baselines consists in segmenting more
objects in order to annotate new classes such as
fences, electrical cabinets and traffic lights. Besides,
extending our experiments to classification and object
detection tasks might be a promising direction for
future research.
ACKNOWLEDGEMENTS
This research work contributes to the french
collaborative project TASV (autonomous passenger-
service train), with Railenium, SNCF, Alstom
Crespin, Thales, Bosch and SpirOps. It was carried
out in the framework of IRT Railenium, Valenciennes,
France, and therefore was granted public funds within
the scope of the French Program “Investissements
d’Avenir”.
REFERENCES
Abid, M. and Lefebvre, G. (2021). Improving indoor ge-
omagnetic field fingerprinting using recurrence plot-
based convolutional neural networks. Journal of Lo-
cation Based Services, 15(1):61–87.
Behley, J., Garbade, M., Milioto, A., Quenzel, J., Behnke,
S., Stachniss, C., and Gall, J. (2019). SemanticKITTI:
A dataset for semantic scene understanding of LiDAR
sequences. In Proceedings of the IEEE/CVF inter-
national conference on computer vision, pages 9297–
9307.
Boulch, A. (2020). ConvPoint: Continuous convolutions
for point cloud processing. Computers & Graphics,
88:24–34.
Choy, C., Gwak, J., and Savarese, S. (2019). 4D spatio-
temporal convnets: Minkowski convolutional neural
networks. In Proceedings of the IEEE/CVF con-
ference on computer vision and pattern recognition,
pages 3075–3084.
CloudCompare (2022). (version 2.12.2) [GPL software],
retrieved from http://www.cloudcompare.org/.
Compagnon, P., Lomet, A., Reyboz, M., and Mermillod, M.
(2023). Domestic hot water forecasting for individ-
ual housing with deep learning. In Machine Learning
and Principles and Practice of Knowledge Discovery
in Databases, pages 223–235.
Cordts, M., Omran, M., Ramos, S., Rehfeld, T., Enzweiler,
M., Benenson, R., Franke, U., Roth, S., and Schiele,
B. (2016). The cityscapes dataset for semantic urban
scene understanding. In Proceedings of the IEEE con-
ference on computer vision and pattern recognition,
pages 3213–3223.
Everingham, M., Eslami, S. A., Van Gool, L., Williams,
C. K., Winn, J., and Zisserman, A. (2015). The pascal
visual object classes challenge: A retrospective. In-
ternational journal of computer vision, 111:98–136.
Goyal, P., Doll
´
ar, P., Girshick, R., Noordhuis, P.,
Wesolowski, L., Kyrola, A., Tulloch, A., Jia, Y.,
and He, K. (2017). Accurate, large minibatch
SGD: Training ImageNet in 1 hour. arXiv preprint
arXiv:1706.02677.
Grandio, J., Riveiro, B., Soil
´
an, M., and Arias, P. (2022).
Point cloud semantic segmentation of complex rail-
way environments using deep learning. Automation in
Construction, 141:104425.
Guinard, S. A., Riant, J.-P., Michelin, J.-C., and
Costa D’Aguiar, S. (2021). Fast weakly supervised
detection of railway-related infrastructures in lidar ac-
quisitions. ISPRS Annals of the Photogrammetry, Re-
mote Sensing and Spatial Information Sciences, 2:27–
34.
Guo, Y., Wang, H., Hu, Q., Liu, H., Liu, L., and Ben-
namoun, M. (2021). Deep learning for 3d point
clouds: A survey. IEEE Transactions on Pattern Anal-
ysis and Machine Intelligence, 43(12):4338–4364.
Hackel, T., Savinov, N., Ladicky, L., Wegner, J. D.,
Schindler, K., and Pollefeys, M. (2017). Seman-
tic3d. net: A new large-scale point cloud classification
benchmark. arXiv preprint arXiv:1704.03847.
He, T., Zhang, Z., Zhang, H., Zhang, Z., Xie, J., and Li,
M. (2019). Bag of tricks for image classification with
convolutional neural networks. In Proceedings of the
IEEE/CVF conference on computer vision and pattern
recognition, pages 558–567.
Hu, Q., Yang, B., Xie, L., Rosa, S., Guo, Y., Wang, Z.,
Trigoni, N., and Markham, A. (2020). RandLA-Net:
Efficient semantic segmentation of large-scale point
clouds. In Proceedings of the IEEE/CVF conference
RailCloud-HdF: A Large-Scale Point Cloud Dataset for Railway Scene Semantic Segmentation
169

on computer vision and pattern recognition, pages
11108–11117.
Kaijaluoto, R., Kukko, A., El Issaoui, A., Hyypp
¨
a, J., and
Kaartinen, H. (2022). Semantic segmentation of point
cloud data using raw laser scanner measurements and
deep neural networks. ISPRS Open Journal of Pho-
togrammetry and Remote Sensing, 3:100011.
K
¨
olle, M., Laupheimer, D., Schmohl, S., Haala, N., Rotten-
steiner, F., Wegner, J. D., and Ledoux, H. (2021). The
hessigheim 3d (h3d) benchmark on semantic segmen-
tation of high-resolution 3d point clouds and textured
meshes from uav lidar and multi-view-stereo. ISPRS
Open Journal of Photogrammetry and Remote Sens-
ing, 1:100001.
Lamas, D., Soil
´
an, M., Grand
´
ıo, J., and Riveiro, B.
(2021). Automatic point cloud semantic segmentation
of complex railway environments. Remote Sensing,
13(12):2332.
Landrieu, L. and Simonovsky, M. (2018). Large-scale point
cloud semantic segmentation with superpoint graphs.
In 2018 IEEE/CVF Conference on Computer Vision
and Pattern Recognition, pages 4558–4567.
Manier, A., Moras, J., Michelin, J.-C., and Piet-Lahanier, H.
(2022). Railway lidar semantic segmentation with ax-
ially symmetrical convolutional learning. ISPRS An-
nals of the Photogrammetry, Remote Sensing and Spa-
tial Information Sciences, 2:135–142.
Milioto, A., Vizzo, I., Behley, J., and Stachniss, C. (2019).
RangeNet++: Fast and accurate lidar semantic seg-
mentation. In 2019 IEEE/RSJ international confer-
ence on intelligent robots and systems (IROS), pages
4213–4220. IEEE.
Neuhold, G., Ollmann, T., Rota Bulo, S., and Kontschieder,
P. (2017). The mapillary vistas dataset for seman-
tic understanding of street scenes. In Proceedings
of the IEEE international conference on computer vi-
sion, pages 4990–4999.
Qi, C. R., Su, H., Mo, K., and Guibas, L. J. (2017a). Point-
Net: Deep learning on point sets for 3D classification
and segmentation. In Proceedings of the IEEE con-
ference on computer vision and pattern recognition,
pages 652–660.
Qi, C. R., Yi, L., Su, H., and Guibas, L. J. (2017b). Point-
Net++: Deep hierarchical feature learning on point
sets in a metric space. Advances in neural informa-
tion processing systems, 30.
Roynard, X., Deschaud, J.-E., and Goulette, F. (2018).
Paris-lille-3d: A large and high-quality ground-truth
urban point cloud dataset for automatic segmenta-
tion and classification. The International Journal of
Robotics Research, 37(6):545–557.
Sergiyenko, O., Tyrsa, V., Zhirabok, A., and Zuev, A.
(2023). Sliding mode observer based fault identifi-
cation in automatic vision system of robot. Control
Engineering Practice, 139:105614.
Soil
´
an, M., N
´
ovoa, A., S
´
anchez-Rodr
´
ıguez, A., Riveiro, B.,
and Arias, P. (2020). Semantic segmentation of point
clouds with PointNet and KPConv architectures ap-
plied to railway tunnels. ISPRS Annals of the Pho-
togrammetry, Remote Sensing and Spatial Informa-
tion Sciences, 2:281–288.
Soil
´
an, S
´
anchez-Rodr
´
ıguez, R
´
ıo-Barral, Perez-Collazo,
Arias, and Riveiro (2019). Review of laser scan-
ning technologies and their applications for road and
railway infrastructure monitoring. Infrastructures,
4(4):58.
Thomas, H., Qi, C. R., Deschaud, J.-E., Marcotegui, B.,
Goulette, F., and Guibas, L. J. (2019). KPConv: Flex-
ible and deformable convolution for point clouds. In
Proceedings of the IEEE/CVF international confer-
ence on computer vision, pages 6411–6420.
Vallet, B., Br
´
edif, M., Serna, A., Marcotegui, B., and Papar-
oditis, N. (2015). Terramobilita/iqmulus urban point
cloud analysis benchmark. Computers & Graphics,
49:126–133.
Wu, B., Wan, A., Yue, X., and Keutzer, K. (2018). Squeeze-
seg: Convolutional neural nets with recurrent crf for
real-time road-object segmentation from 3d lidar point
cloud. In 2018 IEEE International Conference on
Robotics and Automation (ICRA), pages 1887–1893.
Zhang, R., Candra, S. A., Vetter, K., and Zakhor, A. (2015).
Sensor fusion for semantic segmentation of urban
scenes. In 2015 IEEE international conference on
robotics and automation (ICRA), pages 1850–1857.
VISAPP 2024 - 19th International Conference on Computer Vision Theory and Applications
170
