
Benchmarking Sensitivity of Continual Graph Learning for
Skeleton-Based Action Recognition
Wei Wei
1 a
, Tom De Schepper
1 b
and Kevin Mets
2 c
1
University of Antwerp - imec, IDLab, Department of Computer Science, Sint-Pietersvliet 7, 2000 Antwerp, Belgium
2
University of Antwerp - imec, IDLab, Faculty of Applied Engineering, Sint-Pietersvliet 7, 2000 Antwerp, Belgium
Keywords:
Continual Graph Learning, Action Recognition, Spatio-Temporal Graph, Sensitivity Analysis, Benchmark.
Abstract:
Continual learning (CL) is the research field that aims to build machine learning models that can accumulate
knowledge continuously over different tasks without retraining from scratch. Previous studies have shown
that pre-training graph neural networks (GNN) may lead to negative transfer(Hu et al., 2020) after fine-tuning,
a setting which is closely related to CL. Thus, we focus on studying GNN in the continual graph learning
(CGL) setting. We propose the first continual graph learning benchmark for spatio-temporal graphs and use it
to benchmark well-known CGL methods in this novel setting. The benchmark is based on the N-UCLA and
NTU-RGB+D datasets for skeleton-based action recognition. Beyond benchmarking for standard performance
metrics, we study the class and task-order sensitivity of CGL methods, i.e., the impact of learning order on
each class/task’s performance, and the architectural sensitivity of CGL methods with backbone GNN at various
widths and depths. We reveal that task-order robust methods can still be class-order sensitive and observe
results that contradict previous empirical observations on architectural sensitivity in CL.
1 INTRODUCTION
Continual Learning (CL) is a subfield of machine
learning. It aims to build deep learning models that
can continually accumulate knowledge over differ-
ent tasks without needing to retrain from scratch
(De Lange et al., 2021). Good CL performance can
not be achieved easily. The phenomenon of catas-
trophic forgetting (McCloskey and Cohen, 1989)
causes deep learning models to abruptly forget the in-
formation of past tasks, as they are no longer relevant
to current optimization objectives.
Many previous works propose new CL methods
to alleviate the catastrophic forgetting phenomenon
(Kirkpatrick et al., 2017) (Aljundi et al., 2018) (Li
and Hoiem, 2017) (Lopez-Paz and Ranzato, 2017)
(Rolnick et al., 2019) (Isele and Cosgun, 2018). In
comparison, the study on the sensitivity of CL perfor-
mances is relatively scarce (De Lange et al., 2021)
(Mirzadeh et al., 2022) (Bell and Lawrence, 2022)
(Lin et al., 2023). However, from these studies, we
already see a noticeable difference in performance,
measured by the average accuracy and forgetting met-
a
https://orcid.org/0000-0001-5651-8712
b
https://orcid.org/0000-0002-2969-3133
c
https://orcid.org/0000-0002-4812-4841
rics when the backbone architecture or the learning
order changes.
Research on graph neural networks (GNN) in-
creased lately due to the availability of graph-
structured data (Wu et al., 2020). However, continual
graph learning (CGL) is still underexplored (Febri-
nanto et al., 2023). Previous studies show that pre-
training GNNs is not always beneficial and may lead
to negative transfer on downstream tasks after fine-
tuning (Hu et al., 2020). This is contrary to the ob-
servations in transfer learning with CNNs (Girshick
et al., 2014). We note that training a model in a CGL
setting without CGL methods is equivalent to fine-
tuning the model. As GNNs show empirically worse
performance on fine-tuning compared to CNNs, they
may also have unique properties in CGL. This moti-
vates our research on the sensitivity of the CL/CGL
methods with graph-structured data and GNNs. Cur-
rent CGL benchmarks (Zhang et al., 2022) (Ko et al.,
2022) cover many types of graphs, however, temporal
graphs have not yet been benchmarked. Our bench-
mark uses skeleton-based action recognition datasets
with spatio-temporal graphs, extending current CGL
benchmarks.
In CL, the method must learn to discriminate be-
tween a growing number of classes. Often, a sequence
Wei, W., De Schepper, T. and Mets, K.
Benchmarking Sensitivity of Continual Graph Learning for Skeleton-Based Action Recognition.
DOI: 10.5220/0012394400003660
Paper published under CC license (CC BY-NC-ND 4.0)
In Proceedings of the 19th International Joint Conference on Computer Vision, Imaging and Computer Graphics Theory and Applications (VISIGRAPP 2024) - Volume 2: VISAPP, pages
639-651
ISBN: 978-989-758-679-8; ISSN: 2184-4321
Proceedings Copyright © 2024 by SCITEPRESS – Science and Technology Publications, Lda.
639

(a) Example of task order shuffling, tasks have same classes.
(b) Example of class order shuffling, tasks have random
classes.
Figure 1: The accuracy for each class fluctuates when the task/class order for CGL changes. Classes within one task can have
large accuracy differences (Fig. 1a, class 2/3). This is not captured by task-order sensitivity. Images from (Wang et al., 2014).
of classification tasks with disjoint classes is used
(van de Ven et al., 2022). Previous literature often
focuses on task-incremental learning (task-IL), where
the task identifier is explicitly provided to the model
during the train and test phases. We focus on class-
incremental learning (class-IL), where the task iden-
tifier is not provided to the method. The method must
learn to distinguish between all seen classes, i.e. the
method needs to solve each task and identify which
task a sample belongs to. The class-IL setting is more
difficult but also more realistic, since we do not al-
ways have a task identifier associated with the col-
lected data.
Our work focuses on benchmarking the perfor-
mance, as well as the order and architectural sensitiv-
ity of the CGL methods. We measure the order sen-
sitivity by training CGL methods on randomly shuf-
fled task or class order and compute the correspond-
ing metrics. Fig. 1a is an example of a shuffled task
order: We pre-define a set of tasks with corresponding
classes, e.g. Task X will contain samples of classes 0
and 1, and task Y will contain samples of classes 2
and 3. In contrary, Fig. 1b shows a randomly shuffled
class order. Here, tasks are constructed with random
classes. Task X may consists of classes 0 and 5 in
one class order experiment, but will contain samples
of other classes in another class order experiment.
We observe that the accuracy of each class differs
noticeably as the learning order changes. The large
difference denotes the high class-order sensitivity of
the CGL method. In contrast to standard sensitivity
benchmarks, which measures the fluctuation of the
average accuracy computed across the tasks/classes.
We measure the order sensitivity proposed by (Yoon
et al., 2020) and extend the setting to two differ-
ent scenario: task-order sensitivity and class-order
sensitivity separately. They measure the impact of
learning order on the performance each specific task
or class. This can help with assessing whether the
past tasks/classes will have equal performance when
a CL/CGL model is deployed in real world setting,
where we do not have control over the order of arrival
for the tasks/classes. It is important for the application
where fairness is crucial.
Our contributions are as follows:
• To the best of our knowledge, we are the first
to benchmark CGL methods for tasks involving
spatio-temporal graphs, such as skeleton-based
action recognition, in class-IL setting. It requires
the model to predict using input across multiple
timestamps. This is not covered in previous CGL
benchmarks (Zhang et al., 2022) (Ko et al., 2022).
We benchmark different CGL methods on two
datasets, covering primitive movements to daily
activities.
• We extend the order sensitivity issue proposed by
(Yoon et al., 2020) to two different setting: task-
order sensitivity and class-order sensitivity. By
comparing the result of both settings, we can cap-
ture the imbalance of performance of the classes
within the same task as in Fig. 1a.
• We present extensive empirical experiments on
the order and architectural sensitivity of well-
known CGL methods. I.e., the performance fluc-
tuation for each task/class when the learning
order changes, and the performance fluctuation
when the backbone architecture changes. We are
the first to study the class-order sensitivity of the
CGL methods. We demonstrate that task-order
robust methods can still be class-order sensitive.
The scale of our experiment on order sensitivity
is larger than in any previous works. Our work
provides a comprehensive view of the order sen-
sitivity of the experimented CGL methods and a
setup for benchmarking CGL methods’ sensitivity
in class-IL on skeleton-based action recognition.
• We study the correlation between the two most
used evaluation metrics in CGL: Average Forget-
ting (AF) and Average Accuracy (AA). We pro-
VISAPP 2024 - 19th International Conference on Computer Vision Theory and Applications
640

pose a theorem that defines the upper bound of AF
when AA is given. We visualize this in our results.
• We compare the result of our benchmark with pre-
vious empirical studies in CL and demonstrate the
difference in architectural sensitivity when graph-
structured data are used instead of Euclidean data.
2 RELATED WORKS
CGL Benchmarks. (Zhang et al., 2022) created
a benchmark for CGL methods based on public
datasets. It includes both node-level and graph-level
prediction tasks in class-IL or task-IL CGL. (Ko et al.,
2022) extends the benchmark to include edge-level
prediction tasks, as well as tasks that use differ-
ent CGL setting, such as domain-incremental learn-
ing or time-incremental learning. However, the data
used in these benchmarks do not contain the tempo-
ral dimension. Our benchmark implements skeleton-
based action recognition datasets that contain spatio-
temporal graphs. It requires the model to reason over
multiple timestamps of human skeleton-joint coordi-
nates for accurate prediction. We note that the time-
incremental learning in (Ko et al., 2022) refers to
creating tasks based on the timestamp of the data,
the data itself do not contain a temporal dimen-
sion. Moreover, not all benchmarks consider different
task/class orders. Our benchmark experiments with
different orders and we report the order sensitivity.
Task-Order Sensitivity. (Yoon et al., 2020) proposed
the problem of task-order sensitivity, where the CL
performance for each task fluctuates when the order
of tasks changes. They defined the Order-normalized
Performance Disparity (OPD) metric to evaluate it
and reported that the tested CL methods have a high
task-order sensitivity. (Bell and Lawrence, 2022)
studied the significance of task orders for CL per-
formance. They used synthetic data to find the best
task order by calculating the distance between the
tasks and proposed a way to estimate task distances
using datasets such as MNIST using gradient curva-
ture. They found that reordering the tasks to create the
largest total task distances yields better results. We
note that we do not always have control over task or-
der, thus, the study of task-order sensitivity is neces-
sary. (Lin et al., 2023) theorized the catastrophic for-
getting effect in task-IL. One of the conclusions is that
the best task order for minimizing forgetting tends to
arrange dissimilar tasks in the early stage of CL. This
corresponds with (Bell and Lawrence, 2022). Further,
other works studied the impact of different task orders
in task-incremental CL setting too (De Lange et al.,
2021) (Li et al., 2022). Our work distinguishes from
them by considering the more difficult class-IL CGL.
Except for (Yoon et al., 2020), these works only
consider the sensitivity of the average accuracy and
average forgetting, calculated across the tasks, but not
the order sensitivity defined in (Yoon et al., 2020),
where the performance of each task is evaluated sep-
arately. Our work additionally benchmarks this prob-
lem extensively, and on the more fine-grained class
level, revealing another problem that real-world ap-
plicable CL methods need to solve.
Class-Order Sensitivity. Class-order sensitivity is
the problem where the CL performance per class
varies when the classes within each task change.
(Masana et al., 2020) experimented with different
class ordering. They constructed task sequences with
increasing or decreasing difficulty in class-IL. They
found that, for different CL methods, optimal perfor-
mance is achieved using different class ordering. (He
et al., 2022) studied with a dataset where classes can
be grouped as superclasses. They reported that cre-
ating tasks with classes from different superclasses
yields better CL performance. These two works only
consider a limited number of class orders. Our work
generates 100 random class orders, group classes ad-
jacent in the generated order into tasks, and perform
class-IL CGL based on the modified tasks to approx-
imate the class-order sensitivity of the CGL methods.
Next, these works aim to find the best class order to
increase the CL performance but omit the evaluation
of performance changes for each class. Our work
considers the performance change per class to assess
the fairness of the CGL method in real-world applica-
tions.
Impact of Network Architecture on CL. (Good-
fellow et al., 2013) showed that adding a dropout
layer to feed-forward networks improves CL perfor-
mance. (De Lange et al., 2021) expanded the research
by additionally reporting the experimental results for
4 models with different widths and depths with CL
methods on VGG and AlexNet-based architectures.
They observed that (too) deep models do not have
high accuracy, while wider models often perform bet-
ter. However, a wider model has a higher risk of over-
fitting on the first task. (Mirzadeh et al., 2022) stud-
ied the impact of different architectures and building
blocks on CL performance. They used existing state-
of-the-art (SOTA) computer vision architectures such
as ResNet (He et al., 2016) and Vision Transformers
(Dosovitskiy et al., 2021). They observed that wide
and shallow networks often outperform thin and deep
networks in CL. Our work conducts architectural sen-
sitivity experiments using GNNs, which react differ-
ently for transfer learning (Hu et al., 2020). We also
report the evolution of the performances with growing
Benchmarking Sensitivity of Continual Graph Learning for Skeleton-Based Action Recognition
641

depth and width.
Continual Action Recognition. To the best of our
knowledge, Else-Net (Li et al., 2021) is the only pre-
vious literature which studied CGL with action recog-
nition. They used the domain-incremental setting,
where the subject / viewpoint is used to create tasks.
This is a simpler setting as each task includes data
samples of all classes. Our work evaluates CGL meth-
ods in the task and class incremental setting, where
each task only contains unseen human actions.
3 PRELIMINARIES
3.1 Class-Incremental Learning
We use a similar definition of class-IL like (Zhou
et al., 2023). Class-IL aims to learn from an evo-
lutive stream with incoming new classes (Rebuffi
et al., 2017). We assume a sequence of B tasks:
{D
1
, D
2
, D
3
, ...D
B
}. D
b
= {(x
b
i
, y
b
i
)}
n
b
i=1
denotes the b-
th incremental training task with n
b
graph-structured
data instances. Each task D contains data instances
from one or more classes c ∈ C. We denote function
Cls as a function that maps the task to the classes of
the data instances it contains. The classes in each task
D do not overlap with any other tasks defined in the
sequence. Thus:
Cls(D
a
) ∩Cls(D
b
) =
/
0, ∀a, b ∈ {1, ..., B}, a ̸= b (1)
During the b-th incremental training process, the
model only has access to the data instances from
the current task D
b
. After each incremental training
process, the model is evaluated over all seen classes
C
b
seen
= Cls(D
1
) ∪ ... ∪Cls(D
b
). Class-IL aims to find
the model f (x) : X 7→ C which minimizes the loss over
all the tasks in the task sequence.
3.2 Metrics
We define AA and AF as in (Chaudhry et al., 2018)
and the OPD metrics as in (Yoon et al., 2020), which
is used to measure order sensitivity.
Average Accuracy (AA). The accuracy a
k, j
∈ [0, 1]
is evaluated on the test set of task j after training the
model from task 1 to k. The average accuracy of the
model after incrementally training up to task k is:
AA
k
=
1
k
k
∑
j=1
a
k, j
(2)
Average Forgetting (AF). The average forgetting
metric is defined on top of the average accuracy met-
ric. First, we define forgetting for a single task j as:
f
k
j
= max
l∈{1,...,k−1}
a
l, j
− a
k, j
, ∀ j < k (3)
f
k
j
∈ [−1, 1] denotes the forgetting of task j after
learning task k. Next, we define the average for-
getting for a model after learning task k as: AF
k
=
1
k−1
∑
k−1
j=1
f
k
j
.
Order-normalized Performance Disparity (OPD).
order-normalized performance disparity is defined as
the disparity between the model performance for a
task k on R random task orders. I.e., it measures the
impact of the task order on the performance of each
task. Following (Yoon et al., 2020), we use accuracy
to denote the model’s performance:
OPD
t
= max(a
1
B,t
, ..., a
R
B,t
) − min(a
1
B,t
, ..., a
R
B,t
) (4)
Where a
r
B,t
denotes the accuracy of task t after learn-
ing the full task sequence of length B in the random
task order r. The maximum OPD (MOPD) is defined
as MOPD = max(OPD
1
, ..., OPD
B
) and the average
OPD (AOPD) is defined as AOPD =
1
B
∑
B
t=1
OPD
t
.
We use this metric to report the task-order sensitivity.
We adopt the same formula for class-order sensitivity,
but instead of using task-wise accuracy, we will use
the accuracy of the individual class.
3.3 Continual Learning Methods
We used popular CL/CGL methods for our experi-
ments. We refer to (Febrinanto et al., 2023) for the
taxonomy.
Regularization-based methods prevent catas-
trophic forgetting by preserving weights from the
previous model based on their importance. We
have chosen EWC (Kirkpatrick et al., 2017), MAS
(Aljundi et al., 2018) and TWP (Liu et al., 2021).
EWC approximates the weight importance using the
Fisher information matrix. MAS uses the sensitivity
of the output to a change in weight as importance.
TWP is designed specifically for CGL, it extends
MAS by additionally measuring the sensitivity of
neighborhood topology changes when computing
importance. Knowledge distillation-based methods
preserve the output from the previous model. We
have chosen LwF (Li and Hoiem, 2017) for the
experiments.
Rehearsal-based methods preserve past data in-
stances and replay them frequently during the learn-
ing of new tasks. We have chosen GEM (Lopez-Paz
and Ranzato, 2017), which is a hybrid of rehearsal
and regularization-based methods. GEM stores a part
of past data samples and regularizes the gradient to
ensure that the loss of the stored samples does not in-
crease.
Next, we implement a simple, purely rehearsal-
based CGL method. It stores x% of the data instance
of each task as a memory buffer. The data instances
VISAPP 2024 - 19th International Conference on Computer Vision Theory and Applications
642

in the buffer are mixed with the data instances from
the new tasks and replayed to the model. This strat-
egy is denoted as REPLAY in the results of our ex-
periments. We report the hyperparameter, the search-
strategy, and the run times of the methods in Ap-
pendix C.
Architectural-based methods modify the architec-
ture dynamically to prevent catastrophic forgetting.
As one of our focuses is architectural sensitivity, we
did not include architectural-based methods in our
study.
Finally, we implement the BARE and JOINT base-
line. BARE baseline trains a deep learning model
without any CGL method, models trained by this
baseline will suffer catastrophic forgetting. It is used
as the lower bound. JOINT baseline trains a deep
learning model by accumulating all available past
data, it is equivalent to REPLAY which stores 100%
of the data as buffer. JOINT baseline is used as the
upper bound.
4 EXPERIMENT SETUP
In this section, we introduce our experimental setup,
including the datasets, our experiments, and their
goals. We provide the parameters for each experiment
in Appendix B and Appendix C.
4.1 Visualization
To facilitate compact sharing of our experiment re-
sults, we visualize them using the scatter plot with AA
on the x-axis and AF on the y-axis. This visualiza-
tion is advantageous compared to standard mean and
variance reporting, as we can observe the exact dis-
tribution across different experiments. E.g, in Fig. 2,
we observe two clusters of red points, one cluster has
lower AA as they end with a difficult task. Moreover,
we visualize the theoretical upper bound of AF for
any given AA by proposing Theorem 1. This shows
that an improvement of AA will also improve AF by
lowering its upper bound. The proof is provided in
Appendix A.
Theorem 1. Let AA
k
be the average accuracy of the
model after incrementally learning up to task k in
class-IL. Then, the following inequation denotes the
upper bound of AF
k
.
AF
k
≤ 1 −
k
k − 1
AA
k
+
1
k − 1
a
k,k
(5)
Figure 2: Example scatter plot of AA and AF. The dotted
green diagonal line shows the theoretical upper bound of
AF.
4.2 Datasets
We implement two different action recognition
datasets on our benchmark to cover different com-
plexity of classes and tasks. N-UCLA (Wang et al.,
2014) covers primitive movements, e.g. walk, pick
up. NTU-RGB+D (Shahroudy et al., 2016) cov-
ers daily activities, e.g. drink water, eat meal. We
only used the first 10 classes from NTU-RGB+D for
the construction of our class-IL CGL variant of the
dataset so that both dataset has the same number of
classes and tasks. We use the data processing proto-
col in (Chen et al., 2021) for both datasets.
We created tasks based on the classes of the data
samples. Each task contains two classes and is di-
vided into train, val, and test set with 8:1:1 ratio. The
detailed information of the datasets is presented in
Tab. 1. The dataset will be released to facilitate fu-
ture research.
4.3 Backbone Graph Neural Networks
Most of the CL/CGL methods require a backbone
neural network. We use GCN (Kipf and Welling,
2017) and ST-GCN (Yan et al., 2018) as backbone
GNNs. GCN is the foundational GNN that is used
for many SOTA graph learning tasks. ST-GCN is a
specialized GNN for the task of skeleton-based action
recognition. Appendix B contains the implementation
details.
Table 1: Constructed class-incremental CGL dataset.
Dataset UCLA-CIL NTU-CIL
Data source
N-UCLA
(Wang et al., 2014)
NTU-RGB+D
(Shahroudy et al., 2016)
# action seq. 1484 6667
# joints 20 25
# classes 10 10
# tasks 5 5
avg. # seq./task 297 1333
# frame/seq. 52 300
Benchmarking Sensitivity of Continual Graph Learning for Skeleton-Based Action Recognition
643
4.4 Experiments
We introduce our experiments with their objectives
and present the results in Sec. 5.
4.4.1 Order Sensitivity
The goal of the order sensitivity experiments is to test
the variance of CGL performance for each task indi-
vidually when the order of tasks or classes is undeter-
mined. The performance of each task is measured by
AA, and the order sensitivity is measured by OPD.
We execute two types of experiments to test the
order sensitivity empirically. In the task-order sensi-
tivity experiment, we randomly shuffle the order in
which the tasks are presented, without perturbing the
class that constructs the tasks. In the class-order sen-
sitivity experiment, we randomly shuffle the order in
which the classes are presented to construct the tasks.
I.e., tasks are constructed with random classes. This
tests both the impact of task learning order and the
impact of task difficulty. The class-order sensitivity
experiment is more difficult and closer to real-world
setting, as real-world data often arrive in random or-
der. The OPD of task-order sensitivity is computed
via task-level average accuracy, while the OPD of
class-order sensitivity is computed via the accuracy
of each class.
We note that a task order can be transformed into
a class order. E.g., a task order {1, 2, 3, 4, 5} is equiv-
alent with the class order {0, 1, 2..., 8, 9}. Thus, we
aggregated the results of both experiments to obtain a
more accurate approximation of class-order sensitiv-
ity.
4.4.2 Architectural Sensitivity
The architectural sensitivity experiment aims to test
the performance stability of the CGL methods with
different widths and depths of the backbone network.
We measure this by observing the evolution of AA and
AF with different GNN architecture.
Although previous studies (De Lange et al., 2021)
(Mirzadeh et al., 2022) report that a wide and shallow
architecture often outperforms thin and deep architec-
tures, the evolution of performance changes is never
reported. We experiment with a gradual change in
model width and depth and report the results for each
step. This information is useful to determine the trend
of performance changes.
5 RESULTS
5.1 Task-Order Sensitivity
We first discuss the task-order sensitivity experiment.
As we only have 5 tasks for our datasets, we have
5! = 120 different task orders. We experimented with
all 120 task orders with GCN as backbone and visu-
alized their AA and AF in Fig. 3. The result of ST-
GCN are visualized in Fig. 4. We restrain ourselves
of extensively experimenting ST-GCN on the NTU-
CIL dataset, as all the regularization-based methods
performed on-par with the BARE baseline in the sim-
pler UCLA-CIL dataset. Our results are sufficient to
support the hypothesis. The explanation given below
applies to both backbones as the results share similar
trends. We note that order sensitivity does not apply
to the JOINT baseline, as JOINT will be training on
all available data in the end, changing the class/task
order will have little effect. Thus, we did not train
JOINT for order sensitivity experiments.
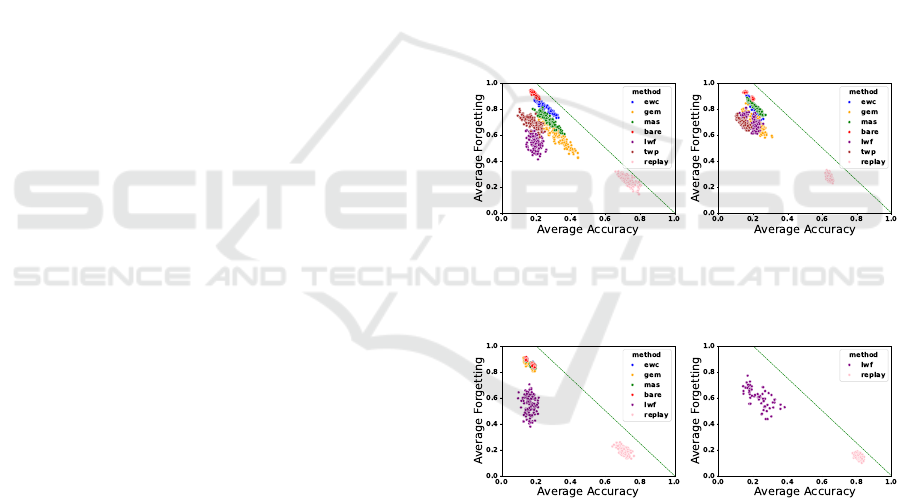
(a) UCLA-CIL (b) NTU-CIL
Figure 3: Scatter plot of AA and AF for task-order experi-
ment with GCN.
(a) UCLA-CIL (b) NTU-CIL
Figure 4: Scatter plot of AA and AF for task-order experi-
ment with ST-GCN.
From Fig. 3, we observe clear clusters for differ-
ent methods in UCLA-CIL. Moreover, different meth-
ods exhibit different characteristics. Regularization-
based methods are sensitive for the performance met-
ric AA, while LwF and REPLAY are more stable. In-
terestingly, we see that GEM performed significantly
worse and is more sensitive compared to REPLAY,
even though they store the same fraction of the past
data as buffer. This could mean that regularization-
based methods do not prevent catastrophic forgetting
VISAPP 2024 - 19th International Conference on Computer Vision Theory and Applications
644

as well as rehearsal-based methods in skeleton-based
action recognition, where the data from the different
action classes looks vastly different. We hypothe-
size that none of the CGL methods learns features in
the first task that can be generalized for the full task
space. However, REPLAY can escape the local mini-
mum faster because it does not rely on the output or
weights of previous models. This leads to better gen-
eralization and a higher AA of REPLAY. This phe-
nomenon can also be observed in Fig. 4a. All the reg-
ularization based methods have low AA as the embed-
dings they learn are not generalizable to other tasks.
Next, as proven by Theorem 1, changes in AA low-
ers the upper bound of AF. From Fig. 3a, we observe
a linear correlation between the increase in AA and
the decrease in AF, this hints the correlation between
AA and AF. However, we observe in Fig. 3a differ-
ent levels of AF when the AA of the different meth-
ods are similar. We suspect that it indicates regular-
ization strength of the different regularization-based
CGL methods under the scenario when the embed-
dings are not generalizable, i.e., when the model over-
fits to previous tasks. MAS computes the sensitivity of
the output to each weight. When the model overfits,
the output will likely be very sensitive to a subset of
weights. MAS regularizes the model more on these
weights, hindering the learning of new tasks. This
reduces the maximum AA of the new tasks, thus re-
ducing AF. In NTU-CIL, where overfitting is less
likely due to a larger sample size, AF of MAS is com-
parable to EWC. TWP has an extra regularization
on top of MAS that preserves the topology. How-
ever, SOTA GNNs on skeleton-based action recog-
nition (Chen et al., 2021) show that using different
topologies is beneficial to prediction accuracy. Thus,
the AF of TWP is lower than MAS when their AA are
similar. Finally, GEM prevents the loss increment of
the stored samples. When model overfits to past tasks,
GEM is unable to unlearn it. This is reflected in the
lowest AF in both datasets. In the end, LwF’s AF is
very sensitive to the task order. The features learned
in the first task influence the learning of following
tasks heavily. When the difference between the tasks
is large, the features learned by the old model may not
be important for the new task. In that case, the output
of the old model can be unstable. Thus, the regular-
ization strength of LwF depends on the similarity of
past and current tasks. A change in task order will
influence this, and indirectly influence AF too. The
highest AF for LwF is obtained by the task order that
starts with tasks with many leg movements, and ends
with tasks that have minimal leg movements, while
the task order with the lowest AF has to alternate be-
tween tasks with many or minimal leg movements.
We note that, a low AF can be achieved by lowering
the maximum AA or raising the minimum AA of each
task during the CGL process. The phenomenon here
corresponds to the former case. It does not improve
the usability of the CGL model and is undesirable.
Then, we study the task-order sensitivity by ob-
serving the OPD metric. OPD is calculated over 120
random task-orders and 220 random class-orders, we
repeated the experiment 5 times, obtaining 5 OPD
metrics. We report the mean and standard deviation
in Tab. 2. Regularization-based methods are highly
task-order sensitive in UCLA-CIL, while LwF and
REPLAY are comparatively less sensitive. EWC, MAS
and GEM achieved 100% MOPD, which denotes that
there exist two task orders and a task A, where task
A has 100% AA in one order, and 0% in another or-
der. This behavior is not desirable for CL methods.
As regularization-based methods only constrain the
learnable weights, it is expected that the last learned
tasks will have higher performances. When the tasks
are sufficiently different, the weight will shift far
enough so that the older tasks are forgotten. In com-
parison, LwF and REPLAY alter the gradient of the
model by resp. knowledge distillation and rehearsal.
By modifying the gradient using other means than
constraints, the model has more freedom and may find
a loss region where it generalizes to both present and
past tasks.
In NTU-CIL, we see an improvement in task-
order robustness for many methods, except LwF. In-
creased task complexity decreases the chance of over-
fitting, which facilitates the regularization process and
REPLAY as they learn generalizable embedding that
can be reused by following tasks. We observe two
distinguishable clusters for LwF and BARE baseline,
when we compare the task orders which form the two
clusters, we find them to be identical. Moreover, the
cluster with higher AA always ends with task 0 or 1.
The classes for these tasks are resp. {drink water,
eat meal} and {brush teeth, brush hair}. Based on
our earlier hypothesis, large difference between tasks
hinders LwF the most. In NTU-CIL, both primitive
movement and daily actions exists, thus the models
that learned the primitive movement may not focus
on the finer movements that identifies daily actions.
This makes the knowledge distillation between old
and new models unstable and potentially destructive
during the learning process of the new task, which
makes LwF order sensitive.
5.2 Class-Order Sensitivity
We test 100 different class orders for each CGL
method in both datasets. We aggregate the results
Benchmarking Sensitivity of Continual Graph Learning for Skeleton-Based Action Recognition
645
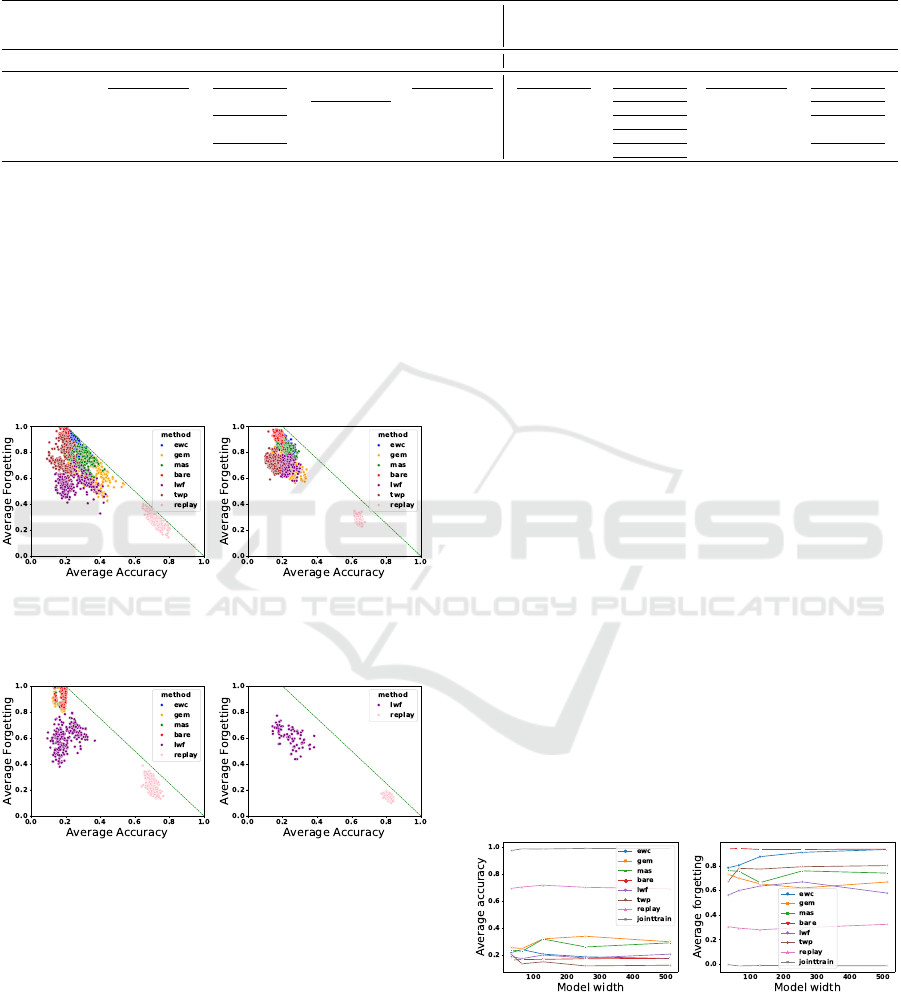
Table 2: Order sensitivity measured by OPD for experiments with a GCN backbone. Bold entries are the lowest OPDs, un-
derlined entries are the highest OPDs, excluding the BARE baseline. The OPD metric in the class-order sensitivity experiment
is based on the accuracy of the classes. All the methods are order sensitive, there is a large difference in task-order sensitivity
and class-order sensitivity.
task-order sensitivity experiment aggregated class-order sensitivity experiment
method\Setting UCLA-CIL NTU-CIL UCLA-CIL NTU-CIL
AOPD(↓) MOPD(↓) AOPD(↓) MOPD(↓) AOPD(↓) MOPD(↓) AOPD(↓) MOPD(↓)
BARE 96.74%±0.72% 100.0%±0.0% 92.91%±0.38% 99.24%±0.0% 100.0%±0.0% 100.0%±0.0% 99.73%±0.06% 100.0%±0.0%
EWC 93.94%±0.56% 100.0%±0.0% 85.36%±0.88% 94.24%±1.23% 100.0%±0.0% 100.0%±0.0% 98.12%±0.49% 100.0%±0.0%
MAS 89.46%±1.6% 98.7%±1.61% 87.88%±0.51% 95.61%±1.3% 99.73%±0.33% 100.0%±0.0% 97.61%±0.4% 100.0%±0.0%
TWP 85.39%±1.93% 100.0%±0.0% 77.45%±1.4% 89.24%±1.11% 99.3%±0.45% 100.0%±0.0% 95.73%±0.74% 100.0%±0.0%
LwF 63.21%±2.46% 75.04%±6.46% 78.36%±1.1% 93.48%±1.13% 93.44%±1.46% 100.0%±0.0% 94.0%±0.61% 98.79%±0.61%
GEM 83.89%±1.45% 100.0%±0.0% 80.91%±0.25% 94.09%±0.88% 99.59%±0.33% 100.0%±0.0% 95.36%±0.49% 100.0%±0.0%
REPLAY 58.21%±7.54% 80.25%±5.2% 39.52%±0.94% 53.18%±2.41% 82.54%±4.56% 100.0%±0.0% 50.52%±1.16% 71.82%±2.27%
from both experiments to obtain a more accurate
class-order sensitivity of the CGL methods as men-
tioned in Sec. 4.4.1, the metrics are visualized in
Fig. 5 and Fig. 6. Fig. 6b contains partial results, as
mentioned above.
Limitation. 100 random class order is only a small
subset of all possible class orders, for our datasets,
there will be 10! different class orders. It is not fea-
sible to experiment on all the class orders, thus, our
result only approximates the class-order sensitivity.
(a) UCLA-CIL (b) NTU-CIL
Figure 5: Scatter plot of AA and AF for class and task-order
experiments with GCN.
(a) UCLA-CIL (b) NTU-CIL
Figure 6: Scatter plot of AA and AF for class and task-order
experiments with ST-GCN.
In Fig. 6, we observe the same phenomenon where
the regularization-based methods have a low AA for
ST-GCN, which leads to the same hypothesis that
non-generalizable embeddings are learned. In Fig. 5,
we observe that, with randomized class order, the
cluster of results is vastly different compared to the
randomized task order. However, the trends are con-
sistent with the previous experiment: EWC and TWP
perform the worst, GEM, MAS and LwF perform bet-
ter, and REPLAY performs the best. Surprisingly,
we see that all methods are class-order sensitive in
UCLA-CIL by observing the OPD metric in Tab. 2.
The OPD of task-order sensitivity is computed via
task-level accuracy, while the OPD of the class-order
sensitivity is calculated using the accuracy of each
class. A large difference between the two denotes that
the accuracy of classes within the task are not equal.
An example can be observed in Fig. 1, in task Y , the
accuracy of class 2 is much worse than the accuracy
of class 3. Previous evaluation setting proposed by
(Yoon et al., 2020) can not detect this issue as the per-
formance is evaluated at task level. Our evaluation
setting is at the more fine-grained class level.
We hypothesize that this is caused by the unbal-
anced features used to identify the classes. The model
may learn many features to identify one class and only
a few features for the other classes. The latter class
is more prone to catastrophic forgetting. Our results
demonstrate that a task-order robust method can still
have classes with bad performances, which is an issue
in real-life settings where fairness is crucial.
5.3 Architectural Sensitivity
We test the architectural sensitivity for the perfor-
mance of the CGL models by increasing model
width/depth using a GCN as backbone. We report the
width evolution in Fig. 7 and depth evolution in Fig. 8.
(a) UCLA-CIL, AA (b) UCLA-CIL, AF
Figure 7: Evolution of the metrics when GCN width varies.
Previous studies in CL (De Lange et al., 2021)
(Mirzadeh et al., 2022) establish that a wide and shal-
low network outperforms a thin and deep network.
Our results with GNNs contradict their observations.
VISAPP 2024 - 19th International Conference on Computer Vision Theory and Applications
646
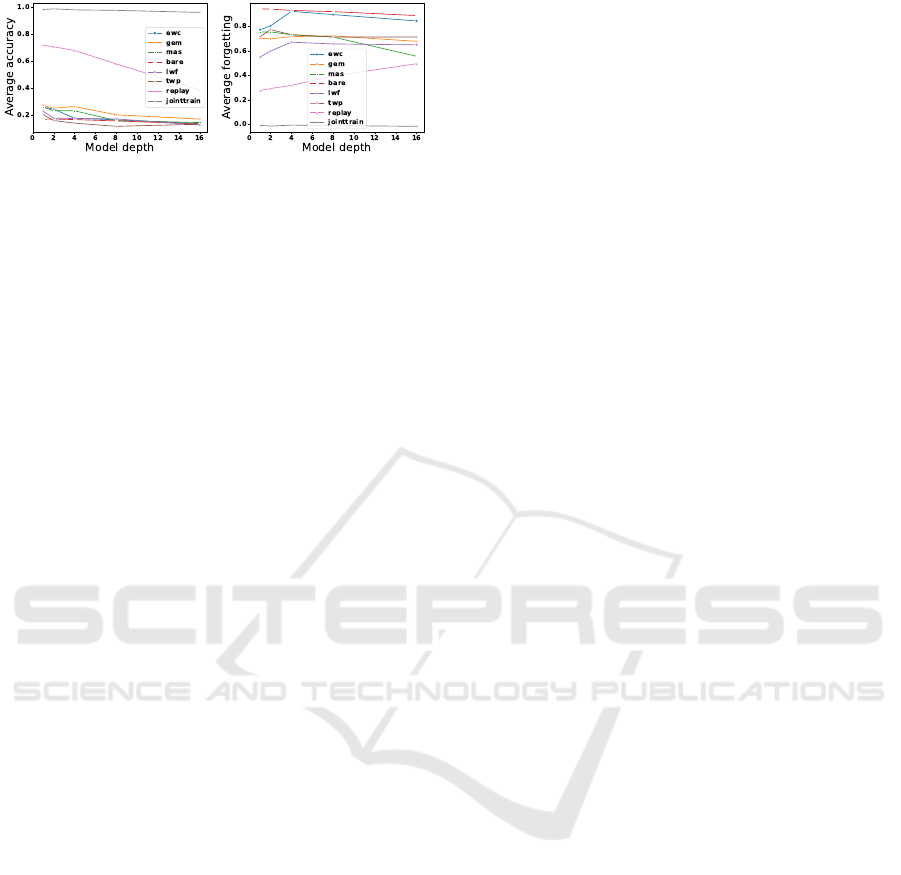
(a) UCLA-CIL, AA (b) UCLA-CIL, AF
Figure 8: Evolution of the metrics when GCN depth varies.
Increasing the width does not always show gains,
the effect of increasing depth is only consistent for
REPLAY.
We hypothesize that it is caused by the combina-
tion of GNN and skeleton-based action recognition
tasks. The skeleton-joint graph input is connected
sparsely. There are 10 edges between the left hand
and left foot node. This makes shallow GNNs un-
able to capture high-level features that require infor-
mation from both hand and foot movements, e.g.,
touching foot. Previous work (Dwivedi et al., 2022)
shows that GCN does not capture long-ranged infor-
mation well. Our width sensitivity experiment uses 2-
layer GNNs, which means that it can not produce the
abovementioned features. Increasing the width only
worsens the over-fitting of the tasks. This hypothe-
sis also explains why increasing the depth does not
always lead to worse performance, deeper GNNs can
capture long-ranged information, creating more gen-
eralizable features, which increases the performance.
This can be observed in Fig. 8b, we see a downward
trend of AF for most regularization-based methods as
well as the BARE baseline. However, increasing the
depth also worsens the overfitting effect due to the
increased expressiveness. The over-squashing phe-
nomenon also prevents the model from learning high-
level features (Alon and Yahav, 2021). This is most
noticeable in REPLAY, where the overfitting can oc-
cur on both the current task and on the buffers of the
past tasks. Thus, contrary to observation in previous
work, for skeleton-based action recognition, increas-
ing the width is not useful for shallow GNNs, and in-
creasing the depth may have some benefits. This ob-
servation motivates future studies in deep-GNNs and
their applications in the spatio-temporal graphs.
6 CONCLUSION
We constructed the first Continual Graph Learning
(CGL) benchmark for spatio-temporal graphs. We are
the first to benchmark skeleton-based action recogni-
tion in class-incremental learning (class-IL) setting.
We extended the order sentivity issue proposed by
(Yoon et al., 2020) to two different settings: task-
order sensitivity and class-order sensitivity. By com-
paring the order sensitivity at both task and class level,
we captured the imbalance of performance between
the classes within the same task, which is an unex-
plored problem in CGL. We conducted extensive ex-
periments on the task and class-order sensitivity of the
popular CGL methods. We discovered that the task-
order robust methods can still be class-order sensitive,
i.e., in some tasks, there are classes which outper-
forms the other classes. Next, we show that popular
CGL methods are all order sensitive, i.e. the perfor-
mance of each task/class dependents on the learning
order.
We also studied the architectural sensitivity. We
report the evolution of AA and AF when the depth
and width of the backbone GNN varies. Our results
contradict previous empirical observations in CL. We
provided our insight on the contradiction.
We studied the correlations between average for-
getting (AF) and average accuracy (AA), identified the
upper-bound of AF, demonstrated that an improve-
ment of AA naturally lowers the upper-bound of AF
and visualized it in our results.
The studies in order and architectural sensitivity
are still underexplored in class-IL CGL. Our paper is
an introduction to these two issues. Future works are
1) Expand the benchmark to include node-level and
edge-level tasks. 2) Investigate the intuitions to pro-
pose class-order robust CGL methods. We hope that
our paper initiates further research on the sensitivities
of CGL methods.
ACKNOWLEDGEMENTS
This research received funding from the Flemish
Government under the “Onderzoeksprogramma Arti-
fici
¨
ele Intelligentie (AI) Vlaanderen” programme.
REFERENCES
Aljundi, R., Babiloni, F., Elhoseiny, M., Rohrbach, M.,
and Tuytelaars, T. (2018). Memory aware synapses:
Learning what (not) to forget. In Proceedings of
the European conference on computer vision (ECCV),
pages 139–154.
Alon, U. and Yahav, E. (2021). On the bottleneck of graph
neural networks and its practical implications. In
9th International Conference on Learning Represen-
tations, ICLR 2021, Virtual Event, Austria, May 3-7,
2021. OpenReview.net.
Benchmarking Sensitivity of Continual Graph Learning for Skeleton-Based Action Recognition
647

Bell, S. J. and Lawrence, N. D. (2022). The effect of
task ordering in continual learning. ArXiv preprint,
abs/2205.13323.
Chaudhry, A., Dokania, P. K., Ajanthan, T., and Torr, P. H.
(2018). Riemannian walk for incremental learning:
Understanding forgetting and intransigence. In Pro-
ceedings of the European conference on computer vi-
sion (ECCV), pages 532–547.
Chen, Y., Zhang, Z., Yuan, C., Li, B., Deng, Y., and Hu,
W. (2021). Channel-wise topology refinement graph
convolution for skeleton-based action recognition. In
2021 IEEE/CVF International Conference on Com-
puter Vision, ICCV 2021, Montreal, QC, Canada, Oc-
tober 10-17, 2021, pages 13339–13348. IEEE.
De Lange, M., Aljundi, R., Masana, M., Parisot, S., Jia,
X., Leonardis, A., Slabaugh, G., and Tuytelaars, T.
(2021). A continual learning survey: Defying forget-
ting in classification tasks. IEEE transactions on pat-
tern analysis and machine intelligence, 44(7):3366–
3385.
Dosovitskiy, A., Beyer, L., Kolesnikov, A., Weissenborn,
D., Zhai, X., Unterthiner, T., Dehghani, M., Minderer,
M., Heigold, G., Gelly, S., Uszkoreit, J., and Houlsby,
N. (2021). An image is worth 16x16 words: Trans-
formers for image recognition at scale. In 9th Interna-
tional Conference on Learning Representations, ICLR
2021, Virtual Event, Austria, May 3-7, 2021. OpenRe-
view.net.
Dwivedi, V. P., Ramp
´
a
ˇ
sek, L., Galkin, M., Parviz, A., Wolf,
G., Luu, A. T., and Beaini, D. (2022). Long range
graph benchmark. Advances in Neural Information
Processing Systems, 35:22326–22340.
Febrinanto, F. G., Xia, F., Moore, K., Thapa, C., and
Aggarwal, C. (2023). Graph lifelong learning: A
survey. IEEE Computational Intelligence Magazine,
18(1):32–51.
Girshick, R. B., Donahue, J., Darrell, T., and Malik, J.
(2014). Rich feature hierarchies for accurate object
detection and semantic segmentation. In 2014 IEEE
Conference on Computer Vision and Pattern Recogni-
tion, CVPR 2014, Columbus, OH, USA, June 23-28,
2014, pages 580–587. IEEE Computer Society.
Goodfellow, I. J., Mirza, M., Xiao, D., Courville, A., and
Bengio, Y. (2013). An empirical investigation of
catastrophic forgetting in gradient-based neural net-
works. arXiv preprint arXiv:1312.6211.
He, C., Wang, R., and Chen, X. (2022). Rethinking class or-
ders and transferability in class incremental learning.
Pattern Recognition Letters, 161:67–73.
He, K., Zhang, X., Ren, S., and Sun, J. (2016). Deep resid-
ual learning for image recognition. In 2016 IEEE Con-
ference on Computer Vision and Pattern Recognition,
CVPR 2016, Las Vegas, NV, USA, June 27-30, 2016,
pages 770–778. IEEE Computer Society.
Hu, W., Liu, B., Gomes, J., Zitnik, M., Liang, P., Pande,
V. S., and Leskovec, J. (2020). Strategies for pre-
training graph neural networks. In 8th International
Conference on Learning Representations, ICLR 2020,
Addis Ababa, Ethiopia, April 26-30, 2020. OpenRe-
view.net.
Isele, D. and Cosgun, A. (2018). Selective experience re-
play for lifelong learning. In McIlraith, S. A. and
Weinberger, K. Q., editors, Proceedings of the Thirty-
Second AAAI Conference on Artificial Intelligence,
(AAAI-18), the 30th innovative Applications of Arti-
ficial Intelligence (IAAI-18), and the 8th AAAI Sym-
posium on Educational Advances in Artificial Intel-
ligence (EAAI-18), New Orleans, Louisiana, USA,
February 2-7, 2018, pages 3302–3309. AAAI Press.
Kipf, T. N. and Welling, M. (2017). Semi-supervised classi-
fication with graph convolutional networks. In 5th In-
ternational Conference on Learning Representations,
ICLR 2017, Toulon, France, April 24-26, 2017, Con-
ference Track Proceedings. OpenReview.net.
Kirkpatrick, J., Pascanu, R., Rabinowitz, N., Veness, J.,
Desjardins, G., Rusu, A. A., Milan, K., Quan, J.,
Ramalho, T., Grabska-Barwinska, A., et al. (2017).
Overcoming catastrophic forgetting in neural net-
works. Proceedings of the national academy of sci-
ences, 114(13):3521–3526.
Ko, J., Kang, S., and Shin, K. (2022). Begin: Exten-
sive benchmark scenarios and an easy-to-use frame-
work for graph continual learning. ArXiv preprint,
abs/2211.14568.
Li, T., Ke, Q., Rahmani, H., Ho, R. E., Ding, H., and Liu,
J. (2021). Else-net: Elastic semantic network for con-
tinual action recognition from skeleton data. In Pro-
ceedings of the IEEE/CVF International Conference
on Computer Vision, pages 13434–13443.
Li, Y., Li, M., Asif, M. S., and Oymak, S. (2022). Provable
and efficient continual representation learning. ArXiv
preprint, abs/2203.02026.
Li, Z. and Hoiem, D. (2017). Learning without forgetting.
IEEE transactions on pattern analysis and machine
intelligence, 40(12):2935–2947.
Lin, S., Ju, P., Liang, Y., and Shroff, N. (2023). Theory
on forgetting and generalization of continual learning.
ArXiv preprint, abs/2302.05836.
Liu, H., Yang, Y., and Wang, X. (2021). Overcom-
ing catastrophic forgetting in graph neural networks.
In Thirty-Fifth AAAI Conference on Artificial Intel-
ligence, AAAI 2021, Thirty-Third Conference on In-
novative Applications of Artificial Intelligence, IAAI
2021, The Eleventh Symposium on Educational Ad-
vances in Artificial Intelligence, EAAI 2021, Virtual
Event, February 2-9, 2021, pages 8653–8661. AAAI
Press.
Lopez-Paz, D. and Ranzato, M. (2017). Gradient episodic
memory for continual learning. In Guyon, I., von
Luxburg, U., Bengio, S., Wallach, H. M., Fergus, R.,
Vishwanathan, S. V. N., and Garnett, R., editors, Ad-
vances in Neural Information Processing Systems 30:
Annual Conference on Neural Information Processing
Systems 2017, December 4-9, 2017, Long Beach, CA,
USA, pages 6467–6476.
Masana, M., Twardowski, B., and Van de Weijer, J. (2020).
On class orderings for incremental learning. ArXiv
preprint, abs/2007.02145.
McCloskey, M. and Cohen, N. J. (1989). Catastrophic in-
terference in connectionist networks: The sequential
VISAPP 2024 - 19th International Conference on Computer Vision Theory and Applications
648

learning problem. In Psychology of learning and mo-
tivation, volume 24, pages 109–165. Elsevier.
Mirzadeh, S. I., Chaudhry, A., Yin, D., Nguyen, T., Pas-
canu, R., Gorur, D., and Farajtabar, M. (2022). Archi-
tecture matters in continual learning. ArXiv preprint,
abs/2202.00275.
Rebuffi, S., Kolesnikov, A., Sperl, G., and Lampert, C. H.
(2017). icarl: Incremental classifier and representa-
tion learning. In 2017 IEEE Conference on Computer
Vision and Pattern Recognition, CVPR 2017, Hon-
olulu, HI, USA, July 21-26, 2017, pages 5533–5542.
IEEE Computer Society.
Rolnick, D., Ahuja, A., Schwarz, J., Lillicrap, T. P., and
Wayne, G. (2019). Experience replay for continual
learning. In Wallach, H. M., Larochelle, H., Beygelz-
imer, A., d’Alch
´
e-Buc, F., Fox, E. B., and Garnett, R.,
editors, Advances in Neural Information Processing
Systems 32: Annual Conference on Neural Informa-
tion Processing Systems 2019, NeurIPS 2019, Decem-
ber 8-14, 2019, Vancouver, BC, Canada, pages 348–
358.
Shahroudy, A., Liu, J., Ng, T., and Wang, G. (2016). NTU
RGB+D: A large scale dataset for 3d human activity
analysis. In 2016 IEEE Conference on Computer Vi-
sion and Pattern Recognition, CVPR 2016, Las Vegas,
NV, USA, June 27-30, 2016, pages 1010–1019. IEEE
Computer Society.
van de Ven, G. M., Tuytelaars, T., and Tolias, A. S. (2022).
Three types of incremental learning. Nature Machine
Intelligence, pages 1–13.
Wang, J., Nie, X., Xia, Y., Wu, Y., and Zhu, S. (2014).
Cross-view action modeling, learning, and recogni-
tion. In 2014 IEEE Conference on Computer Vi-
sion and Pattern Recognition, CVPR 2014, Columbus,
OH, USA, June 23-28, 2014, pages 2649–2656. IEEE
Computer Society.
Wang, M., Zheng, D., Ye, Z., Gan, Q., Li, M., Song, X.,
Zhou, J., Ma, C., Yu, L., Gai, Y., et al. (2019). Deep
graph library: A graph-centric, highly-performant
package for graph neural networks. ArXiv preprint,
abs/1909.01315.
Wu, Z., Pan, S., Chen, F., Long, G., Zhang, C., and Philip,
S. Y. (2020). A comprehensive survey on graph neural
networks. IEEE transactions on neural networks and
learning systems, 32(1):4–24.
Yan, S., Xiong, Y., and Lin, D. (2018). Spatial temporal
graph convolutional networks for skeleton-based ac-
tion recognition. In McIlraith, S. A. and Weinberger,
K. Q., editors, Proceedings of the Thirty-Second AAAI
Conference on Artificial Intelligence, (AAAI-18), the
30th innovative Applications of Artificial Intelligence
(IAAI-18), and the 8th AAAI Symposium on Educa-
tional Advances in Artificial Intelligence (EAAI-18),
New Orleans, Louisiana, USA, February 2-7, 2018,
pages 7444–7452. AAAI Press.
Yoon, J., Kim, S., Yang, E., and Hwang, S. J. (2020). Scal-
able and order-robust continual learning with addi-
tive parameter decomposition. In 8th International
Conference on Learning Representations, ICLR 2020,
Addis Ababa, Ethiopia, April 26-30, 2020. OpenRe-
view.net.
Zhang, X., Song, D., and Tao, D. (2022). Cglb: Bench-
mark tasks for continual graph learning. In Koyejo,
S., Mohamed, S., Agarwal, A., Belgrave, D., Cho, K.,
and Oh, A., editors, Advances in Neural Information
Processing Systems, volume 35, pages 13006–13021.
Curran Associates, Inc.
Zhou, D.-W., Wang, Q.-W., Qi, Z.-H., Ye, H.-J., Zhan, D.-
C., and Liu, Z. (2023). Deep class-incremental learn-
ing: A survey. ArXiv preprint, abs/2302.03648.
APPENDIX
A Theorem 1
To prove that the upper bound of AF is correlated to
AA, we use the definition from Sec. 3.2:
AA
k
=
1
k
k
∑
j=1
a
k, j
(6)
f
k
j
= max
l∈{1,...,k−1}
a
l, j
− a
k, j
, ∀ j < k (7)
AF
k
=
1
k − 1
k−1
∑
j=1
f
k
j
(8)
Next, we expand Eq. (8) with Eq. (7):
AF
k
=
1
k − 1
(
k−1
∑
j=1
max
l∈{1,...,k−1}
a
l, j
−
k−1
∑
j=1
a
k, j
)
When a
k, j
increases, the upper bound of AF
k
will
be smaller. When we assume the forgetting is maxi-
mum, without modifying AA
k
, i.e. max
l∈{1,...,k−1}
a
l, j
is always 1, we will have:
AF
k
≤ (
1
k − 1
k−1
∑
j=1
1) −
1
k − 1
k−1
∑
j=1
a
k, j
(9)
AF
k
≤ 1 −
1
k − 1
k−1
∑
j=1
a
k, j
The term
1
k−1
∑
k−1
j=1
a
k, j
is very closely related to
AA, which is
1
k
∑
k
j=1
a
k, j
. We can denote the term
1
k−1
∑
k−1
j=1
a
k, j
as x and transform the inequality:
AA
k
=
1
k
k
∑
j=1
a
k, j
AA
k
=
k − 1
k
1
k − 1
(
k−1
∑
j=1
a
k, j
+ a
k,k
)
AA
k
=
k − 1
k
1
k − 1
(
k−1
∑
j=1
a
k, j
) +
k − 1
k
1
k − 1
a
k,k
Benchmarking Sensitivity of Continual Graph Learning for Skeleton-Based Action Recognition
649
AA
k
=
k − 1
k
x +
1
k
a
k,k
k
k − 1
(AA
k
−
1
k
a
k,k
) = x
When we replace the term x in the original inequality
by the transformed AA
k
, we get the following:
AF
k
≤ 1 − (
k
k − 1
(AA
k
−
1
k
a
k,k
))
AF
k
≤ 1 −
k
k − 1
AA
k
+
1
k − 1
a
k,k
This denotes the upper bound of AF
k
for a given AA
k
.
However, to visualize the upper bound in the scat-
ter plot, it is not possible to include a
k,k
of each ex-
periment. For simplicity, we can assume a
k,k
is al-
ways at maximum, i.e. 100% accuracy. We can then
draw the dotted green line as visualized in Fig. 2 using
Eq. (10):
AF
k
≤ 1 −
k
k − 1
AA
k
+
1
k − 1
(10)
B Implementation
Our benchmark adapted the code from CGLB (Zhang
et al., 2022). We extended the code to handle extra ex-
periment options, including reordering classes, tasks,
and options for changing backbone architecture and
the computation of corresponding metrics.
We use GCN implemented by the DGL python li-
brary (Wang et al., 2019) and ST-GCN implemented
as in CTR-GCN(Chen et al., 2021) as the backbone
GNN for our benchmark. For GCN, we use two
graph convolutional layers, followed by a sum and
max readout as feature extraction layers, and a mlp
predictor as classification layer. For ST-GCN, two
ST-GCN layers are used. All layers have 64 hidden
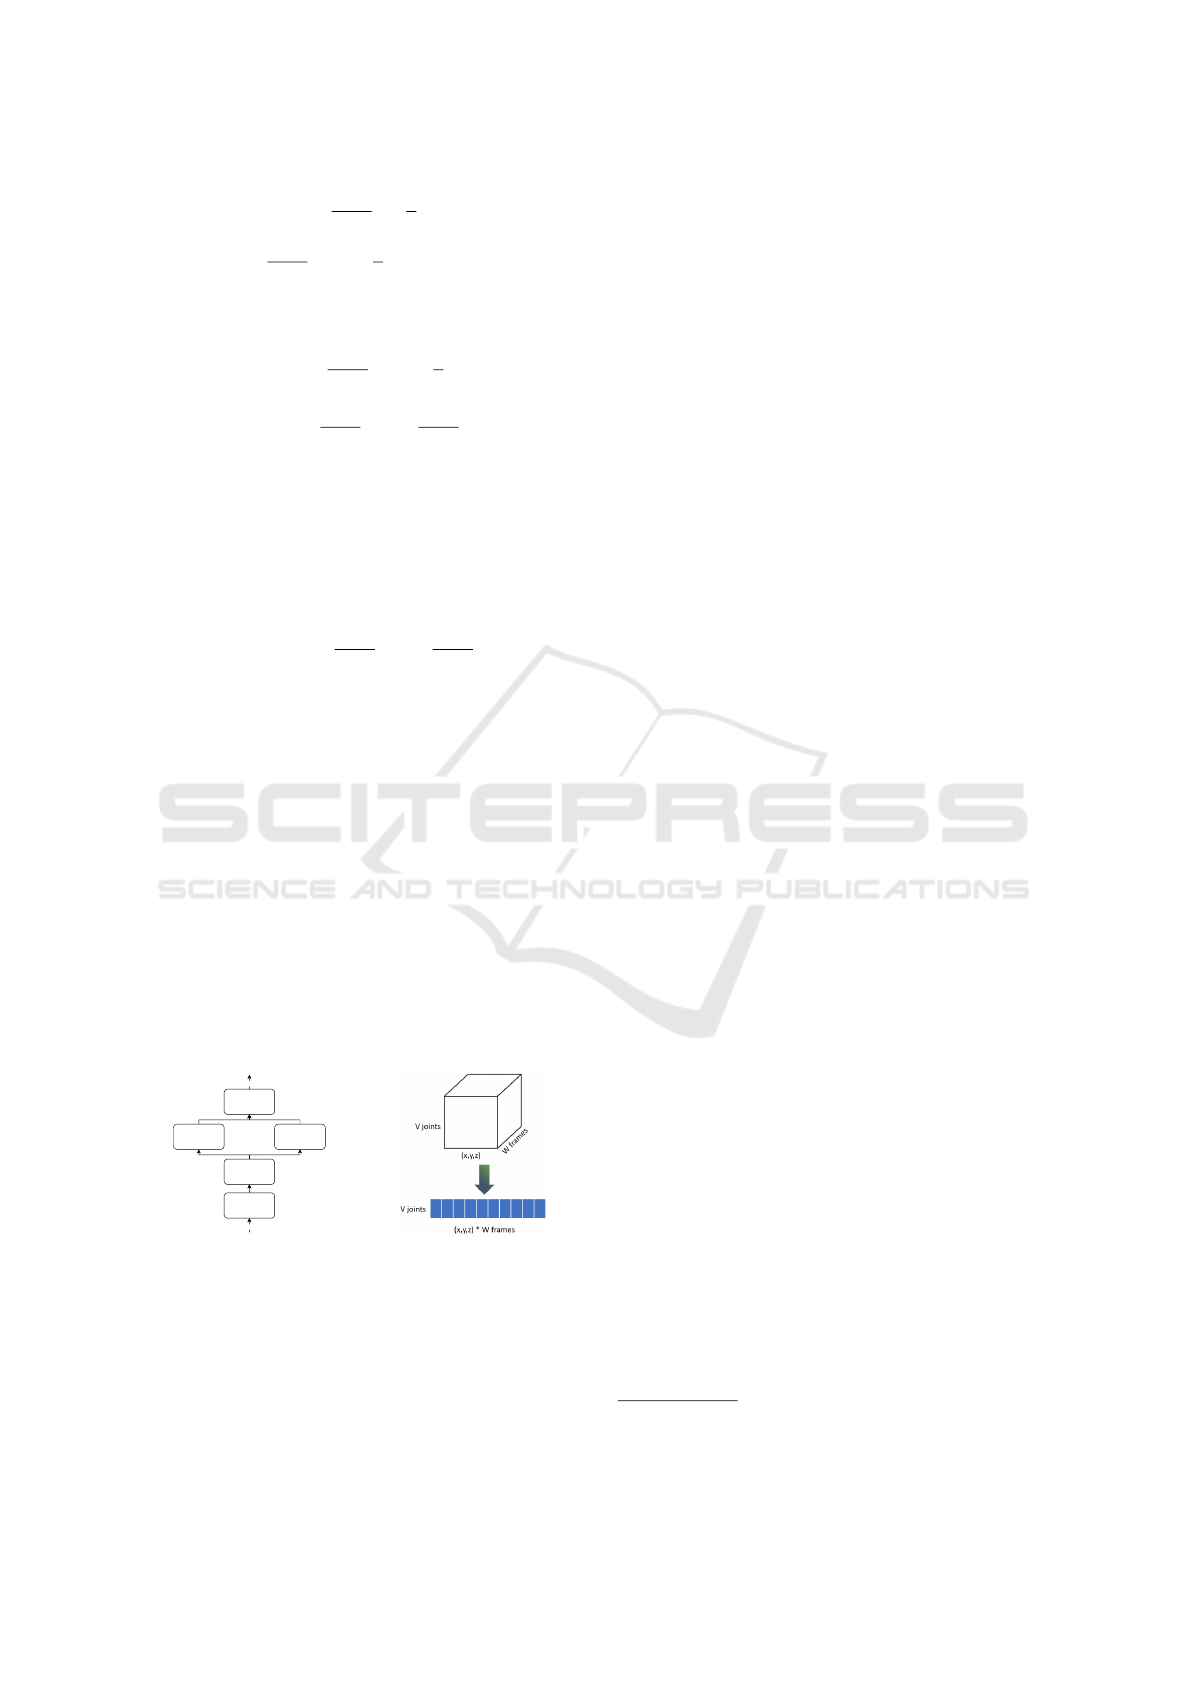
units. The GCN architecture is visualized in Fig. 9a.
gcn-layer1
gcn-layer2
sum readout max readout
mlp predictor
output
input
(a) Visualization of baseline
backbone GCN architecture.
(b) Data pre-processing for
GCN architecture.
Figure 9: Architecture and data processing.
Our benchmark added the data loader for ‘N-
UCLA’ and ‘NTU-RGB+D’ skeleton-based action
recognition. We adapted the base code from the
data loaders of CTR-GCN (Chen et al., 2021). We
changed the loader to create a DGL compatible graph.
The features of each node are preprocessed as shown
in Fig. 9b. As GCN implemented by DGL only ac-
cepts 1-D node feature, we concatenated the spatial
coordinate information with the temporal information
of each joint to create a long vector as the final node
feature.
For the data of the ‘N-UCLA’ dataset, we used the
prepared data from CTR-GCN (Chen et al., 2021), for
the data of ‘NTU-RGB+D’, we used the prepared data
from the ‘PaddleVideo’ GitHub repository
1
. We used
the train data in the x-sub category to construct our
class-incremental learning variant of the dataset.
C Experiments
We executed all experiments 5 times with the ‘Tesla
V100-SXM3-32GB‘ GPU. Each task is learned for
100 epochs with 0.001 learning rate and batch size
10000, this is equivalent to full batch training, as our
tasks contain less than 10000 data points. Each CL
process contains 5 tasks, where the model sequen-
tially learns them using the CL method. Each CL
process takes around 80 minutes for regularization-
based methods and LwF in NTU-CIL, and 10 minutes
in N-UCLA-CIL. For GEM and REPLAY, it takes
around 100 minutes in NTU-CIL and 15 minutes in
N-UCLA-CIL. We compute task-level accuracy a
k,k
by taking the macro-average of the accuracy of the
class in the task. The reported metrics are the average
of the 5 executions.
For the architectural sensitivity experiment, the
exact widths and depths used are presented in Tab. 4.
In the width experiment, the depth of GCN is set to
default, i.e. two GCN layers. We only changed the
width of the GCN layers, and not the classification
layers, as we are interested in the impact of changes
in graph feature extractions on the CGL performance.
In the depth experiment, the width of the GCN layers
is set to the default 64 hidden units.
To ensure hyperparameter fairness, we conducted
a grid search for each algorithm on each dataset using
the default task and class order. The grid is shown
in Tab. 5. Compared to CGLB’s (Zhang et al., 2022)
hyperparameter, we replaced the memory buffer size
from the number of samples to the fraction of task
samples. The two datasets that we implemented are
of different sizes. It is fairer to assess the result of
rehearsal-based methods when we define the fraction
of task data samples to be stored. We report the best
hyperparameter we have found for GCN in Tab. 3.
1
https://github.com/PaddlePaddle/PaddleVideo/blob/
develop/docs/en/dataset/ntu-rgbd.md
VISAPP 2024 - 19th International Conference on Computer Vision Theory and Applications
650

Table 3: Best hyperparameter candidates found via grid search for GCN. frac memories denotes the percentage of each task
that GEM/REPLAY stores as buffer.
algorithm best hyper-parameter
N-UCLA-CIL NTU-CIL
EWC memory strength: 1000000 memory strength: 1000000
MAS memory strength: 100 memory strength: 100
TWP
lambda l: 10000; lambda t: 10000; beta: 0.01 lambda l: 100; lambda t: 10000; beta: 0.01
LwF lambda dist: 1; T: 2 lambda dist: 0.1; T: 2
GEM
memory strength: 5; frac memories: 0.2 memory strength: 5; frac memories: 0.2
REPLAY frac memories: 0.2 frac memories: 0.2
Table 4: Parameter for architectural sensitivity experiment.
Experiment parameter grid
width width: [32,64,128,256,512]
depth depth: [1,2,4,8,16]
Table 5: Hyperparameter candidates used for grid search.
frac memories denotes the percentage of each task that
GEM/REPLAY stores as buffer.
algorithm hyperparameter grid
EWC memory strength: [1,100,10000,1000000]
MAS memory strength: [1,100,10000,1000000]
TWP
lambda l: [100,10000]; lambda t: [100,10000];
beta: [0.01,0.1]
LwF lambda dist: [0.1,1,10]; T: [0.2,2,20]
GEM
memory strength: [0.05, 0.5, 5];
frac memories: [0.05, 0.1, 0.2]
REPLAY frac memories: [0.05, 0.1, 0.2]
Benchmarking Sensitivity of Continual Graph Learning for Skeleton-Based Action Recognition
651
