
Bringing Objects to Life: Supporting Program Comprehension
Through Animated 2.5D Object Maps from Program Traces
Christoph Thiede
a
, Willy Scheibel
b
and Jürgen Döllner
c
Hasso Plattner Institute, Digital Engineering Faculty, University of Potsdam, Germany
Keywords:
Software Visualization, Software Maps, Program Comprehension, Omniscient Debugging.
Abstract:
Program comprehension is a key activity in software development. Several visualization approaches such as
software maps have been proposed to support programmers in exploring the architecture of software systems.
However, for the exploration of program behavior, programmers still rely on traditional code browsing and
debugging tools to build a mental model of a system’s behavior. We propose a novel approach to visualizing
program behavior through animated 2.5D object maps that depict particular objects and their interactions
from a program trace. We describe our implementation and evaluate it for different program traces through an
experience report and performance measurements. Our results indicate that our approach can benefit program
comprehension tasks, but further research is needed to improve scalability and usability.
1 INTRODUCTION
Exploring and understanding software systems are
key activities in software development. Programmers
often come across familiar or unfamiliar systems that
they want to fix, change, or extend. For this, they need
to build up a mental model that links the system’s vis-
ible behavior to its high-level architecture and low-
level implementation artifacts. Traditionally, pro-
grammers explore software systems by reading their
source code. An alternative approach is to explore
the system’s behavior by example: programmers can
start by invoking the system with a particular input
or by running a test case and then use a debugger to
step through the program’s execution, identifying rel-
evant units and actors and exploring their interactions.
As traditional debuggers are constrained to the tem-
poral execution order of the program, omniscient de-
buggers (also referred to as time-travel debuggers or
back-in-time debuggers) record a program trace and
allow programmers to explore the program’s behav-
ior in a nonlinear fashion (Pothier and Tanter, 2009;
Perscheid et al., 2012). However, omniscient debug-
gers are unsuitable for exploring large program traces
involving several subsystems and dozens of interact-
ing objects: while their fine-grained display of source
code and variables is useful for debugging-related ac-
a
https://orcid.org/0000-0002-7442-8216
b
https://orcid.org/0000-0002-7885-9857
c
https://orcid.org/0000-0002-8981-8583
tivities, it impedes the exploration of the higher-level
architecture and behavior.
Several visualization approaches have been pro-
posed to support programmers in exploring the ar-
chitecture of software systems. Software maps dis-
play the static structure of systems using various
metaphors such as cities or forests are useful for pro-
gram comprehension tasks (Wettel and Lanza, 2007;
Limberger et al., 2022). Yet, most approaches neglect
the dynamic behavior of systems and take a coarse-
grained view of their structure. As a result, these
maps are inadequate for developing a mental model of
the system’s behavior that situates particular interact-
ing objects and connects them to the overall function-
ing of the system (von Mayrhauser and Vans, 1995).
To bridge this gap between coarse-grained static
software maps and fine-grained omniscient debug-
ging views, we propose a novel approach for visualiz-
ing the behavior of object-oriented software systems
through animated 2.5D object maps (or (animated)
object maps for short), which depict particular objects
and their interactions from a program trace. In partic-
ular, we make the following contributions:
1. We present a novel visualization approach for
object-oriented program behavior using animated
2.5D object maps.
2. We describe the implementation of our prototype
TRACE4D that applies this approach using pro-
gram traces from the Squeak/Smalltalk environ-
ment.
Thiede, C., Scheibel, W. and Döllner, J.
Bringing Objects to Life: Supporting Program Comprehension Through Animated 2.5D Object Maps from Program Traces.
DOI: 10.5220/0012393900003660
Paper published under CC license (CC BY-NC-ND 4.0)
In Proceedings of the 19th Inter national Joint Conference on Computer Vision, Imaging and Computer Graphics Theory and Applications (VISIGRAPP 2024) - Volume 1: GRAPP, HUCAPP
and IVAPP, pages 661-669
ISBN: 978-989-758-679-8; ISSN: 2184-4321
Proceedings Copyright © 2024 by SCITEPRESS – Science and Technology Publications, Lda.
661

3. We discuss the potential and limitations of our
approach by reporting on our experience and
evaluating the performance of our implementa-
tion, encompassing responsiveness, frame rates,
and memory consumption, for different program
traces.
We made all artifacts and supplementary materials of
this work available in a public repository
1
.
2 RELATED WORK
Several approaches for visualizing the architecture
and behavior of software systems were introduced
before. In the broad field of program visualization
(Sorva et al., 2013), algorithm animation is an early
approach that focuses on visualizing procedural al-
gorithms and data structures in educational contexts
(Brown and Sedgewick, 1984). Further approaches
have been proposed that allow to create general-
purpose visualizations for the architecture and be-
havior of software systems (Cheng et al., 2008; Chi¸s
et al., 2014). More specific techniques can be cate-
gorized as sequential depictions, software maps, and
object visualizations.
Sequential Depictions. Several tools adopt and ex-
tend UML sequence diagrams to display communi-
cation between objects over time (Hamou-Lhadj and
Lethbridge, 2004): Jerding and Stasko (1998) and
Cornelissen et al. (2009) derive miniaturized versions
of a sequence diagram (Lemieux and Salois, 2006,
sec. 3.4); Hamou-Lhadj and Lethbridge (2004) detect
execution patterns to reduce sequence diagrams.
Software Maps and Treemaps. Software maps de-
scribes a family of approaches that use cartography
metaphors to visualize the architecture of software
systems (Limberger et al., 2022). As underlying tech-
nique, treemaps display the static structure of soft-
ware systems by visualizing their hierarchical organi-
zation of packages and classes, folders and files, autc.
as a nested set of shapes (Scheibel et al., 2020b). They
offer various visual variables such as the size, color,
and position of the shapes to encode additional infor-
mation about the system. Shapes are usually rectan-
gles but can also be other polygons as in Voronoi tes-
sellation treemaps (Balzer et al., 2005; Scheibel et al.,
2020a). One popular, contemporary type of treemaps
is 2.5D treemaps which add a third dimension to the
visualization by transforming each shape into a right
1
https://github.com/LinqLover/trace4d (also preserved
in Zenodo: https://doi.org/10.5281/zenodo.10044853)
prism (usually a cuboid) of a variable height. Many
approaches use the software city metaphor to style
the cuboids of a 2.5D treemap as buildings of a city
(Dugerdil and Alam, 2008; Wettel and Lanza, 2007).
Animated Software Maps. Some approaches en-
rich software maps with animations to display dy-
namic information over time (Lemieux and Salois,
2006, sec. 3.4) that can relate to the behavior or evo-
lution of systems: EVOSPACES (Dugerdil and Alam,
2008) highlights classes in a software city when they
are activated; DYNACITY (Dashuber and Philippsen,
2022), EXPLORVIZ (Krause et al., 2021), SYNCHRO-
VIS (Waller et al., 2013), and others also draw con-
nections between modules to visualize dataflow; Lan-
gelier et al. (2008) gradually construct a software city
and update the geometries and colors of buildings to
represent development activity. Some approaches al-
low programmers to monitor a system in real-time
(Fittkau et al., 2013) while others replay a previ-
ously recorded trace of software activity (Dugerdil
and Alam, 2008).
Object Graphs. To provide visual insights into the
behavior of software, behavior can be attributed to
different entities of the software, e.g., organizational
units such as modules or classes, or individual object
instances of object-oriented programs. Several tools
allow programmers to explore relevant parts of a pro-
gram’s object graph (Moreno et al., 2004; Gestwicki
and Jayaraman, 2005). Some graphs mimic the look
of UML object diagrams and provide details about an
object’s internal state while others choose more com-
pact representations. To reduce the visual complexity
of graph displays, some tools provide programmers
with means for filtering objects based on their organi-
zation or relation to program slices (Lange and Naka-
mura, 1997; Hamou-Lhadj and Lethbridge, 2004).
Communication Flow. Call graphs and control-
flow graphs are two popular ways of displaying en-
tities with their mutual dynamic interactions or com-
munications. Entities can be nodes from an object
graph, organizational units such as classes (Reiss,
2007) or modules, or they can be subject to user-
selected abstraction levels (Lange and Nakamura,
1997; Walker et al., 1998). AVID (Walker et al.,
1998) provide animated object graphs where users
can explore the control flow interactively. Boothe
and Badame (2011) merge the stack frames from
a control-flow graph and the nodes from an object
graph into a single memeograph that can be explored
through animation.
IVAPP 2024 - 15th International Conference on Information Visualization Theory and Applications
662
Dataflow. Another perspective on object graphs re-
gards the propagation of state through the system.
The WHYLINE approach allows programmers to ask
questions about why certain behaviors did or did
not happen or where certain values came from and
presents the answers in a sliced control-flow graph
(Ko and Myers, 2008). Lienhard et al. (2009) pro-
pose an inter-unit flow view that displays the amount
of data or objects exchanged between different classes
or modules in a directed weighted graph; this graph
can also be embedded into a traditional call graph.
State Changes. Lienhard et al. (2009) propose a
side-effects graph which shows connections between
objects changing each other’s state. Similarly, object
traces slice a call tree for exploring the state evolution
of individual objects (Thiede et al., 2023a). Memory
cities support the heap memory analysis of programs
by displaying objects and their memory consumption
in a 2.5D treemap and animating the allocation and
deallocation of objects (Weninger et al., 2020).
Call Trees. Besides the communication or evolu-
tion of entities, another perspective that visualiza-
tions often take on software behavior is the tem-
poral order of program execution. Besides naive
graph representations of this data structure, several
approaches display call trees using hierarchical lay-
outs such as treemaps, sunbursts, icicle plots (Kruskal
and Landwehr, 1983), or flame graphs (Gregg, 2016).
3 VISUALIZATION APPROACH
We propose animated 2.5D object maps as a novel
visualization approach for program traces to support
the comprehension of object-oriented programs. In
the following, we describe the prerequisites and the
design of our approach.
3.1 Data Model
The data of our visualization is the program trace
of an object-oriented program. In this programming
paradigm, all behavior is described as messages sent
from one object to another. Each object is charac-
terized by its identity which distinguishes it from all
other objects, its state which is represented by its
fields such as array elements and instance variables,
and its behavior which is implemented by methods
that are invoked to receive messages (Thiede et al.,
2023b). We assume a general data model of the pro-
gram trace: the call tree is represented as a compos-
ite structure of stack frames each of which specifies a
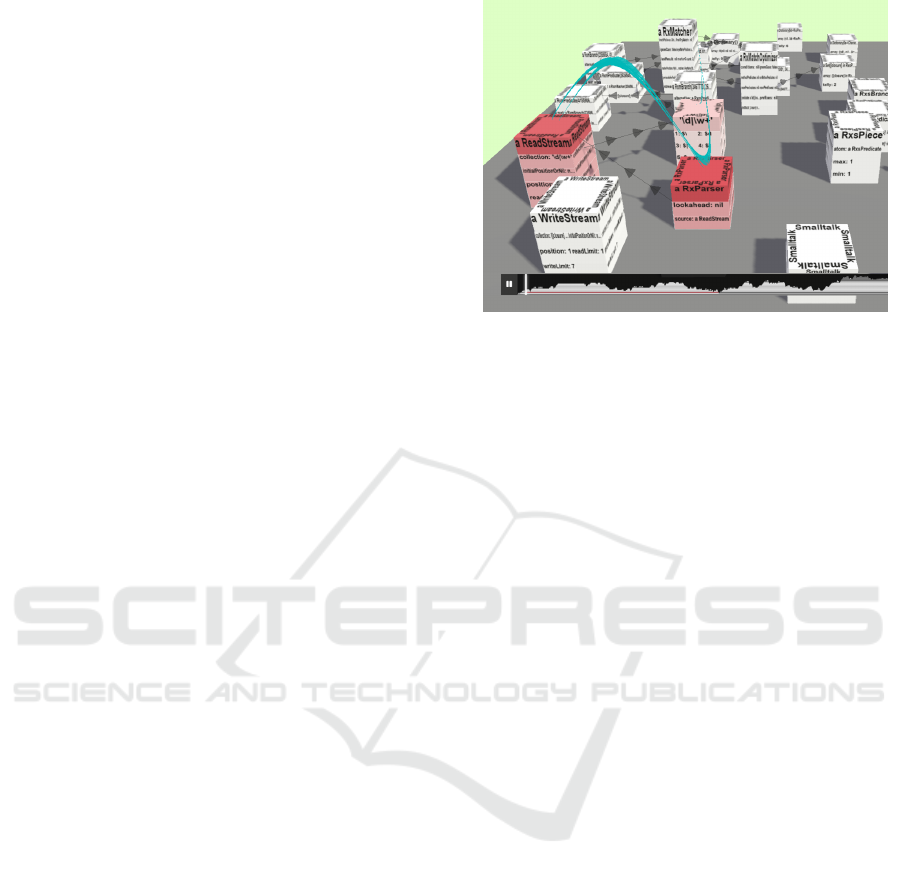
Figure 1: Screenshot of an animated object map showing
a program trace for the construction of a regular expres-
sion matcher in the Squeak/Smalltalk programming envi-
ronment. Blocks represent objects, arrows display refer-
ences between objects, and color highlights and trails show
object activations. The timeline at the bottom provides a
temporal overview of the program trace.
time interval, an invoked method, and a receiver ob-
ject. Each object is assigned a label, i.e., a textual rep-
resentation of an object’s identity or signature state, a
list of named fields, and a class. Each class is de-
scribed by a name and an organizational path in the
file or package structure of the software system. We
neglect runtime changes to the state, label, or class
membership of objects as well as asynchronous or
concurrent program behavior and metaprogramming
peculiarities such as the implementation of classes or
methods as objects.
3.2 Visual Mapping
We describe the design of our visualization and the
mapping of parts from the program trace to elements
and visual variables of our visualization (fig. 1). At
the highest level, an animated 2.5D object map is
an interactive information landscape that displays ob-
jects and their interactions from the program trace.
Users can replay the program trace and watch the ac-
tivation of objects – the invocation of their methods –
and their interaction – the exchange of messages be-
tween two objects. They can navigate freely through
the visual scene using their keyboard and pointing de-
vices.
Objects. Each object is represented as a square
cuboid block entity that displays the label and fields
of the object (fig. 2). To maximize legibility from any
perspective, the label is repeated on all four sides and
in four orientations on the top. Fields are displayed
as tiles that are arranged in a row-wise uniform-sized
Bringing Objects to Life: Supporting Program Comprehension Through Animated 2.5D Object Maps from Program Traces
663
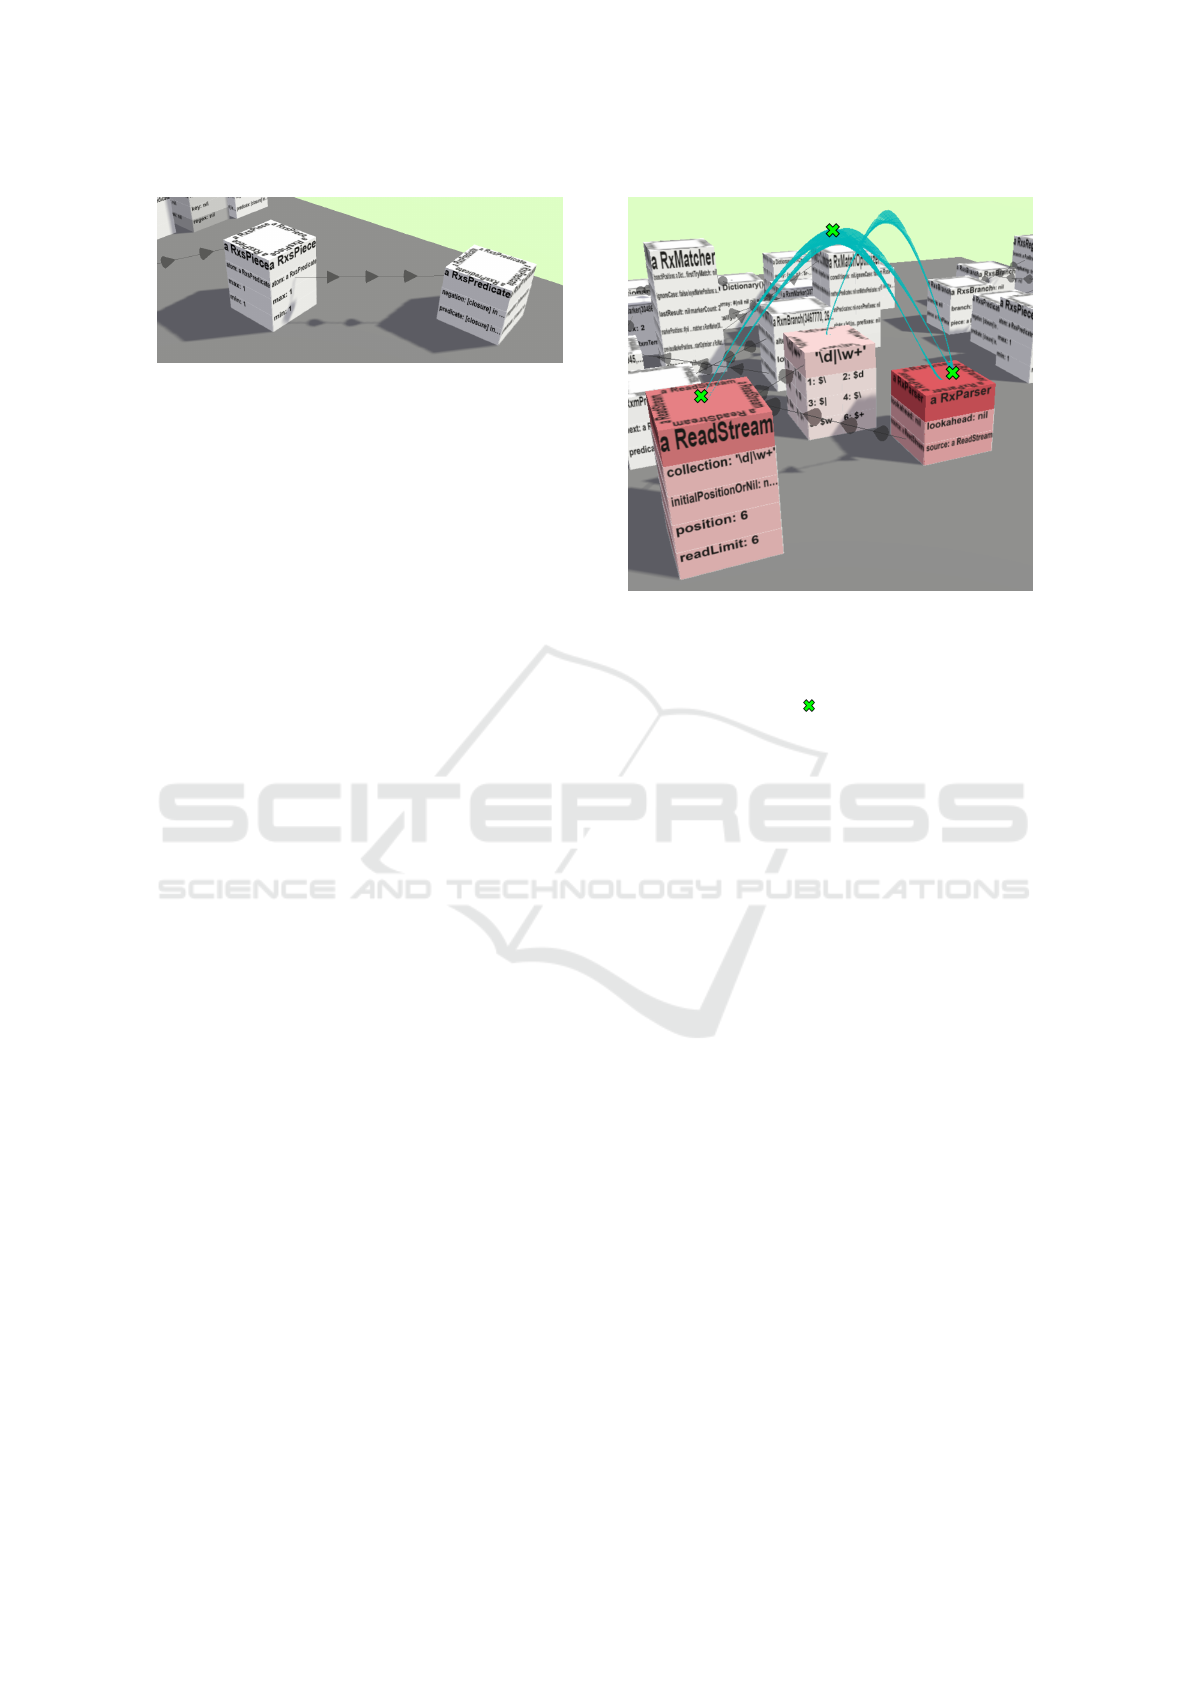
Figure 2: Visual mapping of objects, fields, and references
to block entities, tiles, and arrows in the object map.
grid layout and repeated on each side of the block for
better legibility. References between objects are ren-
dered as directed arrows from the closest tile of the
referencing field to the closest label of the referenced
object. To indicate the direction of arrows chevrons
are placed on the arrow line.
Object Graph. All object blocks are placed on a
plane in the 2.5D object map. For their arrange-
ment, we use a force-directed graph layout.Between
each pair of object blocks a and b, we apply several
weighted attractive forces:
Class-membership force F
class
(a, b) if a and b be-
long to the same class;
Organizational force F
org
(a, b) based on the com-
mon prefix length of the organizational paths (e.g.,
a file path) of a’s and b’s classes;
Reference force F
ref
(a, b) based on the number of
fields in a that reference b;
Communication force F
comm
(a, b) based on the
number of messages sent from a to b.
In addition to the attractive forces, we define globally
weighted repulsion and centripetation forces on all
blocks to control the graph’s entropy, and we define
radial constraints to avoid collisions between blocks.
We provide an empirical base configuration for all
force weights but allow users to override them for spe-
cific program traces. By default, we give the highest
weight to reference forces and the lowest weight to
organizational forces with a six-order-of-magnitude
difference and scale organizational forces logarithmi-
cally. This configuration encourages a state-centric
layout of the object graph while leaving a margin for
the characteristics of particular program traces (e.g.,
their ratio between intrinsic and extrinsic state) to-
wards a more dataflow-driven layout. In addition,
users can drag and drop blocks to customize the lay-
out. To reduce response time and maintain an expe-
rience of immediacy, we render the graph at regular
update intervals even before the force simulation has
converged.
Figure 3: Visual mapping of object behavior to block colors
and the trail in the object map. The intensity of the red color
indicates the recency of the last message received by the
corresponding object. The gradient trail curve connects the
most recent object activations (control points of the curve
are marked with a cross ( )).
Object Selection. Usually, even after restricting the
object graph to the receivers from the call tree, only
a small part of it is relevant for comprehending the
high-level behavior of a program while many other
objects fulfill lower-level implementation details. In
our visualization, we use a filter system for exclud-
ing objects based on their label, class, or organi-
zation. Similar to the layout configuration (object
graph), we provide an empirical default configuration
that excludes certain base objects such as collections,
Booleans, and numbers, but allow users to customize
these filters.
Object Behavior. The color of each object block in-
dicates its recent activity: inactive blocks are colored
in a neutral light gray while active blocks whose ob-
jects have recently received a message are highlighted
in a bright red (fig. 3). After control flow passes
on to other objects, blocks fade back to the base
color within one second using a single-hue continu-
ous sequential color scheme by Harrower and Brewer
(2003). In addition to the color coding, a trail con-
nects the k = 15 most recent object activations to sup-
port the delayed observation of short activations and
the recognition of the exact activation order. The trail
curve is based on a centripetal Catmull-Rom spline
whose control points are placed on the top of each
relevant block and alternated with intermediate points
between blocks. Block control points are displaced
on the top surface by a random offset using a normal
IVAPP 2024 - 15th International Conference on Information Visualization Theory and Applications
664

Figure 4: Timeline overlay with widgets to control the play-
back of the program trace and a flame graph with a variable
level of detail for navigating the call tree. The flame graph
and the object map are linked, i.e., the user can hover over
a frame to highlight the corresponding object in the map.
distribution to distinguish multiple activations of the
same object. Intermediate control points are raised
vertically to give the curve a wave-like shape that
makes activated objects identifiable. The direction of
the trail is displayed by continuously moving it to the
next object during the animation and applying a linear
translucency gradient to fade out the tail of the curve.
Timeline. The object map integrates a timeline
overlay at the bottom of the viewport that provides
a time-centric navigation aid. The timeline consists
of two widgets stacked on top of each other (fig. 4).
A player with a slider and a play/pause button dis-
plays the current point in time of the program trace
and allows users to control the time and animation
state. Behind the player, a collapsed flame graph
shows the course of the call stack depth. Users can
resize the timeline to explore the full call tree hierar-
chy and examine individual frames in the flame graph.
Both the flame graph and the object map are interac-
tively linked, i.e., users can hover over an object in the
map to discover all of its activations in the timeline, or
vice versa, they can click on a frame to fast-forward
or rewind the trail in the map to the corresponding
object activation. Thus, object map and timeline pro-
vide two orthogonal means of navigating through the
object-oriented program trace at different granulari-
ties.
3.3 Implementation
We demonstrate the technical feasibility of animated
2.5D object maps by describing the implementation
of our prototype TRACE4D that displays program
traces from a Squeak/Smalltalk environment (back-
end) in a web application (frontend). While we use
program traces from Squeak/Smalltalk in our proto-
type, it is not limited to this environment but could
easily be applied to other object-oriented traceable
languages.
Program Tracing. Squeak/Smalltalk is an interac-
tive development environment (IDE) based on the
object-oriented paradigm (everything is an object, in-
cluding classes, methods, and stack frames) and gives
programmers rich control to inspect and manipulate
all parts of the system by instrumenting method ob-
jects, recording stack frame objects, etc. (Thiede and
Rein, 2023). In our backend, we use the TRACEDE-
BUGGER, an omniscient debugger for Squeak, to
record a program trace. We export the resulting pro-
gram trace consisting of a call tree, an object graph,
and a class hierarchy as a JSON file. We use Squeak’s
built-in inspector tool to retrieve fields for instance
variables or higher-level views of each object.
Visualization. We implement the visualization
frontend of TRACE4D as a JavaScript web applica-
tion. The web app retrieves a serialized program trace
and provides prototypical interfaces for customizing
the visual configuration. To build the 2.5D object
map, we generate and display a 3D scene from the
program trace using the JavaScript 3D rendering li-
brary THREE.JS and layout the object blocks using
the d3-force module of the visualization framework
D3.JS. The timeline is built using a flame graph
from the d3-flame-graph plugin for D3.JS.Custom
HTML widgets are used for the player controls. Ani-
mation is played at a configurable speed (defaulting to
50 bytecode instructions per second), which updates
the color highlights and trail for activated objects at
each animation tick.
4 EVALUATION
We evaluate our visualization approach by describ-
ing a practical use case of animated 2.5D object maps
for program comprehension, reporting on our experi-
ences for six different program traces, and evaluating
the performance of the TRACE4D prototype.
4.1 Use Case
To illustrate how animated object maps can support
program comprehension, we describe how a fictional
programmer uses the TRACE4D visualization to ex-
plore the way a regular expression engine constructs
a matcher from a pattern. The Regex package in
Squeak provides a Smalltalk-specific flavor of regu-
lar expressions. To construct a matcher, the package
first parses the pattern string into an abstract syntax
tree (AST) and then compiles the AST into a non-
deterministic finite automaton (NFA). In this exam-
ple, our programmer visualizes the construction of the
Bringing Objects to Life: Supporting Program Comprehension Through Animated 2.5D Object Maps from Program Traces
665

simple regular expression \d|\w+ to gain a better un-
derstanding of the subsystems involved and their in-
teractions. To create the visualization, the program-
mer records and exports a trace of the program '\d|\w+'
asRegex in Squeak and loads it into the TRACE4D
web app
2
. As the visualization loads, she sees about
25 objects moving around in the object map and ar-
ranging themselves in a semi-structured graph within
a few seconds (fig. 1). By navigating through the
scene, she discovers several relevant objects and clus-
ters of objects:
• the pattern string '\d|\w+';
• an RxParser object accessing the string via a
ReadStream;
• eight objects referencing each other whose class
names begin with the prefix Rxs, identifying them
as nodes of the AST;
• an RxMatcher object surrounded by six objects
whose class names start with Rxm, identifying
them as states of the matcher’s NFA;
• several other loosely structured objects, including
an RxMatchOptimizer, four Dictionarys, and a Set.
After getting a rough overview of the object graph,
she starts the animation of the program trace through
the player in the timeline. By observing the trail of
object activations and the cursor position in the time-
line (default running time: 77 seconds), she can notice
the following three segments of the program execu-
tion:
1. Invoked by the pattern string, the parser domi-
nates the first third of the program execution, ac-
cessing the pattern through the ReadStream and
talking to the AST nodes, presumably to initialize
them.
2. Next, the matcher becomes active and accesses
the AST nodes and the NFA states simultaneously,
presumably to compile the AST into the NFA.
3. For the remaining half of the program, the match
optimizer is active, accessing the AST again and
talking to the set.
Thus, our programmer could gain a first overview of
the different parts of the Regex package and their col-
laboration to realize the construction of the matcher.
Besides, she also could notice that almost 50% of the
time was spent in the match optimizer. Without a
closer idea of the role of this object, she might sus-
pect this step to be a bottleneck in the construction
and wonder if the optimization is optional and could
be skipped for certain uses of the regular expression.
2
The interactive visualization of the described trace
is available at https://linqlover.github.io/trace4d/app.html?
trace=traces/regexParse.json. The visualization, together
with a screencast, is also archived at our Zenodo archive.
Table 1: Ratings of our experience with animated object
maps for program comprehension using a three-point Lik-
ert scale. We gained the most insights from smaller program
traces that thoroughly model behavior through communica-
tion between objects and avoid many similar objects.
Program
Configuration ef-
fort
Clarity of objects
Object layout
Animation
Program compre-
hension
Regex engine
• Construction + + + + +
• Matching + + + ◦ +
Morphic UI framework
• Event handling − − ◦ ◦ ◦
• Layouting ◦ ◦ + ◦ −
Inspector tool
initialization
− − − − −
HTML parsing
◦ + + + +
To dive deeper into the Regex implementation, she
expands the flame graph of the timeline, identifies a
few entry point methods of the objects that she finds
most interesting (e.g., RxParser»parseStream:), and
opens them in the Squeak IDE to browse their code.
4.2 Experience Report
To assess the use of animated object maps for pro-
gram comprehension, we explored six different pro-
gram traces from the domains of string processing,
GUIs, and programming tools in the TRACE4D pro-
totype and assessed our experience with them for five
different criteria regarding the usability, clarity, and
insightfulness of the visualization (table 1). We chose
these criteria in view of short gulfs of execution and
evaluation and a maximum of information that users
can gain from the visualization. We provide a full
protocol of the experience report in the supplemen-
tary materials.
Suitable Traces. We had better experiences when
using the visualization for smaller program traces
such as various string processing examples. On the
contrary, we were more challenged when trying to un-
derstand the behavior of larger program traces such as
operations in a GUI system or programming tool. In
general, we found animated object maps most prac-
tical for systems that thoroughly adhere to the prin-
ciples of object-oriented design by defining many
fine-grained, highly coherent objects and describing
behavior through extensive communication between
these objects. On the other hand, program traces in-
volving many homogeneous objects or unrelated sub-
IVAPP 2024 - 15th International Conference on Information Visualization Theory and Applications
666

systems contain more repetitive or irrelevant elements
and are typically less amenable to exploration through
animated object maps. Thus, programmers need to
provide minimal program traces to achieve clear vi-
sualizations.
Program Comprehension. For suitable program
traces, we were able to gain several kinds of insights
and benefits from the visualization: we could dis-
cover characteristic regions of the object graph (e.g.,
the input, the AST, and the NFA for the regular ex-
pression use case) as well as significant segments of
program behavior (e.g., the parsing, compilation, and
optimization stages in the same use case). Based on
this overview, we could develop and refine our mental
model of the explored system’s functioning and con-
nect it to particular classes and objects in their im-
plementation. Furthermore, the interactive visualiza-
tion helped us to explore and analyze communication
patterns, reflect on the system design, and share and
discuss our mental models with other developers.
Object Graph Layout. The structure of the object
graph layout is crucial for the comprehension of the
program state. Our force-directed graph approach
provides a simple yet effective way to describe a lay-
out based on different static and behavioral relations
between objects and allows different types of relations
to dominate the layout depending on the characteris-
tics of the program trace. Especially for smaller pro-
gram traces, the resulting layout allowed us to distin-
guish essential regions of the object graph. Still, the
overall structure of the force-directed layout could be
considered too weak for an optimal visual intuition.
Limitations. For larger program traces, we were
overwhelmed by the amount of objects and messages
in the visualization. Our configuration interface al-
lows users to reduce this complexity by filtering ob-
jects or improving the structure of the object graph
but requires manual effort for users. To reduce this
barrier, we could streamline the configuration through
an integrated GUI or investigate automatic configu-
ration techniques for individual program traces. To
eliminate cluttered communication between objects,
we aim to apply trace summarization techniques to
eliminate lengthy handshakes or low-level messages
(Hamou-Lhadj and Lethbridge, 2006).
4.3 Evaluation of Performance
While computational efficiency was not a design goal
for our current implementation of the TRACE4D pro-
totype, it already delivers practical performance –
start-up times between 1 and 5 seconds, frame rates
between 30 FPS and 60 FPS, memory consumption
between 700 MB and 1000 MB – for most of our con-
sidered program traces. Still, there is a need to opti-
mize the frame rate, graphics memory consumption,
and saving and loading times of traces to improve
user experience and scalability, e.g., by precomputing
filtered traces in the backend or applying a level-of-
detail strategy in the visualization. We provide addi-
tional details on our evaluation in the supplementary
materials.
5 CONCLUSIONS
In this paper, we proposed a novel approach to vi-
sualizing the behavior of object-oriented programs
through animated 2.5D object maps that depict par-
ticular objects and their interactions from a program
trace. We described the visual design of our approach
and implemented it in a prototypical web application
that displays program traces from a Squeak/Smalltalk
environment. We illustrated how programmers can
use TRACE4D to explore the behavior of object-
oriented programs and found that, especially for
smaller program traces, they can gain several insights
into the structure of the object graph and the segments
of program behavior. To handle larger program traces,
open issues are the automatic configuration of ob-
ject maps, the clarity of large object maps, and level-
of-detail approaches to show higher-level overviews
first.
For future work, we plan to extend the prototype
to include trace summarization and to improve scala-
bility in layout, rendering, and interaction. As a strik-
ing open point, a user study is needed to evaluate the
potential and limitations of animated object maps for
program comprehension. Further, the proposed ap-
proach to animated object maps allows for a couple
of different directions of research. For one, the force-
directed graph layout can be augmented with clus-
tering and hierarchical layout approaches (Atzberger
et al., 2023; Scheibel et al., 2018). Finally, we en-
vision animated object maps getting seamlessly in-
tegrated into programmers’ toolchains, interactively
visualizing system behavior at multiple levels of ab-
straction to provide an intuitive understanding of
complex software behavior.
ACKNOWLEDGMENTS
We thank Marcel Taeumel for discussing potential ap-
plications of the prototype with us.
Bringing Objects to Life: Supporting Program Comprehension Through Animated 2.5D Object Maps from Program Traces
667

REFERENCES
Atzberger, D., Cech, T., Scheibel, W., Limberger, D., and
Döllner, J. (2023). Visualization of source code sim-
ilarity using 2.5D semantic software maps. In VISI-
GRAPP 2021: Computer Vision, Imaging and Com-
puter Graphics Theory and Applications, pages 162–
182. Springer.
Balzer, M., Deussen, O., and Lewerentz, C. (2005). Voronoi
treemaps for the visualization of software metrics. In
Proc. SoftVis, pages 165–172. ACM.
Boothe, P. and Badame, S. (2011). Animation of object-
oriented program execution. In Proc. Bridges 2011:
Mathematics, Music, Art, Architecture, Culture, pages
585–588. Tessellations Publishing.
Brown, M. H. and Sedgewick, R. (1984). A system for al-
gorithm animation. In Proc. SIGGRAPH, pages 177–
186. ACM.
Cheng, Y.-P., Chen, J.-F., Chiu, M.-C., Lai, N.-W., and
Tseng, C.-C. (2008). XDIVA: A debugging visualiza-
tion system with composable visualization metaphors.
In Proc. SIGPLAN OOPSLA, pages 807–810. ACM.
Chi¸s, A., Gîrba, T., and Nierstrasz, O. (2014). The mold-
able debugger: A framework for developing domain-
specific debuggers. In SLE 2014: Software Language
Engineering, pages 102–121. Springer.
Cornelissen, B., Zaidman, A., van Deursen, A., and van
Rompaey, B. (2009). Trace visualization for program
comprehension: A controlled experiment. In Proc.
ICPC, pages 100–109. IEEE.
Dashuber, V. and Philippsen, M. (2022). Trace visualiza-
tion within the Software City metaphor: Controlled
experiments on program comprehension. Elsevier In-
formation and Software Technology, 150:55–64.
Dugerdil, P. and Alam, S. (2008). Execution trace visual-
ization in a 3D space. In Proc. ITNG, pages 38–43.
IEEE.
Fittkau, F., Waller, J., Wulf, C., and Hasselbring, W. (2013).
Live trace visualization for comprehending large soft-
ware landscapes: The ExplorViz approach. In Proc.
VISSOFT, pages 18:1–4. IEEE.
Gestwicki, P. and Jayaraman, B. (2005). Methodology and
architecture of JIVE. In Proc. SoftVis, pages 95–104.
ACM.
Gregg, B. (2016). The flame graph. Communications of the
ACM, 59(6):48–57.
Hamou-Lhadj, A. and Lethbridge, T. C. (2004). A survey of
trace exploration tools and techniques. In Proc. CAS-
CON, pages 42–55. IBM Press.
Hamou-Lhadj, A. and Lethbridge, T. C. (2006). Summa-
rizing the content of large traces to facilitate the un-
derstanding of the behaviour of a software system. In
Proc. ICPC, pages 181–190. IEEE.
Harrower, M. and Brewer, C. A. (2003). ColorBrewer.org:
An online tool for selecting colour schemes for maps.
The Cartographic Journal, 40(1):27–37.
Jerding, D. F. and Stasko, J. T. (1998). The Information
Mural: a technique for displaying and navigating large
information spaces. IEEE TVCG, 4(3):257–271.
Ko, A. J. and Myers, B. A. (2008). Debugging reinvented:
Asking and answering why and why not questions
about program behavior. In Proc. ICSE, pages 301–
310. ACM.
Krause, A., Hansen, M., and Hasselbring, W. (2021). Live
visualization of dynamic software cities with heat map
overlays. In Proc. VISSOFT, pages 125–129. IEEE.
Kruskal, J. B. and Landwehr, J. M. (1983). Icicle plots:
Better displays for hierarchical clustering. Taylor &
Francis The American Statistician, 37(2):162–168.
Lange, D. B. and Nakamura, Y. (1997). Object-oriented
program tracing and visualization. IEEE Computer,
30(5):63–70.
Langelier, G., Sahraoui, H., and Poulin, P. (2008). Explor-
ing the evolution of software quality with animated
visualization. In Proc. VLHCC, pages 13–20. IEEE.
Lemieux, F. and Salois, M. (2006). Visualization techniques
for program comprehension – a literature review. In
Proc. SoMeT, pages 22–47. IOS Press.
Lienhard, A., Ducasse, S., and Gîrba, T. (2009). Taking
an object-centric view on dynamic information with
object flow analysis. Elsevier Computer Languages,
Systems & Structures, pages 63–79.
Limberger, D., Scheibel, W., Döllner, J., and Trapp, M.
(2022). Visual variables and configuration of software
maps. Springer Journal of Visualization, 26(1):249–
274.
Moreno, A., Myller, N., Sutinen, E., and Ben-Ari, M.
(2004). Visualizing programs with Jeliot 3. In Proc.
AVI, pages 373–376. ACM.
Perscheid, M., Haupt, M., Hirschfeld, R., and Masuhara, H.
(2012). Test-driven fault navigation for debugging re-
producible failures. J-STAGE Information and Media
Technologies, 7(4):1377–1400.
Pothier, G. and Tanter, É. (2009). Back to the future: Om-
niscient debugging. IEEE Software, 26(6):78–85.
Reiss, S. P. (2007). Visual representations of executing pro-
grams. Elsevier Journal of Visual Languages & Com-
puting, 18(2):126–148.
Scheibel, W., Limberger, D., and Döllner, J. (2020a). Sur-
vey of treemap layout algorithms. In Proc. VINCI,
pages 1:1–9. ACM.
Scheibel, W., Trapp, M., Limberger, D., and Döllner, J.
(2020b). A taxonomy of treemap visualization tech-
niques. In Proc. IVAPP, pages 273–280. INSTICC,
SciTePress.
Scheibel, W., Weyand, C., and Döllner, J. (2018). EvoCells
– a treemap layout algorithm for evolving tree data. In
Proc. IVAPP, pages 273–280. SciTePress.
Sorva, J., Karavirta, V., and Malmi, L. (2013). A review
of generic program visualization systems for introduc-
tory programming education. ACM Transactions on
Computing Education, 13(4):1–64.
Thiede, C. and Rein, P. (2023). Squeak by example. Lulu,
6.0 edition.
Thiede, C., Taeumel, M., and Hirschfeld, R. (2023a).
Object-centric time-travel debugging: Exploring
traces of objects. In Proc. <Programming>, pages
54–60. ACM.
Thiede, C., Taeumel, M., and Hirschfeld, R. (2023b). Time-
awareness in object exploration tools: Toward in situ
omniscient debugging. In Proc. SIGPLAN Onward!,
pages 89–102. ACM.
IVAPP 2024 - 15th International Conference on Information Visualization Theory and Applications
668

von Mayrhauser, A. and Vans, A. M. (1995). Program com-
prehension during software maintenance and evolu-
tion. IEEE Computer, 28(8):44–55.
Walker, R. J., Murphy, G. C., Freeman-Benson, B., Wright,
D., Swanson, D., and Isaak, J. (1998). Visualizing
dynamic software system information through high-
level models. ACM SIGPLAN Notices, 33(10):271–
283.
Waller, J., Wulf, C., Fittkau, F., Döhring, P., and Hassel-
bring, W. (2013). SynchroVis: 3D visualization of
monitoring traces in the city metaphor for analyzing
concurrency. In Proc. VISSOFT, pages 2:1–4. IEEE.
Weninger, M., Makor, L., and Mössenböck, H. (2020).
Memory Cities: Visualizing heap memory evolution
using the software city metaphor. In Proc. VISSOFT,
pages 110–121. IEEE.
Wettel, R. and Lanza, M. (2007). Visualizing software sys-
tems as cities. In Proc. VISSOFT, pages 92–99. IEEE.
Bringing Objects to Life: Supporting Program Comprehension Through Animated 2.5D Object Maps from Program Traces
669
