
Process-Aware Analysis of Treatment Paths in Heart Failure Patients:
A Case Study
Harry H. Beyel
1 a
, Marlo Verket
2 b
, Viki Peeva
1 c
, Christian Rennert
1 d
, Marco Pegoraro
1 e
,
Katharina Sch
¨
utt
2 f
, Wil M. P. van der Aalst
1 g
and Nikolaus Marx
2 h
1
Chair of Process and Data Science (PADS), RWTH Aachen University, Aachen, Germany
2
Department of Internal Medicine I, RWTH Aachen University Hospital, Aachen, Germany
Keywords:
Process Mining, Healthcare, Heart Failure, Patient Cohort Analysis.
Abstract:
Process mining in healthcare presents a range of challenges when working with different types of data within
the healthcare domain. There is high diversity considering the variety of data collected from healthcare pro-
cesses: operational processes given by claims data, a collection of events during surgery, data related to
pre-operative and post-operative care, and high-level data collections based on regular ambulant visits with no
apparent events. In this case study, a data set from the last category is analyzed. We apply process-mining
techniques on sparse patient heart failure data and investigate whether an information gain towards several
research questions is achievable. Here, available data are transformed into an event log format, and process
discovery and conformance checking are applied. Additionally, patients are split into different cohorts based
on comorbidities, such as diabetes and chronic kidney disease, and multiple statistics are compared between
the cohorts. Conclusively, we apply decision mining to determine whether a patient will have a cardiovascular
outcome and whether a patient will die.
1 INTRODUCTION
Heart Failure (HF) is a complex chronic disease, and
the prevalence of HF continues to increase globally.
HF is one of the main causes of hospitalization for
subjects aged 65 years or older, resulting in high costs
and a major social impact. The management of multi-
modal treatment for patients with chronic HF is com-
plex. Despite good treatment, patients with HF still
have a poor prognosis, and about 15% to 25% die
within the first five years after their diagnosis. In
the presence of comorbidities, such as diabetes and
chronic kidney disease, this rate rises at least by a 2-
fold factor to about 50%. (Romero-Gonz
´
alez et al.,
2020). With an abundance of clinical trials focus-
ing on treatment strategies to reduce Cardiovascular
a
https://orcid.org/0000-0002-6541-3848
b
https://orcid.org/0000-0002-3361-3722
c
https://orcid.org/0000-0001-7144-5136
d
https://orcid.org/0000-0003-4614-6171
e
https://orcid.org/0000-0002-8997-7517
f
https://orcid.org/0000-0002-0162-5219
g
https://orcid.org/0000-0002-0955-6940
h
https://orcid.org/0000-0001-6141-634X
Outcomes (COs), such as Hospitalization for Heart
Failure (HHF) and cardiovascular or all-cause mor-
tality (Sattar et al., 2021; Zelniker et al., 2019), it is
still hard to predict which patients respond positively
to treatment strategies and which do not. A possible
solution to gain insights into the treatment responses
of patients when data are recorded is process mining.
The process-mining discipline can generally be
split into three main areas: process discovery, confor-
mance checking, and process enhancement (van der
Aalst, 2016). Process-discovery techniques extract
a comprehensible process model that represents the
underlying behavior in the data. Conformance-
checking techniques quantify how well a process
model represents the behavior in the recorded data.
Process-enhancement techniques can decorate a pro-
cess model with additional information and insights
about the process, e.g., about time, frequency, and
explanations of decision points. While the field of
process mining originated in the context of business
processes, it has been applied with remarkable suc-
cess to a number of other disciplines in recent years.
A prominent example of such disciplines is health-
care science (Mans et al., 2015; Munoz-Gama et al.,
2022). More specifically, the last few years have seen
506
Beyel, H., Verket, M., Peeva, V., Rennert, C., Pegoraro, M., Schütt, K., van der Aalst, W. and Marx, N.
Process-Aware Analysis of Treatment Paths in Heart Failure Patients: A Case Study.
DOI: 10.5220/0012392600003657
Paper published under CC license (CC BY-NC-ND 4.0)
In Proceedings of the 17th International Joint Conference on Biomedical Engineering Systems and Technologies (BIOSTEC 2024) - Volume 2, pages 506-515
ISBN: 978-989-758-688-0; ISSN: 2184-4305
Proceedings Copyright © 2024 by SCITEPRESS – Science and Technology Publications, Lda.

Patient data
Event log
Process model
Differences in activity
frequencies
Cohort logs
Preprocessing and
transformation
Decision mining
Domain knowledge
Figure 1: Overview of our work.
a surge of process mining analyses of medical data,
propelled by advancements in healthcare information
systems and by the ever-increasing demand for data-
centric solutions to aid in the management of critical
situations such as epidemics (Pegoraro et al., 2021;
Benevento et al., 2022). Applications include the
analysis of clinical pathways, patient behavior, and
personnel tasks for a large array of diseases (Guzzo
et al., 2022).
In this paper, we contribute to the literature on pro-
cess mining in cardiology by reporting our findings
on data recorded for patients with HF treated within
the Aachen Longitudinal Heart Failure and Diabetes
Registry Study (ALIDIA). An overview of our work
is shown in Figure 1. First, we transform patient data
into an event log suitable for process mining. Second,
we discover a collection of patients’ treatment paths
and decide on a representative process model. Third,
we compare different subgroups of patients concern-
ing the frequency of events. Fourth, we discover rea-
sons for certain decisions in our process model.
The remainder of this paper is organized as fol-
lows. In Section 2, we present related work to this
study. In Section 3, we lay down preliminary con-
cepts. Subsequently, in Section 4, we present the col-
lected data. In Section 5, we preprocess the available
data to select the information we consider in the re-
mainder and transform the resulting data into an event
log suitable for process-mining techniques. Section 6
analyzes the treatment paths using alignment-based
conformance checking. In Section 7, we split the pa-
tients into different cohorts, considering whether they
suffer from diabetes or chronic kidney disease, and
analyze the similarities and dissimilarities between
the cohorts. Section 8 presents an analysis of the deci-
sion points in the treatment process. We report our re-
sults together with the challenges we faced analyzing
this type of data. Section 9 concludes the paper, sum-
marizing our findings, pointing out limitations, and
providing points for future work.
2 RELATED WORK
In (de Vries et al., 2017), a case study is pre-
sented showing how to apply process mining to
electronic-medical-record data when dealing with
sepsis. In (Back et al., 2020), patient flows in a sur-
gical ward are mined. The identification of disease
trajectory models is investigated in (Kusuma et al.,
2020). The authors apply transformations to an event
log to later apply process-mining tools. Also, process
mining has a substantial history in cardiology. Early
attempts (Mans et al., 2008) compared process mod-
els for the treatment process of stroke in different hos-
pitals and showed a process model for the pre-hospital
process.
There has also been a focus on developing mod-
els for HF. Frameworks for the 30-day re-admission
risk management and prediction of HF using ma-
chine learning, Divide-n-Discover, and applying data
mining techniques have been explored and applied.
(Kerexeta et al., 2018; Roy and Chin, 2014; Chin
et al., 2014). Additionally, a regression model for
time series using hospital admissions was developed
to understand better the impact of environmental fac-
tors, such as weather and air quality, from an open
dataset on HF (Artola et al., 2019). Other factors in
a patient’s therapy, like the feasibility and usability
of devices, have been summarized for telemedicine
(Zweth et al., 2018). Other systems, like Computer
Interpretable Guidelines, have been used to model
when a patient, during treatment of a comorbidity,
develops HF (Bottrighi et al., 2018). Furthermore,
the TranSMART tool and the Alfresco platform have
been applied to a workflow from patient data collec-
tion to data processing in identifying therapeutic tar-
gets for HF with preserved ejection fraction (Almeida
et al., 2020). There are several approaches in manag-
ing HF, in particular within the timeframe of 30-day
re-admission or providing frameworks for biomark-
ers. This paper aims to fill the gap by attempting to
use different factors in the patient pathways, including
diabetes and chronic kidney disease as comorbidities.
Our goal is to kickstart an underexplored research di-
rection: the analysis of COs in heart failure patients
through a combination of process-aware and statisti-
cal analysis techniques, with the objective of under-
standing (and eventually preventing) the insurgence
of cardiovascular outcomes.
3 PRELIMINARIES
In this section, we formally introduce concepts that
are the basics of the techniques we introduce later.
Process-Aware Analysis of Treatment Paths in Heart Failure Patients: A Case Study
507

Table 1: Example event log.
RowID Case Activity Timestamp
1 1337 a 2023-01-21
2 1337 b 2023-02-15
3 1337 c 2023-05-05
4 1338 d 2023-06-01
5 1338 e 2023-06-19
6 1338 c 2023-07-20
Given a set X , a sequence σ ∈ X
∗
assigns an enumer-
ation to elements of the set. We denote this with σ =
⟨σ
1
, . . . , σ
n
⟩. In the remainder, we refer with σ
i
to the
sequence’s i-th element.To concatenate sequences, we
use the symbol ·, i.e., ⟨σ
1
, . . . , σ
n
⟩ · ⟨σ
′
1
, . . . , σ
′
m
⟩ =
⟨σ
1
, . . . , σ
n
, σ
′
1
, . . . , σ
′
m
⟩ for n ∈ N and m ∈ N. Given
a set X , B(X) denotes the set of all multisets over set
X. For example, if X = {x, y, z}, a possible bag is
[x, x, y] = [x
2
, y]. To combine multisets, we use ⊎, for
instance, [x, y] ⊎ [x, z] = [x, y, x, z] = [x
2
, y, z].
To apply process-mining techniques, we need an
event log. An event log consists of at least three
mandatory attributes: case identifier, activty name,
and timestamp. We use U
case
as the universe of case
identifiers, U
act
as the universe of activity names, and
U
time
as the universe of timestamps. The following
defines an event log.
Definition 1 (Event Log). U
ev
is the universe of
events. e ∈ U
ev
is an event, π
act
(e) ∈ U
act
is the
activity of e, π
case
(e) ∈ U
case
is the case of e, and
π
time
(e) ∈ U
time
the timestamp of e. An event log
L ⊆ U
ev
is a set of events. For simplicity, we assume
that other, here non-defined, functions can be applied
to the event, resulting in more attributes.
An example event log is displayed in Table 1.
In the remainder of this work, we use Petri nets as
process model representations. Introduction to them
is provided in (van der Aalst, 2016; Reisig, 1985).
In this work, we refer to τ-transitions, respectively,
silent transitions. In Petri nets, silent transitions pro-
vide a flexible and expressive mechanism for model-
ing various aspects of process behavior. They enable
the representation of internal actions, improving Petri
nets’ modeling capabilities. Silent transitions can act
as synchronization points, waiting for specific condi-
tions to be met before allowing subsequent transitions
to fire. In our figures, they are represented as black
transitions. Besides, we use conformance-checking
techniques to measure a process model’s fitness, pre-
cision, and generalization scores. (Carmona et al.,
2018) provide an introduction to these measurements.
4 DATA COLLECTION AND
PREPARATION
The data we analyze in this work consists of HF pa-
tients treated in the Aachen Longitudinal Heart Fail-
ure and Diabetes Registry Study (ALIDIA) between
April 2019 and May 2023. The original data are in
a tabular format and contain two disjoint sets of data
records for each patient: outpatient clinical visit infor-
mation and cardiovascular outcome. We joined these
two sets, resulting in one concise set capturing the
patient data. We define the following Cardiovascular
Outcomes (COs):
• Hospitalization for heart failure: The day of hos-
pitalization is defined as when the patient is ad-
mitted to the emergency room due to clinical man-
ifestations of HF (new or worsening) (HF).
• Hospitalization for myocardial infarction: The
day of hospitalization is defined as when the pa-
tient is admitted to the emergency room for non-
ST-elevation myocardial infarction or ST-segment
elevation myocardial infarction (MI).
• Hospitalization for stroke: The day of hospitaliza-
tion is defined as when the patient is admitted to
the emergency room for a transient ischemic at-
tack or stroke (Stroke).
• Hospitalization for cardiovascular diseases: Hos-
pitalisations that were attributed to a cardiovascu-
lar disease (CV) cause and not attributed to other
previous categories were defined as hospitaliza-
tion for CV diseases (CV).
• Death due to any cause: All deaths not attributed
to the category of HF were defined as death due to
any cause (Death AnyCause).
• Death due to heart failure: When the death oc-
curred in the context of decompensation HF, this
death was defined as due to HF (Death HF).
Moreover, the patient data captures medication in-
formation. To evaluate the changes in HF medica-
tion, the different substances within a drug class were
converted to unity value, using the HF guidelines
from the European Society of Cardiology (McDon-
agh et al., 2021). In the following, we describe the
features of the patient data in more detail. U
PatID
is
the universe of patient ids.
• PatID: unique identification number allocated to a
specific patient (U
PatID
).
• LVEF: left ventricular ejection fraction is the per-
centage of the amount of blood in the left ventricle
pumped with each contraction.
HEALTHINF 2024 - 17th International Conference on Health Informatics
508

• HFrEF: HF with reduced ejection fraction is de-
fined as LVEF ≤ 40% .
• HFmrEF: HF with mildly reduced ejection frac-
tion is defined as LVEF between 40% and 49%.
• HFpEF: HF with preserved ejection fraction is
defined as LVEF ≥ 50% and symptoms and signs
of HF.
• Weight: biomarker that provides an alert for wors-
ening HF, when rapid weight gain is present.
• HF diagnosis: the year the patient is diagnosed
with HF.
• NT pro-BNP: biomarker for diagnosing and sever-
ity of HF.
• Diabetes: underlying disease that may augment
CO.
• CKD: chronic kidney disease, an additional un-
derlying disease that may augment CO.
• Outcome: COs as defined above, covering HF,
stroke, MI, CV, death due to any cause, and death
due to HF.
• WBC: white blood cell count, a biomarker for in-
dicating an infection or inflammation.
• hsTNT: high-sensitivity cardiac troponin T, a
biomarker for myocardial injury, including is-
chemia.
• IL-6: Interleukin-6 is a biomarker for inflamma-
tory response and is associated with the risk for
mortality and cardiovascular outcomes.
• Urea: a biomarker that indicates the kidney func-
tionality.
• Beta-blocker: HF medication to reduce mortality
and morbidity for patients with HF.
• ACE-I/ARNI: angiotensin-converting enzyme in-
hibitors (ACE-I) or an angiotensin receptor-
neprilysin inhibitor (ARNI), HF medication to re-
duce the risks of morbidity and mortality.
• SGLT-2: sodium-glucose co-transporter 2 in-
hibitors, HF medication to reduce HF-related hos-
pitalization and CV death.
• MRA: mineralocorticoid receptor antagonists, HF
medication to reduce mortality and the risk of hos-
pitalization for HF.
• Time: timestamp of record (U
time
)
The collected data consist of 240 different patients
and 1000 instance. An example of patient data is de-
picted in Table 2. Each row corresponds to a patient
data instance (U
pd
). An absence of information is de-
noted with ⊥.
A formal representation of patient data is pre-
sented in the following.
Definition 2 (Patient Data and Sequences). U
pd
is
the universe of patient data instances. d ∈ U
pd
is a patient data instance. The previously intro-
duced domains and meaning of attributes hold, i.e.,
π
PatID
(d) ∈ U
PatID
is the patient id of d and π
time
(d) ∈
U
time
the timestamp of d. Additionally, π
LV EF
(d) is
the LVEF value of d, π
HFrEF
(d) signals if the instance
d is related to an HFrEF patient, etc. Patient data
P ⊆ U
pd
is a set of patient data instances. The data
for a patient are stored in P
id
= {p ∈ P | π
PatID
(p) =
id}. seq
id
is the sequential representation of P
id
such
that for seq
id
= ⟨d
1
, . . . , d
n
⟩ of length n, the elements
d
1
∈ P
id
, . . . , d
n
∈ P
id
are sorted by timestamp from
earliest to latest, i.e., π
time
(d
1
) ≤ ··· ≤ π
time
(d
n
).
5 DATA PREPROCESSING AND
TRANSFORMATION
To make the data accessible for process mining, we
need to preprocess and transform the data. We pre-
process the data by abstracting the level of detail
and deriving new attributes based on existing ones.
For example, medication dose changes might be ab-
stracted to medication increase and medication de-
crease, or the values binned in several categories.
Similarly, the same procedure is done for measured
lab values. After pre-processing the data, we convert
our data to an event log to apply process-mining tech-
niques. This implies identifying case, activity, and
timestamp attributes. Concerning cases, we use the
provided patient id attribute. As a result, each case re-
flects the treatment path of a patient. As timestamps,
we use the ones provided in the patient data. Deter-
mining the activity attribute is more challenging since
it is the only one of the primary attributes (case, ac-
tivity, timestamp), for which there is a multitude of
options to choose from, and choosing one or another
would result in different study focuses. In this work,
with the help of domain experts, we decided to focus
on a specific subset of COs. The transformations we
present in the rest of this section are made with this
goal in mind. We applied a rule-based approach. If a
datum in the patient data consists of a CO, we use the
outcome as an activity. Otherwise, for each patient,
we check whether a visit happens before or after such
an outcome. If it happens before, we assign it as activ-
ity “Visit before CO”; otherwise, we assign “Visit af-
ter CO”. We use the previously introduced sequences
(seq
id
) for the transformation process. First, we split
the sequences into two halves: the part before the first
CO and the part containing the first CO.
Process-Aware Analysis of Treatment Paths in Heart Failure Patients: A Case Study
509

Table 2: Example record of patient data.
RowID PatID LVEF HFrEF HFmrEF HFpEF Weight HF diagnosis NT pro-BNP Diabetes CKD Outcome WBC hsTNT IL-6 Urea Beta-Blocker ACE-I/ARNI SGLT-2 MRA Timestamp
1 007 50 0 0 1 80 2017 750.5 1 ⊥ ⊥ ⊥ 24.9 10.5 38 100 50 10 12.5 2023-02-20
2 007 50 0 0 1 80 2017 750.5 1 ⊥ HF ⊥ 24.9 10.5 38 100 50 10 12.5 2023-02-21
3 007 50 0 0 1 80 2017 750.5 1 ⊥ Death HF ⊥ 24.9 10.5 38 100 50 10 12.5 2023-02-20
4 008 10 1 0 0 99 2012 ⊥ ⊥ ⊥ ⊥ 10.2 24.9 10.5 ⊥ ⊥ ⊥ 15 ⊥ 2023-02-20
Definition 3 (Sequence Before and After Outcome).
Let P ⊆ U
pd
be a set of patient data instances and P
id
and seq
id
be defined as before. seq
id
= pre
id
· post
id
,
with seq
id
= ⟨d
1
, . . . , d
i
⟩ · ⟨d
i+1
, . . . , d
n
⟩, such that for
all d
j
∈ pre
id
, j ∈ {1, . . . , i}, π
Outcome
(d
j
) = ⊥ and
π
Outcome
(d
i+1
) ̸= ⊥.
For our example data (Table 2), there are the fol-
lowing sequences: pre
007
= ⟨1⟩, post
007
= ⟨2, 3⟩,
pre
008
= ⟨4⟩, post
008
= ⟨ ⟩.
In the following, we transform each datum in a
sequence before a CO into an event.
Definition 4 (Transformation Before Outcome). Let
P ⊆ U
pd
be a set of patient data instances and P
id
and seq
id
and pre
id
be defined as before. Let L ⊆ U
ev
be an event log. There exists a function trans
pre
that
maps each element of the sequence pre
id
of length n,
d
i
∈ pre
id
, i ∈ {1, . . . , n}, to an event such that the
following holds:
• π
PatID
(d
i
) = π
case
(trans
pre
(d
i
))
• “Visit before CO” = π
act
(trans
pre
(d
i
))
• π
time
(d
i
) = π
time
(trans
pre
(d
i
))
Moreover, the values for the different patient data at-
tributes for all d
i
∈ pre
id
are the same for the mapped
event.
Finally, we transform each datum in a sequence
after a CO into an event.
Definition 5 (Transformation After Outcome). Let
P ⊆ U
pd
be a set of patient data instances and P
id
and seq
id
and post
id
be defined as before. Let L ⊆ U
ev
be an event log. There exists a function trans
post
that
maps each element of the sequence post
id
of length n,
d
i
∈ post
id
, i ∈ {1, . . . , n}, to an event such that the
following holds:
• π
PatID
(d
i
) = π
case
(trans
post
(d
i
))
• “Visit after CO” = π
act
(trans
post
(d
i
)) if
π
Outcome
(d
i
) = ⊥
• π
Outcome
(d
i
) = π
act
(trans
post
(d
i
)) if
π
Outcome
(d
i
) ̸= ⊥
• π
time
(d
i
) = π
time
(trans
post
(d
i
))
Moreover, the values for the different patient data at-
tributes for all d
i
∈ post
id
are the same for the mapped
event.
We apply these steps to all patients contained in
the data. The result of applying these steps to the pa-
tient data portrayed in Table 2 is displayed in Table 3.
Visit before CO CV
HF
Death_AnyCause
p1
Visit after CO
Visit before CO
HF
p2
p3
p4
p5
HF
Visit after CO
HF
Visit after CO
Figure 2: De-facto model of treatment paths.
Applying these steps to our patient data leads to
an event log with 240 cases (i.e., patients) and 1000
events.
6 OBTAINING TREATMENT
PATHS
In this section, we investigate the nature and be-
havior of the treatment paths of patients obtained
in the previous section. To observe the treatment
paths, we use process models, in particular, the afore-
mentioned Petri nets. To validate whether the re-
ceived process models are representative and the data
is compliant, we apply conformance-checking tech-
niques. In particular, we measure fitness by utiliz-
ing alignments with a standard cost function (Adri-
ansyah et al., 2011), computed precision (Adriansyah
et al., 2015) and generalization (Buijs et al., 2014)
scores, as well as the simplicity of the model (Weerdt
et al., 2010). In addition, we computed F1 scores
using the obtained fitness and precision scores. To
receive process models, we applied several process
discovery algorithms to the transformed event log,
all implemented in ProM
1
. Moreover, we consulted
domain experts to construct a de-jure model. The
conformance-checking results are shown in Table 4.
As denoted, the process-discovery algorithms
yield various results. Four models have a fitness score
of 1.0, and six models have a precision score of 1.0.
The best generalization score is 0.89, achieved by six
models. One model has a simplicity score of 1.0, far
better than the second-best score (0.9). Concerning
the F1 score, the best score is 0.95, achieved by the
model discovered by the directly-follows miner us-
ing all activities and 90% of paths. This model is de-
picted in Figure 2. However, this model has some
1
Available at https://promtools.org/.
HEALTHINF 2024 - 17th International Conference on Health Informatics
510
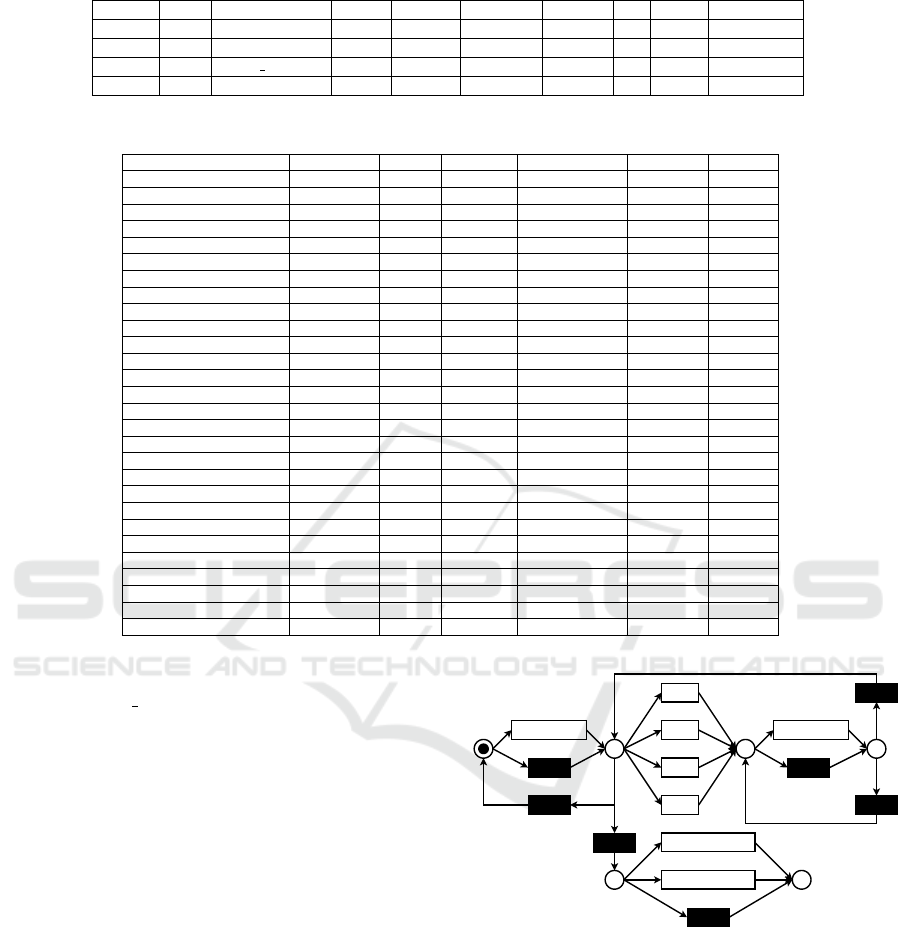
Table 3: Example transformed event log.
RowID Case Activity LVEF HFrEF HFmrEF HFpEF . . . MRA Timestamp
1 007 Visit before CO 50 0 0 1 . . . 12.5 2023-02-20
2 007 HF 50 0 0 1 . . . 12.5 2023-03-14
3 007 Death HF 50 0 0 1 . . . 12.5 2023-04-15
4 008 Visit before CO 10 1 0 0 . . . ⊥ 2023-06-18
Table 4: Conformance checking results.
Algorithm Parameters Fitness Precision Generalization Simplicity F1 score
Alpha - 0.39 0.44 0.70 0.85 0.41
Alpha+ - 0.39 0.44 0.70 0.85 0.41
Alpha++ - - - - - -
Alpha# - 0.96 0.57 0.78 1.00 0.72
Directly-follows Miner 0.0 (paths) - - - - -
Directly-follows Miner 0.1 (paths) 0.75 1.00 0.89 0.78 0.86
Directly-follows Miner 0.2 (paths) 0.75 1.00 0.89 0.78 0.86
Directly-follows Miner 0.3 (paths) 0.75 1.00 0.89 0.78 0.86
Directly-follows Miner 0.4 (paths) 0.75 1.00 0.89 0.78 0.86
Directly-follows Miner 0.5 (paths) 0.75 1.00 0.89 0.78 0.86
Directly-follows Miner 0.6 (paths) 0.75 1.00 0.89 0.78 0.86
Directly-follows Miner 0.7 (paths) 0.84 0.98 0.86 0.68 0.90
Directly-follows Miner 0.8 (paths) 0.91 0.96 0.84 0.63 0.93
Directly-follows Miner 0.9 (paths) 0.97 0.94 0.76 0.52 0.95
Directly-follows Miner 1.0 (paths) 1.00 0.72 0.48 0.47 0.83
Inductive Miner complete - 1.00 0.62 0.80 0.64 0.77
Inductive Miner frequent 0.0 1.00 0.63 0.80 0.63 0.77
Inductive Miner frequent 0.1 0.99 0.59 0.82 0.61 0.74
Inductive Miner frequent 0.2 0.96 0.55 0.82 0.60 0.70
Inductive Miner frequent 0.3 0.46 0.74 0.77 0.62 0.57
Inductive Miner frequent 0.4 0.45 0.74 0.77 0.64 0.56
Inductive Miner frequent 0.5 0.41 0.82 0.77 0.70 0.55
Inductive Miner frequent 0.6 0.41 0.82 0.77 0.70 0.55
Inductive Miner frequent 0.7 0.33 0.79 0.75 0.78 0.47
Inductive Miner frequent 0.8 0.33 0.79 0.75 0.78 0.47
Inductive Miner frequent 0.9 0.33 0.79 0.75 0.78 0.47
Inductive Miner frequent 1.0 0.27 0.67 0.66 0.90 0.38
De-jure model - 1.00 0.56 0.79 0.54 0.72
issues. First, not all activities are represented as ac-
tivities. “Death HF”, “MI”, and “Stroke” are miss-
ing. Second, the model does not show the possible
paths as given in the data. For example, a patient that
has an HF (p2) can never die. Third, the structure
of the process model limits us in applying process-
enhancement techniques such that conclusions for do-
main experts are possible. As a result, we use the de-
jure model. The advantage of this model is its struc-
ture, allowing for decision-mining applications inter-
esting for domain experts. The model is depicted in
Figure 3. In the following, we describe the behavior
captured in the model. Starting from the initial mark-
ing, there is a choice between having a visit or not.
Independently from the choice, the next place is p1.
In p1, there are multiple choices. First, one of the
cardiovascular outcomes may happen. Second, a visit
may happen again, potentially more than two times.
Third, the record of patients ends, either with their
death or there is no more record (p4). Firing one of
the cardiovascular outcomes leads to place p2. Next,
there is a choice between a visit or no visits, leading
to place p3. In place p3, there is a choice between
having another visit or switching to place p1.
Visit before CO
CV
Stroke
MI
HF
Death_HF
Death_AnyCause
p1 p2
Visit after CO
p3
p4 p5
Figure 3: De-jure model of treatment paths.
7 COHORT COMPARISON
In this section, we compare different patient cohorts
of our data. First, we present how we split up the
data and provide reasons. Second, we discover statis-
tically significant differences concerning the amount
of activity frequencies.
Process-Aware Analysis of Treatment Paths in Heart Failure Patients: A Case Study
511

7.1 Dividing the Data
We divided the patient population based on three char-
acteristics: (1) which HF phenotype the patient ini-
tially exhibited; (2) whether the patient had diabetes
or not; (3) whether the patient had chronic kidney dis-
ease (CKD) or not. Patients with HF can be divided
into three groups: patients with reduced (HFrEF),
mildly reduced (HFmrEF), or preserved (HFpEF) left
ventricular ejection fraction (LVEF). All phenotypes
are based on LVEF with the presence of signs and
symptoms of HF. As introduced earlier, HFrEF is
classified with LVEF ≤40%, HFmrEF is defined with
LVEF between 40% and 49%, and HFpEF is with
LVEF ≥50% (McDonagh et al., 2021). This group-
ing allows for tailored treatment strategies. CKD is
defined as showing at least one marker of kidney dam-
age or persistently reduced estimated glomerular fil-
tration (eGFR) rate of <60 ml/min per 1.73m
2
for
>3 months (Levin et al., 2013). CKD and HF are
concurrent diseases that accelerate the progression of
outcomes, thus leading to an increase in risk for hos-
pitalization and death. Furthermore, diabetes is de-
fined as HbA1c value ≥ 6.5% (≥ 48 mmol/mol), or
when the patient is treated with anti-diabetic medica-
tion. There are two types of diabetes: Type 1 and Type
2. Over 90% of cases are Type 2 diabetes. Similarly
to CKD, patients with HF and diabetes have a higher
risk of cardiovascular mortality, including death due
to worsening HF, compared to those without diabetes.
We exclude patients with Type 1 diabetes.
7.2 Differences in Frequencies of
Activities
First, we count the occurrences for each activity in a
given case (i.e., a patient treatment path).
Definition 6 (Occurrence count: case). Let L ⊆ U
ev
be an event log, act ∈ U
act
be an activity, and case ∈
U
case
be a case. count
c
is a function that counts how
often an activity occurs in a given case for a given log,
i.e., count
c
(act, case, L) = |{e ∈ L | π
case
(e) = case ∧
π
act
(e) = act}|.
In the next step, we perform this action on all
cases of a given event log, resulting in a multiset,
in which the cardinality of each element denotes the
number of occurrences of the given activity in a case.
Definition 7 (Occurrence count: event log). Let L ⊆
U
ev
be an event log and act ∈ U
act
be an activity.
Then C
L
= {π
case
(e) | e ∈ L} provides all cases of an
event log L. count
l
is a function that returns a multiset
of case-wise occurrences of an activity in an event log,
i.e., count
l
(act, L) =
U
case∈C
L
[count
c
(act, case, L)].
Table 5: P-values after applying Kruskal-Wallis test
(Kruskal and Wallis, 1952) concerning diabetes (yes or no)
and different LVEF categories (HFrEF, HFmrEF, HFpEF),
resulting in six groups for each activity.
Activity p-value
Visit before CO 0.151
Visit after CO 0.566
Hosp CV 0.485
Hosp HF 0.205
Hosp Stroke 0.841
Hosp MI 0.225
Death AnyCause 0.137
Death HF 0.017
Table 6: P-values after applying Kruskal-Wallis test
(Kruskal and Wallis, 1952) concerning CKD (yes or no)
and different LVEF categories (HFrEF, HFmrEF, HFpEF),
resulting in six groups for each activity.
Activity p-value
Visit before CO 0.550
Visit after CO 0.549
Hosp CV 0.376
Hosp HF 0.113
Hosp Stroke 0.949
Hosp MI 0.213
Death AnyCause 0.287
Death HF 0.183
Applying this on the event log shown in Table 3
concerning activity “Visit before CO” leads to [1, 1],
concerning activity “HF” leads to [1, 0].
We apply this methodology considering all activ-
ities. We consider two greater cohorts: patients who
have or do not have diabetes and different LVEF cat-
egories (HFrEF, HFmrEF, HFpEF); and patients who
have or do not have CKD and different LVEF cate-
gories (HFrEF, HFmrEF, HFpEF). Each cohort con-
sists of six groups. We applied the Kruskal-Wallis
test (Kruskal and Wallis, 1952) to check for differ-
ences between groups for each cohort. The Kruskal-
Wallis test is a non-parametric version of the ANOVA
test (Fisher, 1992). If there is a statistically significant
difference in the number of occurrences, we applied
Dunn’s test (Dunn, 1964) with Bonferroni adjustment
to check which group differs.
The results concerning Kruskal-Wallis tests
(Kruskal and Wallis, 1952) are shown in Tables 5
and 6.
We consider a difference statistically significant if
a p-value is smaller than 0.05. In Tables 5 and 6, such
a value can only be noted in Table 5, when consid-
ering the activity ‘Death AnyCause”, diabetes (yes or
no), and different LVEF categories (0.017). As a re-
sult, Dunn’s test (Dunn, 1964) with Bonferroni ad-
HEALTHINF 2024 - 17th International Conference on Health Informatics
512

Table 7: Adjusted p-values after applying Dunn’s test (Dunn, 1964) with Bonferroni adjustment concerning the activity
“Death AnyCause”, diabetes (D, yes (1) or no (0)), and different LVEF categories.
D=0 and HFmrEF D=0 and HFpEF D=0 and HFrEF D=1 and HFmrEF D=1 and HFpEF D=1 and HFrEF
D=0 and HFmrEF 1.00 1.00 1.00 1.00 1.00 0.45
D=0 and HFpEF 1.00 1.00 1.00 1.00 1.00 0.11
D=0 and HFrEF 1.00 1.00 1.00 1.00 1.00 0.01
D=1 and HFmrEF 1.00 1.00 1.00 1.00 1.00 0.36
D=1 and HFpEF 1.00 1.00 1.00 1.00 1.00 1.00
D=1 and HFrEF 0.45 0.11 0.01 0.36 1.00 1.00
Table 8: Distribution of next activities for places p1 and p4.
Place and population None HF CV Stroke MI Death AnyCause Death HF
Place p1(all patients) 91.86 5.78 1.90 0.30 0.15 - -
Place p1 (HFrEF patients) 91.30 6.10 2.10 0.40 0.10 - -
Place p4 (all patients) 98.29 - - - - 1.39 0.33
Place p4 (HFrEF patients) 97.89 - - - - 1.71 0.40
justment is applied to observe which groups differ.
The result is displayed in Table 7.
As it can be noted, the group having diabetes and
being associated with HFrEF is different from nearly
all other groups. However, a stronger statistically sig-
nificant difference can be noted between the men-
tioned group of patients and patients having no dia-
betes and being part of the HFrEF group. As a result,
“Death AnyCause” happens statistically significantly
more often for HFrEF patients if they have diabetes.
8 INVESTIGATING REASONS
In this section, we investigate the reasons for deci-
sions in the model. To investigate the reasons, two
things are required: the transformed event log and at
least one decision point. A decision point is a place
in a Petri net with more than one outgoing arc. There
are two interesting decision points in the model shown
in Figure 3: places p1 and p4. The former is a deci-
sion point concerning COs. The latter points out the
decision between two death options and the end of a
patient’s record. Using the event log, we use the infor-
mation associated with the events to discover the rea-
sons behind the decision. Since HFrEF patients are in
a worse state than the others, we additionally applied
our approach to records containing patients with that
characteristic separately. The probability distribution
for the outcomes of the mentioned places considering
the whole population and the HFrEF patients is dis-
played in Table 8. We summarised the execution of
τ-transitions as “None”.
The results of applying various classification tech-
niques are displayed in Table 9. In the following, we
investigate the different decision points in greater de-
tail.
8.1 Reasons for Cardiovascular
Outcomes
COs are highly interesting events in the strategy for
patients’ treatment. Understanding why they happen
can lead to improvements in the treatment process,
such that these outcomes are avoided. The choice be-
tween COs is taking place in place p1 in the Petri net
depicted in Figure 3. As shown in Table 8, a CO ac-
tivity rarely happens. Considering the whole popu-
lation, a non-CO activity is executed 91.86% of the
time. The algorithms adopt this behavior, conduct a
majority vote, and achieve similar accuracy, as shown
in Table 9. When we consider only HFrEF patients,
we observe that 91.3% of the time, a non-CO activity
is executed. At the same time, the accuracy of the al-
gorithms is slightly better, with an accuracy of 91.4%
(naive Bayes, decision trees, gradient-boosted trees,
and support vector machines). However, the differ-
ence is negligible. We conclude that predicting a CO
activity, given our data, is not possible. The distribu-
tion over the different classes is skewed, and sampling
was infeasible based on the limited data.
8.2 Reasons for Death
As stated, in place p4 in the model depicted in Fig-
ure 3, the decision between a patient’s death and the
end of a patient’s records takes place. In the follow-
ing, we analyze the reasons for the whole popula-
tion and HFrEF patients. Considering the distribu-
tion of activities, as shown in Table 8, a death activ-
ity happens rarely. Considering the whole population,
98.29% of the time, the records of patients end with-
out death. However, as shown in Table 9, the accu-
racy is at most 98%. When considering only HFrEF
patients, 97.89% of the time, the records of patients
end without death. The classifiers have an accuracy of
98.6%, which is better than the majority vote and our
Process-Aware Analysis of Treatment Paths in Heart Failure Patients: A Case Study
513

Table 9: Highest measured accuracy of prediction measured using multiple strategies for different places and patient popula-
tions in the model shown in Figure 3.
Place and population
Naive
Bayes
Generalized
Linear
Model
Logistic
Regression
Fast
Large
Margin
Deep
Learning
Decision
Tree
Random
Forest
Gradient
Boosted
Trees
Support
Vector
Machine
Place p1 (all patients) 91.8 91.8 - - 91.8 91.8 91.8 91.8 91.8
Place p1 (HFrEF patients) 91.4 86.3 - - 91.0 91.4 88.4 91.4 91.4
Place p4 (all patients) 98.0 98.0 - 98.0 98.0 98.0 98.0 98.0 98.0
Place p4 (HFrEF patients) 98.6 98.6 - 98.6 98.6 98.6 98.6 98.6 98.6
best offset to the greatest distribution value. However,
given the unbalanced classes, the accuracy is still not
satisfying. As for determining reasons for COs, we
do not have enough information on all classes.
9 CONCLUSION
Our work aimed to analyze the reasons for COs
and death during the treatment pathway of a patient
with HF. In general, we applied process mining-based
methodology to patient data for HF in a real-world
setting. We transformed patient data into an event log.
Subsequently, we applied process-mining techniques
to the transformed event log. We discovered pro-
cess models and applied conformance-checking tech-
niques to the discovered model and a de-jure model.
We investigated differences between different patient
cohorts. Finally, we performed decision mining using
the transformed event log and the de-jure model.
However, the results have to be treated with cau-
tion. First, the number of patients included is limited.
The records that we analyzed were for 240 patients.
Thus, we analyzed 1000 events, i.e., roughly four
events per patient in roughly four years. Second, pa-
tients’ data are usually sparse, and the dataset we ana-
lyzed is no exception. Types of sparseness include the
temporal sparseness that was previously mentioned,
but there is also an absence of information for some
attributes. Third, patients’ data and their treatment are
highly complex. The data we analyzed only cover in-
formation recorded at the RWTH Aachen University
Hospital. Information about the treatments in other
hospitals is limited. Thus, only CV-related hospital-
izations from other hospitals are included.
This case study allows for open questions and di-
rections for future research in the context of health-
care. First, the used activities are generic. The data
consists of biomarkers, which can be used to generate
more meaningful activity names. Second, for some
visits, there exist textual reports. Using text-mining
techniques, information can be extracted from these
reports, enabling a more precise description of the
record. Third, as previously stated, the data consist
of a small number of patients, for which most either
do not die or do not have a CO. Increasing the num-
ber of patient records such that more of these kinds
of patients appear in the data can increase the qual-
ity of the classification algorithms and the forecasting
quality of these systems, leading to better treatment.
ACKNOWLEDGEMENTS
We thank the Alexander von Humboldt (AvH)
Stiftung for supporting our research. Dr. Sch
¨
utt is
supported by the Deutsche Forschungsgemeinschaft
(German Research Foundation; TRR 219; Project-
ID 322900939 [C07]); Prof. Marx is supported by
the Deutsche Forschungsgemeinschaft (German Re-
search Foundation; TRR 219; Project-ID 322900939
[M03, M05]). Funded under the Excellence Strategy
of the Federal Government and the L
¨
ander in support
of the “Computational Ecosystem for the Analysis
and Clinical Application of Multi-Organ Crosstalk”
(COAT) initiative of RWTH Aachen University.
REFERENCES
Adriansyah, A., Munoz-Gama, J., Carmona, J., et al.
(2015). Measuring precision of modeled behavior. Inf.
Syst. E Bus. Manag., 13(1):37–67.
Adriansyah, A., Sidorova, N., and van Dongen, B. F.
(2011). Cost-based fitness in conformance checking.
In Caillaud, B., Carmona, J., and Hiraishi, K., editors,
International Conference on Application of Concur-
rency to System Design, pages 57–66. IEEE Computer
Society.
Almeida, J. R., Freire, P., Fajarda, O., et al. (2020). A com-
putational platform for heart failure cases research. In
HEALTHINF, pages 601–608.
Artola, G., Larburu, N.,
´
Alvarez, R., et al. (2019). The im-
pact of environmental factors on heart failure decom-
pensations. In HEALTHINF, pages 51–58.
Back, C. O., Manataki, A., and Harrison, E. M. (2020).
Mining patient flow patterns in a surgical ward. In
HEALTHINF, pages 273–283. SCITEPRESS.
Benevento, E., Pegoraro, M., Antoniazzi, M., et al.
(2022). Process modeling and conformance checking
in healthcare: A COVID-19 case study - case study. In
HEALTHINF 2024 - 17th International Conference on Health Informatics
514

Process Mining Workshops - ICPM, pages 315–327.
Springer.
Bottrighi, A., Piovesan, L., Terenziani, P., et al. (2018). A
general framework for the distributed management of
exceptions and comorbidities. In HEALTHINF, pages
66–76.
Buijs, J. C. A. M., van Dongen, B. F., and van der Aalst,
W. M. P. (2014). Quality dimensions in process dis-
covery: The importance of fitness, precision, general-
ization and simplicity. Int. J. Cooperative Inf. Syst.,
23(1).
Carmona, J., van Dongen, B. F., Solti, A., et al. (2018). Con-
formance Checking - Relating Processes and Models.
Springer.
Chin, S. C., Zolfaghar, K., Roy, S. B., et al. (2014). Divide-
n-discover: Discretization based data exploration
framework for healthcare analytics. In HEALTHINF,
pages 329–333. SciTePress.
de Vries, G., Neira, R. A. Q., Geleijnse, G., et al. (2017).
Towards process mining of EMR data - case study for
sepsis management. In HEALTHINF, pages 585–593.
SciTePress.
Dunn, O. J. (1964). Multiple comparisons using rank sums.
Technometrics, 6(3):241–252.
Fisher, R. A. (1992). Statistical Methods for Research
Workers. Springer New York, New York, NY.
Guzzo, A., Rullo, A., and Vocaturo, E. (2022). Process min-
ing applications in the healthcare domain: A compre-
hensive review. WIREs Data Mining and Knowledge
Discovery, 12(2).
Kerexeta, J., Artetxe, A., Escolar, V., et al. (2018). Predict-
ing 30-day readmission in heart failure using machine
learning techniques. In HEALTHINF, pages 308–315.
Kruskal, W. H. and Wallis, W. A. (1952). Use of ranks in
one-criterion variance analysis. Journal of the Ameri-
can Statistical Association, 47(260):583–621.
Kusuma, G. P., Sykes, S., McInerney, C., et al. (2020). Pro-
cess mining of disease trajectories: A feasibility study.
In International Joint Conference on Biomedical En-
gineering Systems and Technologies: HEALTHINF,
pages 705–712. SCITEPRESS.
Levin, A., Stevens, P. E., Bilous, R. W., et al. (2013). Kid-
ney disease: Improving global outcomes (kdigo) ckd
work group. kdigo 2012 clinical practice guideline for
the evaluation and management of chronic kidney dis-
ease. Kidney international supplements, 3(1):1–150.
Mans, R., Schonenberg, H., Leonardi, G., et al. (2008). Pro-
cess mining techniques: an application to stroke care.
In MIE, pages 573–578. IOS Press.
Mans, R., van der Aalst, W. M. P., and Vanwersch, R.
J. B. (2015). Process Mining in Healthcare - Eval-
uating and Exploiting Operational Healthcare Pro-
cesses. Springer Briefs in Business Process Manage-
ment. Springer.
McDonagh, T. A., Metra, M., Adamo, M., et al. (2021).
2021 ESC guidelines for the diagnosis and treatment
of acute and chronic heart failure. European Heart
Journal, 42(36):3599–3726.
Munoz-Gama, J., Martin, N., Fern
´
andez-Llatas, C., et al.
(2022). Process mining for healthcare: Characteristics
and challenges. J. Biomed. Informatics, 127:103994.
Pegoraro, M., Narayana, M. B. S., Benevento, E., et al.
(2021). Analyzing medical data with process min-
ing: A COVID-19 case study. volume 444 of Lec-
ture Notes in Business Information Processing, pages
39–44. Springer.
Reisig, W. (1985). Petri Nets: An Introduction, volume 4
of EATCS Monographs on Theoretical Computer Sci-
ence. Springer.
Romero-Gonz
´
alez, G., Ravassa, S., Gonz
´
alez, O., et al.
(2020). Burden and challenges of heart failure in pa-
tients with chronic kidney disease. a call to action. Ne-
frolog
´
ıa, 40(3):223–236.
Roy, S. B. and Chin, S.-C. (2014). Prediction and manage-
ment of readmission risk for congestive heart failure.
In HEALTHINF, pages 523–528. SciTePress.
Sattar, N., Lee, M. M. Y., Kristensen, S. L., et al. (2021).
Cardiovascular, mortality, and kidney outcomes with
GLP-1 receptor agonists in patients with type 2 dia-
betes: a systematic review and meta-analysis of ran-
domised trials. The Lancet Diabetes & Endocrinol-
ogy, 9(10):653–662.
van der Aalst, W. M. P. (2016). Process Mining - Data
Science in Action, Second Edition. Springer.
Weerdt, J. D., Backer, M. D., Vanthienen, J., et al. (2010).
A critical evaluation study of model-log metrics in
process discovery. In Business Process Management
Workshops, pages 158–169. Springer.
Zelniker, T. A., Wiviott, S. D., Raz, I., et al. (2019). SGLT2
inhibitors for primary and secondary prevention of
cardiovascular and renal outcomes in type 2 diabetes:
a systematic review and meta-analysis of cardiovascu-
lar outcome trials. The Lancet, 393(10166):31–39.
Zweth, J., Askari, M., Spruit, M., et al. (2018). Devices
used for non-invasive tele homecare for cardiovascular
patients: A systematic literature review. In HEALTH-
INF, pages 300–307. SciTePress.
Process-Aware Analysis of Treatment Paths in Heart Failure Patients: A Case Study
515
