
Quantifying Topic Model Influence on Text Layouts
Based on Dimensionality Reductions
Daniel Atzberger
1 a
, Tim Cech
2 b
, Willy Scheibel
1 c
,
J
¨
urgen D
¨
ollner
1 d
, and Tobias Schreck
3 e
1
Hasso Plattner Institute, Digital Engineering Faculty, University of Potsdam, Germany
2
Digital Engineering Faculty, University of Potsdam, Germany
3
Graz University of Technology, Austria
Keywords:
Topic Modeling, Dimensionality Reductions, Text Spatializations.
Abstract:
Text spatializations for text corpora often rely on two-dimensional scatter plots generated from topic mod-
els and dimensionality reductions. Topic models are unsupervised learning algorithms that identify clusters,
so-called topics, within a corpus, representing the underlying concepts. Furthermore, topic models transform
documents into vectors, capturing their association with topics. A subsequent dimensionality reduction cre-
ates a two-dimensional scatter plot, illustrating semantic similarity between the documents. A recent study by
Atzberger et al. has shown that topic models are beneficial for generating two-dimensional layouts. However,
in their study, the hyperparameters of the topic models are fixed, and thus the study does not analyze the im-
pact of the topic models’ quality on the resulting layout. Following the methodology of Atzberger et al., we
present a comprehensive benchmark comprising (1) text corpora, (2) layout algorithms based on topic models
and dimensionality reductions, (3) quality metrics for assessing topic models, and (4) metrics for evaluating
two-dimensional layouts’ accuracy and cluster separation. Our study involves an exhaustive evaluation of
numerous parameter configurations, yielding a dataset that quantifies the quality of each dataset-layout algo-
rithm combination. Through a rigorous analysis of this dataset, we derive practical guidelines for effectively
employing topic models in text spatializations. As a main result, we conclude that the quality of a topic model
measured by coherence is positively correlated to the layout quality in the case of Latent Semantic Indexing
and Non-Negative Matrix Factorization.
1 INTRODUCTION
Topic Models (TMs) are a class of unsupervised
learning algorithms for analyzing the semantic struc-
ture of collections of documents, so-called text cor-
pora (Crain et al., 2012). By analyzing patterns of co-
occurring words within the documents, TMs extract
concepts – so-called topics – as clusters in the vocabu-
lary. Thereby, topics are given as vectors, whose com-
ponents express the relevance of the respective term
for the topic; in many cases, a human-interpretable
concept can be derived from the most relevant words
within a topic. Furthermore, TMs represent each doc-
ument as a vector that describes its semantic composi-
a
https://orcid.org/0000-0002-5409-7843
b
https://orcid.org/0000-0001-8688-2419
c
https://orcid.org/0000-0002-7885-9857
d
https://orcid.org/0000-0002-8981-8583
e
https://orcid.org/0000-0003-0778-8665
tion. Besides their wide use in the NLP domain, e.g.,
for text classification (Aggarwal and Zhai, 2012a),
text summarization (Nenkova and McKeown, 2012),
or text clustering (Aggarwal and Zhai, 2012b), TMs
are also used for the visualization of text corpora us-
ing a map-metaphor (Kucher and Kerren, 2019). The
underlying two-dimensional scatter plot, which deter-
mines the position for each document, originates from
applying a dimensionality reduction (DR).
The quality of the two-dimensional layout de-
pends on the choice of the TM, the DR, and the
respective hyperparameters. Existing works dealing
with the representation of high-dimensional data by
two-dimensional scatter plots usually do not consider
TMs (Espadoto et al., 2021; Vernier et al., 2020),
even though TMs are essential in many visualizations.
Contrasting this, Atzberger et al. (2023) showed in
their benchmark study, that applying a TM for text
corpora as a particular case of high dimensional data
Atzberger, D., Cech, T., Scheibel, W., Döllner, J. and Schreck, T.
Quantifying Topic Model Influence on Text Layouts Based on Dimensionality Reductions.
DOI: 10.5220/0012391100003660
Paper published under CC license (CC BY-NC-ND 4.0)
In Proceedings of the 19th International Joint Conference on Computer Vision, Imaging and Computer Graphics Theory and Applications (VISIGRAPP 2024) - Volume 1: GRAPP, HUCAPP
and IVAPP, pages 593-602
ISBN: 978-989-758-679-8; ISSN: 2184-4321
Proceedings Copyright © 2024 by SCITEPRESS – Science and Technology Publications, Lda.
593

can lead to higher quality layouts. However, in their
experiments, the hyperparameters of the TM are fixed
for each dataset. Therefore, the full potential of TMs
and the impact of their quality for text spatializations
remains unclear.
This paper presents an extension of the benchmark
proposed by Atzberger et al. (2023). The new bench-
mark is given by a quadruple B = (D, L, Q
T M
, Q
DR
)
containing (1) a set of text corpora D, (2) a set of lay-
out algorithms L that are combinations of TMs and
DRs, (3) a set of quality metrics Q
T M
that capture
quality aspects of TMs, and (4) a set of quality met-
rics Q
DR
that capture aspects related to the accuracy
and perception. By evaluating the benchmark on a
computational cluster, we generate two datasets: one
containing the quality scores of 35 topic models and
one containing the quality scores of more than 6000
different layouts. By analyzing the result datasets, we
investigate the impact of the quality of TMs on the
quality of the layout. Our analysis shows that a higher
quality score for TMs result in better layouts concern-
ing accuracy and perception in case of Latent Seman-
tic Indexing and Non-Negative Matrix Factorization.
The remaining part of this work is structured as
follows: we give an overview of the related work in
Section 2. Our benchmark is detailed in Section 3,
and implementation details are presented in Section 4.
The results are analyzed in Section Section 5 and
discussed in Section 6. We conclude this work and
present directions for future work in Section 7.
2 RELATED WORK
We cover three aspects that are related to our con-
siderations: (1) benchmark studies that evaluate the
accuracy of DRs, (2) benchmark studies that evaluate
the perception capabilities of DRs, and (3) approaches
for quantifying and exploring the quality of TMs.
Benchmarking Dimensionality Reductions for
Accuracy. Different benchmarks have been pro-
posed to derive guidelines for the effective use of DRs
for visualization tasks. Those benchmarks usually
comprise a set of datasets, DRs, and quality metrics
for quantifying the accuracy of DRs. Thereby, accu-
racy approximates how well high-dimensional struc-
tures, e.g., neighborhoods, are preserved in the lower-
dimensional representation (Behrisch et al., 2018).
The execution of a benchmark results in a dataset,
which is then the subject of further analysis, e.g.,
which DR shows the best results for a given dataset.
van der Maaten et al. (2009) were the first to apply
this methodology to compare non-linear DRs’ perfor-
mance with PCA. In a similar study, Gisbrecht and
Hammer (2015) focused on the performance of non-
linear DRs. Espadoto et al. (2021) introduced the first
large-scale study, comprising 18 datasets, 44 DRs,
and seven quality metrics for capturing the accuracy.
From the results, the authors deduced that t-SNE over-
all shows the best performance. In a similar study,
Vernier et al. (2020) analyzed the temporal stabil-
ity using customized quality metrics. Furthermore,
Vernier et al. (2021) developed two modifications of
t-SNE that show great results with respect to temporal
stability.
Even though these benchmarks contain text cor-
pora as datasets, TMs are not considered as part of
the layout algorithms. Atzberger et al. (2023) pre-
sented a benchmark containing five different text cor-
pora and 52 layout algorithms originating from com-
bining a TM and a subsequent DR. As a main result,
the authors show that applying a TM improves the
overall accuracy of the resulting layout. However, in
their benchmark, the hyperparameters of each TM are
fixed, and only the hyperparameters of the DRs are
varying. Although best practices were applied and
the results of the TMs were manually inspected, the
potential of TMs remains unclear.
Benchmarking Dimensionality Reductions for
Perception. Besides the accuracy, Atzberger et al.
also analyze the perception capabilities of the result-
ing scatter plots. Thereby perception refers to the ca-
pability of a user to perceive clusters as introduced
by Sedlmair et al. (2013).
The first benchmark that measures cluster separa-
tion metrics was proposed by Xia et al. (2023). Be-
sides a purely quantitative assessment, the authors
also performed a user study to compare DRs concern-
ing different cluster analysis tasks, e.g., cluster identi-
fication, as done in a previous work (Xia et al., 2022).
Morariu et al. (2023) investigated in a user study
whether quality metrics can describe the visual ap-
pearance of two-dimensional scatter plots. In a sim-
ilar approach, Xia et al. (2021) collected a human-
labeled dataset to train a neural network for model-
ing the human perception of visual clusters. A fur-
ther work that relies on human judgments was pre-
sented by Wang et al. (2018), who developed a DR
that aims at maximizing the perceived class separa-
tion. Our experiments follow the methodology pro-
posed by Atzberger et al., who solely relied on class
separation metrics and no human judgment.
Evaluating Topic Models. In most cases, TMs are
evaluated using quantitative measures, e.g., perplex-
ity or coherence measures (R
¨
oder et al., 2015). Al-
IVAPP 2024 - 15th International Conference on Information Visualization Theory and Applications
594

ternatively, topics can be judged according to their in-
terpretability by inspecting their most relevant words.
An example of a visualization work that analyzes the
quality of TMs that way is presented by Riehmann
et al. (2019). Furthermore, visualization tools have
been developed to support users in interpreting top-
ics and discovering relations between them. For ex-
ample, Sievert and Shirley (2014) presented LDAvis,
which consists of a bubble chart together with a bar
chart for exploring the topics of an LDA model. How-
ever, in most visualization papers that rely on TMs,
TMs are treated as a “black box”, without consider-
ing the results concerning quality measures or inter-
pretability.
3 BENCHMARK
Our benchmark B = (D, L, Q
T M
, Q
DR
) extends the
benchmark proposed by Atzberger et al. by quality
metrics for TMs. In the following we will present de-
tails on each of the four components.
Datasets. The set D contains four text corpora.
The 20 Newsgroup, Reuters, Seven Categories, and
Emails datasets are standard datasets from Kaggle
1
and widely used to evaluate NLP algorithms. The
GitHub Projects dataset that contains the source code
of 653 software projects on GitHub, where all source
code files have been merged into one document, pre-
sented by Atzberger et al., could not be included in
our benchmark, as the computation of the coherence
value for a TM would exceed the memory consump-
tion. Various preprocessing operations are performed
to remove words that do not have semantic mean-
ing. Besides generic steps, e.g., removing stop words,
dataset-specific actions are performed. After prepro-
cessing, the text corpora are available as a Document-
Term Matrix (DTM), i.e., the entry in cell (i, j) indi-
cates the absolute frequency of the j-th word in the
i-th document. Furthermore, each document is as-
signed to a unique category describing a higher-level
concept. Details on the processing and implementa-
tion of the datasets can be found in our repository
2
.
The characteristics of the four text corpora, contain-
ing the number of documents m, the size of the vo-
cabulary n, and the number of categories k, are sum-
marized in Table 1.
Layout Algorithms. In the DTM, each row de-
scribes a document, i.e., each document is represented
1
www.kaggle.com/
2
DOI: 10.5281/zenodo.10040858
Table 1: Characteristics for the four datasets in our bench-
mark containing the number of documents m, the size of the
vocabulary n and the number of categories k.
Dataset m n k
20 Newsgroup 11 314 6 672 20
Emails 9 111 6 992 4
Reuters 9 122 2 953 65
Seven Categories 3 127 11 373 7
as an n-dimensional vector containing the absolute
frequencies of the words in the document. Since the
semantic similarity between documents should be in-
dependent of their length, the similarity is measured
by the cosine similarity. This basic document compar-
ison model is called the Vector Space Model (VSM).
The VSM only considers the absolute frequency of a
term within a document and thus neglects the distri-
bution of the word across all documents. By weight-
ing the DTM according to the term frequency-inverse
document frequency (tf-idf) scheme, terms that oc-
cur in only a few documents, and are thus of par-
ticular relevance to a document, are given a higher
weight (Aggarwal and Zhai, 2012b). Specifically, the
tf-idf of a term w in document d is given by
tf-idf(w, d) =
n(w, d)
∑
d
′
∈C
n(w, d
′
)
· log
|C|
|{d
′
∈ C|w ∈ d
′
}|
!
,
(1)
where n(w, d) denotes the frequency of term w in
document d. Typically, only a few terms from the
vocabulary occur in a single document., the DTM
is thus sparse. The basic idea of TMs is to de-
tect clusters in the vocabulary that occur together
in documents (Crain et al., 2012). Latent Seman-
tic Indexing (LSI) is a TM that decomposes the
(mxn)-dimensional DTM as the product of an (mxK)-
dimensional document-topic matrix and a (Kxn)-
dimensional topic-term matrix by applying a Singu-
lar Value Decomposition (SVD) (Deerwester et al.,
1990). The number of topics K is a hyperparameter of
the model. Similarly, Non-Negative Matrix Factoriza-
tion (NMF) decomposes the DTM as a product of two
matrices (Lee and Seung, 1999). Both methods can be
applied to the tf-idf weighted DTM. The cosine simi-
larity captures the similarity between the documents.
Latent Dirichlet Allocation (LDA) is a probabilistic
TM that assumes a generative process underlying a
corpus (Blei et al., 2003). Each document is described
as a distribution over the topics, which are, in turn
given as distributions over the vocabulary. In addition
to K, LDA requires the specification of two Dirichlet
priors, α and β, which encode assumptions about the
document-topic distribution and topic-word distribu-
tion, respectively. Since the documents are described
Quantifying Topic Model Influence on Text Layouts Based on Dimensionality Reductions
595

as distributions, they are compared using the Jensen-
Shannon distance.
By applying a TM, each document is represented
as a K-dimensional vector describing the expression
in the topics. Thus, it requires a subsequent DR to
represent the corpus as a two-dimensional scatter plot.
Multidimensional Scaling (MDS) iteratively com-
putes the positioning of the documents, which should
represent the pairwise distances between the docu-
ments (Cox and Cox, 2008). t-distributed Stochastic
Neighbor Embedding (t-SNE) is considered the best-
known manifold learning algorithm and is known for
preserving local structures well (van der Maaten and
Hinton, 2008). Besides the specification of the learn-
ing rate and the number of iterations in the training al-
gorithm, it requires the specification of the perplexity,
which controls the trade-off between local and global
structures. Uniform Manifold Approximation and
Projection (UMAP) extends t-SNE to preserve global
structures (McInnes et al., 2020). UMAP requires the
specification of two hyperparameters, the number of
neighbors as a trade-off between preserving local and
global structures, and the minimal distance that con-
trols how close data points can be grouped together
in the two-dimensional layout. In any case, the DR
can also be applied to the topics, and the document
position aggregated according to its document repre-
sentation (Atzberger et al., 2021).
Quality Metrics for Topic Models. According to
R
¨
oder et al. (2015), “a set of statements or facts
is said to be coherent, if they support each other”,
i.e., they seem to belong to each other concerning
human interpretation. In the case of TMs, a state-
ment is given by the most relevant terms within a
topic. As human evaluations are expensive to pro-
duce, several coherence measures have been proposed
to quantify a TM’s quality concerning human inter-
pretability. R
¨
oder et al. (2015) developed a four-stage
pipeline that categorizes existing coherence measures
and allows their combination, i.e., a quadruple spec-
ifies each coherence measure. In the first stage, the
set of words is segregated into smaller pieces, e.g.,
word pairs. In the second stage, word probabilities
are computed using a reference corpus, e.g., by di-
viding the number of documents in which the word
occurs by the total number of documents. In the third
stage, a confirmation measure derives how strongly a
pair of words or subsets of words belong to each other
based on their probabilities, which results in a vector
description. Finally, the vector entries are aggregated
to a final coherence score in the fourth stage. Our
experiments evaluate the TMs using the pipeline C
V
.
The metric C
V
has shown the best results in the study
of R
¨
oder et al. (2015), which compares the coherence
scores for topics that have been rated by humans in
previous experiments (Aletras and Stevenson, 2013;
Chang et al., 2009; Lau et al., 2014).
Quality Metrics for Dimensionality Reductions.
To evaluate the effectiveness of DRs to preserve lo-
cal and global structures of a given input data set in a
two-dimensional scatter plot, different quality metrics
have been proposed and utilized in several benchmark
studies (Behrisch et al., 2018). In our study, we refer
to the metrics that have also been used by Atzberger
et al. (2023). The Trustworthiness α
T
measures for
each point in the 2D layout the percentage of points
among the seven nearest neighbors (NN) that also be-
long to the seven NN in the input space, averaged
over all points (Venna and Kaski, 2006). Vice versa,
the Continuity α
C
measures for each point in the in-
put space the percentage among the seven NN that are
also among the seven NN in the projected space, av-
eraged over all points (Venna and Kaski, 2006). The
7-Neighborhood hit α
NH
measures the percentage of
points with the same label among the seven NN, aver-
aged over all points (Paulovich and Minghim, 2006).
Our fourth metric is derived from the Shephard Di-
agram, a two-dimensional scatter plot that relates
the pairwise distances in the high-dimensional input
space to the Euclidean distances in the layout (Joia
et al., 2011). The Shephard Digram Correlation α
SDC
is given by the Spearman Rank Correlation of the
Shephard Diagram and thus captures the global struc-
ture.
Unlike Atzberger et al. (2023), we only rely on the
Distance Consistency β
DC
to measure perception, as it
reflects the idea of cluster separation better than com-
bined with other metrics and has furthermore shown
as most relevant in previous studies Sedlmair and Au-
petit (2015). It measures the percentage of points
whose category center, i.e., the average of all points in
that category, is also its nearest category center in the
input space (Sips et al., 2009). In an ideal scenario,
the clusters are well separated to support cluster per-
ception.
4 IMPLEMENTATION DETAILS
Our implementation is based on Python 3 and ac-
tively maintained libraries for topic modeling and
DR, as listed in Table 2. Our computations are
carried out on a computational cluster compris-
ing ten AMD x64 HPE XL225n Gen10 (2 AMD
EPYC 7742 processors, 512GiB RAM, and 64 cores)
and eleven AMD x64 Fujitsu RX2530 M5 (2 In-
IVAPP 2024 - 15th International Conference on Information Visualization Theory and Applications
596
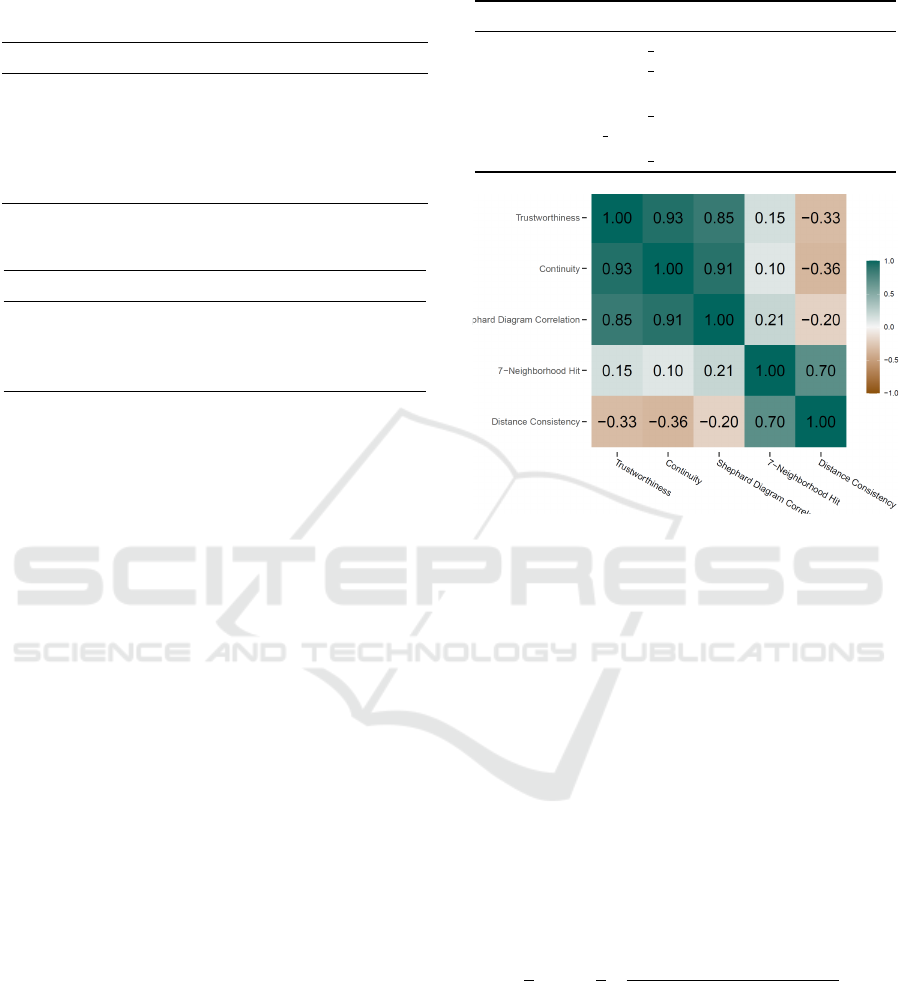
Table 2: Libraries used in our benchmark. Besides libraries
providing TMs and DRs, we also rely on libraries for text
preprocessing, e.g., the removal of stop words or lemmati-
zation.
Algorithm Library Version
LSI, NMF, LDA Gensim 4.2.0
Coherence Measures Gensim 4.2.0
t-SNE, MDS Scikit-Learn 1.2.1
UMAP UMAP-Learn 0.5.3
General Text Preprocessing NLTK 3.7
Lemmatization Spacy 3.4.3
Table 3: Number of topics for each dataset evaluated in our
experiments.
Dataset k K ∈ {a, b, c, d, e}
20 Newsgroup 20 20, 25, 30, 35, 40
Emails 4 8, 10, 12, 14, 16
Reuters 65 65, 82, 98, 114, 130
Seven Categories 7 14, 17, 21, 24, 28
tel Xeon Gold 5220S processors, 96 GiB RAM, and
32 cores). The cluster is managed using Simple
Linux Utility for Resource Management (SLURM).
For more details on our implementation, we refer to
our repository.
The most relevant hyperparameter of a TM is the
number of topics K, which depends on the dataset, as
summarized in Table 3. In the case of the Emails and
Seven Categories dataset, the number of categories k
is relatively low. We therefore set the lower bound
of K to 2k and its upper bound to 4k. In the case of
the 20 Newsgroups and Reuters dataset, in an ideal
scenario of K = k, each topic would represent one
category. We therefore set the lower bound to k and
the upper bound to 2k. LDA furthermore requires the
specification of its two Dirichlet priors α and β. We
let α vary over the values {symmetric, asymmetric,
auto} as specified by Gensim and set β constant as
suggested in the guidelines of Wallach et al. (2009).
We apply LSI and NMF on the DTM and its tf-idf
weighted variant. The value ranges for the hyperpa-
rameters for the DRs are specified in Table 4. By it-
erating over each combination of datasets, TM, and
DR in a grid search, we generate a dataset comprising
6346 layouts.
5 RESULTS
Evaluating our benchmark on a computational cluster
results in a dataset containing more than 6000 layouts.
For each entry, the accuracy and perception metrics
are stored together with the coherence value of the
underlying TM. We analyze the dataset in three steps:
Table 4: Range for the hyperparameters considered in our
experiments.
DR Parameter Name Values
t-SNE n iter 250, 1000, 4000
t-SNE learning rate 28, 129, 599
t-SNE perplexity 10–40 step size 10
UMAP min dist 0.25–0.75 step size 0.25
UMAP n neighbors 5, 10, 15, 20
MDS max iter 300
Figure 1: Heatmap showing the pairwise Pearson correla-
tions between the five layout quality metrics using a diverg-
ing color scheme.
(1) we investigate the correlation of different quality
metrics, (2) we investigate the impact factors on the
topic model coherence, and (3) we show whether the
coherence influences the quality of the resulting lay-
out.
5.1 Correlation Analysis
Figure 1 shows the pairwise Pearson correlation be-
tween the metrics in Q
DR
. The Trustworthiness α
T
,
Continuity α
C
, and Shephard Diagram Correlation
α
SDC
show a strong correlation but do not correlate
with the 7-Neighborhood hit α
NH
. To weight both
aspects of the accuracy equally, we define the aggre-
gated accuracy metric α as:
α =
1
2
α
NH
+
1
2
α
T
+ α
C
+ 0.5 · (α
SDC
+ 1)
3
!
, (2)
where 0.5 · (α
SDC
+ 1) has replaced α
SDC
to modify
the value range from [−1, 1] to [0, 1]. The Distance
Consistency β
DC
strongly correlates to α
NH
, whereby
both metrics are label-based. Since β
DC
is the only
perception metric we consider, we define
β = β
DC
. (3)
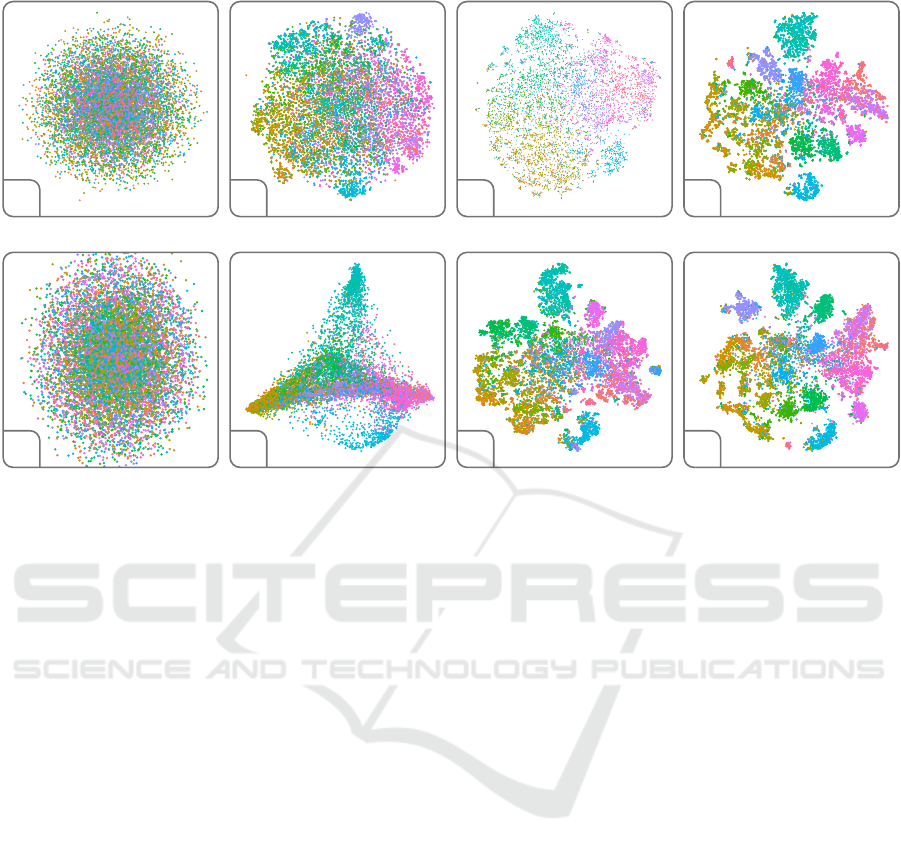
To illustrate α and β, Figure 2 shows four plots each
for the 20 Newsgroup dataset. The four coherence
Quantifying Topic Model Influence on Text Layouts Based on Dimensionality Reductions
597
Effect of overall accuracy
Effect of overall perception
(a) (b) (c) (d)
(e) (f) (g) (h)
Figure 2: Scatter plots for the 20 Newsgroup corpus. The color represents the category of each document. The first row
shows the effect of the overall accuracy ((a) α = 0.34, (b) α = 0.47, (c) α = 0.59, (d) α = 0.71); the second row illustrates
the distance consistency ((e) β = 0.05, (f) β = 0.22, (g) β = 0.40, (h) β = 0.56).
measures strongly correlate. However, instead of ag-
gregating them to a single metric, we solely rely on
the coherence measure C
V
as it has shown the best
results in the study of R
¨
oder et al. (2015).
5.2 Impact on Coherence
When applying TMs for NLP tasks, the concrete hy-
perparameter setting of the TM is often chosen based
on a coherence value, i.e., different hyperparameter
settings are evaluated, and the highest-scoring one is
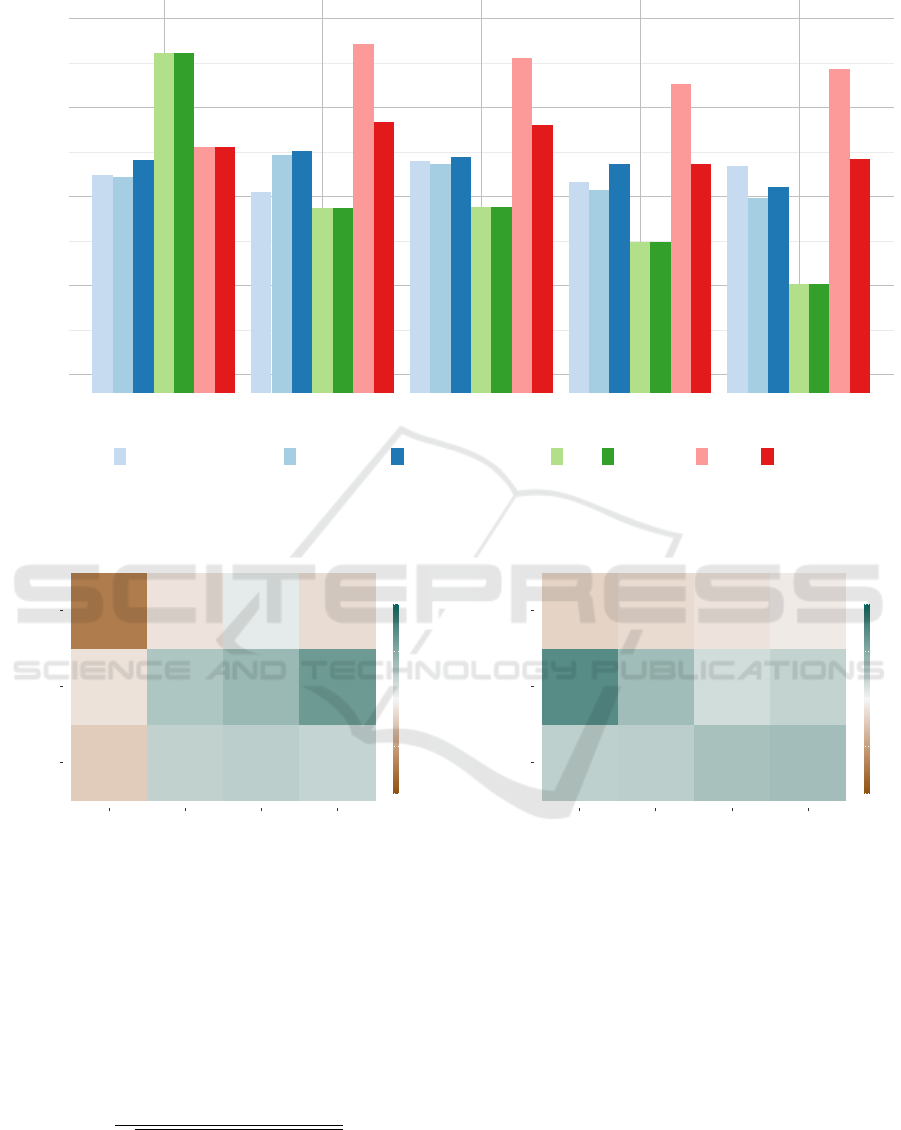
chosen. Figure 3 shows the quality of the TMs consid-
ered in our study in a bar chart. The height represents
the value C
V
of a TM for a specified number of topics
K ∈ {a, b, c, d, e} averaged over all four datasets. The
number of topics K ∈ {a, b, c, d, e}, where a < ··· < e
depends on the dataset, e.g, the value a is given by 20
in the case of 20 Newsgroup, 8 for the Emails dataset,
65 for the Reuters dataset, and 14 for the Seven Cate-
gories dataset.
For K ≥ b, both variants of NMF perform best,
followed by LDA and its versions and LSI performing
worst. Only the case K = a shows a different order.
For LSI and its tf-idf weighted variant, the coherence
strictly decreases with an increase of K. In the case
of NMF and its tf-idf weighted variant, the coherence
has a significant “jump” from K = a to K = b but then
seems stable over K. LDA shows no clear pattern but
stays within a small value range under variations of
K. For every K, the LDA model with a symmetric
prior α outperforms the version with the automati-
cally learned one, and except for K = e also the asym-
metric one.
To summarize, when applying NMF, the tf-idf
weighting does not improve the results; the best re-
sults are achieved for K = b. In the case of LSI and
LDA, it is recommended to set K = a. Even though
this does not significantly improve the coherence for
LDA, it speeds up the training. The observation that
K should be set to a also confirms the basic idea of a
coherence measure to reflect the interpretability of a
model, as we set K = a to be the number of categories
k (or in the particular case of very few categories 2k)
so that every topic could be linked to exactly one cat-
egory.
5.3 Impact of Coherence on Layout
Quality
We analyze the relationship between the coherence
and the accuracy metric α and perception metric β,
respectively; i.e., we explore whether the layout qual-
ity depends on the quality of the underlying TM.
Our analysis relies on Kendall’s tau, a correlation
measure for ordinal data (Noether, 1981). Different
from the Pearson correlation, Kendall’s tau is a non-
parametric measure that does not make assumptions
IVAPP 2024 - 15th International Conference on Information Visualization Theory and Applications
598
0.30
0.35
0.40
0.45
0.50
a b c d e
Number of Topics
Coherence
lda_asymmetric lda_auto lda_symmetric lsi lsi_tfidf nmf nmf_tfidf
Comparison of Topic Models concerning Coherence
Figure 3: Grouped bar chart for comparing the coherence values of the different TMs and their variants: The color indicates
the underlying TM and the saturation its variant. Note that the y-axis starts at 0.3 to support comparison.
−0.72 −0.10 0.07 −0.14
−0.24 0.24 0.26 0.22
−0.11 0.32 0.41 0.62
NMF
LSI
LDA
MDS
SOM
tSNE
UMAP
−1.0
−0.5
0.0
0.5
1.0
Kendall's tau concerning Accuracy
Figure 4: Kendall’s tau for the sequences x
T,P
and y
α
T,P
,
for three different TMs and four different DRs shown as a
heatmap with a diverging color scheme.
on the underlying distribution of the data. Given two
ordered sets x = (x
1
, ..., x
n
) and y = (y
1
, ..., y
n
), the
pairs (x
i
, y
i
) and (x
j
, y
j
) are said to be concordant if
x
i
> x
j
and y
i
> y
j
, and discordant otherwise. Let P
denote the number of concordant pairs, Q the number
of discordant pairs, T the number of ties in x, and U
the number of ties in y; Kendall’s tau is defined as
τ =
P − Q
p
(P + Q + T ) · (P + Q +U)
. (4)
Kendall’s tau ranges between [−1, 1], with 1 meaning
that the two sequences have the same rankings.
For a given TM T ∈ {LDA, LSI, NMF}, and
−0.19 −0.15 −0.10 −0.06
0.25 0.26 0.35 0.37
0.72 0.38 0.16 0.23
NMF
LSI
LDA
MDS
SOM
tSNE
UMAP
−1.0
−0.5
0.0
0.5
1.0
Kendall's tau concerning Perception
Figure 5: Kendall’s tau for the sequences x
T,P
and y
β
T,P
,
for three different TMs and four different DRs shown as a
heatmap with a diverging color scheme.
DR P ∈ {MDS, SOM, t-SNE, UMAP}, let x
T,P
=
(x
1
, . . . , x
n
) denote the sequence of coherence values
of fully parametrized TMs, which underly a layout
of a dataset that originates from applying T as TM
and P as DR. The length n is the number of eval-
uated hyperparameter combinations.Analogously, we
define y
α
T,P
= (y
α
1
, . . . , y
α
n
) as the sequence of accuracy
values α and y
β
T,P
= (y
β
1
, . . . , y
β
n
) as the sequence of
perception values β, where we assume the exact or-
dering as in the sequence x. The results of Kendall’s
tau capturing the relationship between coherence and
accuracy are shown in Figure 4, and the values of
Quantifying Topic Model Influence on Text Layouts Based on Dimensionality Reductions
599

Kendall’s tau capturing the relationship between co-
herence and perception are shown in Figure 5.
Concerning the accuracy α, LDA shows a very
high (|τ| < 0.7) negative to no (|τ| < 0.1) correlation
with any DR. However, as shown in Figure 3, the co-
herence for LDA models ranges within a very small
range, which is neglected by the measure tau. There-
fore, other changes to the model, e.g., the implemen-
tation or training method, could result in different ob-
servations. Concerning the perception β, LDA shows
a low (0.1 < |τ| < 0.3) negative to no correlation with
any DR.
The coherence of an LSI model in combination
with SOM, t-SNE, or UMAP shows a medium (0.3 ≤
|τ| ≤ 0.5) to a high (0.5 ≤ |τ| ≤ 0.7) positive corre-
lation with the accuracy. Concerning perception, we
observe a low (0.1 ≤ |τ| ≤ 0, 3) to a medium positive
correlation. Surprisingly, LSI combined with MDS
shows a very high correlation concerning β. How-
ever, as the results of Atzberger et al. (2023) showed,
MDS performs worse than t-SNE and UMAP, and we
therefore consider this observation as less relevant.
For NMF, the same basic pattern as for LSI is ob-
served, but attenuated in the expressions of τ. We
assume that this is because the coherence for topics
K ∈ {b, c, d, e} lies in a narrow range of values.
6 DISCUSSION
Based on our results, we formulate our main findings
and discuss the threats to validity that underlie our
argumentation.
Main Findings. Using Kendall’s tau, we showed
that the coherence of a TM is positively correlated
with the accuracy and perception of the resulting lay-
outs in the case of LSI and NMF in combination with
t-SNE, UMAP, and SOMs. MDS shows a different
pattern but is neglected, as the study of Atzberger
et al. (2023) has shown that MDS performs worse
than the others. For LDA, our experiments indicate
a negative correlation. However, we suspect that this
is because the coherence of the LDA models ranges
within a small value range. This conjecture is empha-
sized by the observation that NMF shows a weaker
correlation than LSI and also ranges in a smaller value
range. Combining our findings with Atzberger et al.’s
guidelines, we recommend using LSI in combination
with t-SNE such that the coherence of the LSI model
is maximized. In our experiments, LSI achieves its
maximal coherence for K = a, i.e., when the number
of topics matches the number of categories. This also
aligns with the idea of a coherence metric to measure
interpretability, as in the case K = k each topic can be
assigned to precisely one pre-defined category, which
allows the user to cross-check the model by inspect-
ing the topics.
Threats to Validity. Our major internal threat to va-
lidity lies in the design of our benchmark. For ex-
ample, by only evaluating four datasets, it is unclear
how transferable the results are for larger sets of text
corpora. Vice versa, it is still being determined to
what extent the results apply to specific datasets. Fur-
thermore, the results depend on the chosen quality
metrics, e.g., by selecting the distance consistency as
the only perception metric, we have not considered
other measures like the silhouette coefficient. Even
though we evaluated different parametrizations of the
layouts, other hyperparameters, e.g., the specific im-
plementation and training method, might lead to other
results. Also, the quality metrics have hyperparame-
ters that need to be set by the user, e.g., the number
of neighbors for the accuracy metrics. We consider
implementation errors as the main external threat to
validity. Even though we rely on actively maintained
and widely used libraries, reviewed code, and did pair
programming, we can not guarantee the absence of
errors. To make our work more accessible and trans-
parent and enable others to reproduce our results more
quickly, we make our implementation open source.
7 CONCLUSIONS
Many text spatializations rely on a two-dimensional
scatter plot, representing each document as a single
point. Usually, these layouts are derived from apply-
ing a TM and a subsequent DR. Previous benchmark
studies have shown that the generated layout of a text
corpus layout differs strongly between the different
DRs. Even though it is known that a TM can im-
prove the layout algorithm, it is still being determined
to what extent the quality of the TM affects the re-
sulting layout. To address this issue, we proposed a
benchmark (D, L, Q
T M
, Q
DR
) given as a quadruple of
a set of text corpora D, a set of layout algorithms L
that originate from combining a TM and a DR, a set
of coherence measures Q
T M
to evaluate the quality
of a TM, and a set of metrics Q
DR
that quantify the
accuracy and perception capabilities of a layout algo-
rithm. By evaluating more than 6000 hyperparameter
configurations, we derived a multivariate dataset for
further analysis. Our results indicate that coherence
is positively correlated to the accuracy metric α and
the perception metric β in the case of LSI and NMF,
in combination with t-SNE, UMAP, and SOMs. We
IVAPP 2024 - 15th International Conference on Information Visualization Theory and Applications
600

see different directions for future work. Primarily, we
plan to extend our benchmark to address our major
internal threat to validity by including more datasets
and layout algorithms. Besides accuracy and percep-
tion, other aspects of quality, e.g., temporal stability,
could be quantified and taken into account, too. Fur-
thermore, besides a quantitative study of text layout
algorithms, a qualitative approach, which categorizes
layouts according to their topological and geometrical
properties, would be interesting. We expect that such
a categorization would be beneficial for choosing DRs
for specific analytics tasks.
ACKNOWLEDGEMENTS
We thank the anonymous reviewers for their valuable
feedback. This work was partially funded by the Ger-
man Ministry for Education and Research (BMBF)
through grant 01IS22062 (“AI research group FFS-
AI”). The work of Tobias Schreck was partially
funded by the Austrian Research Promotion Agency
(FFG) within the framework of the flagship project
ICT of the Future PRESENT, grant FO999899544.
REFERENCES
Aggarwal, C. C. and Zhai, C. (2012a). A survey of text
classification algorithms. In Mining Text Data, pages
163–222. Springer.
Aggarwal, C. C. and Zhai, C. (2012b). A survey of text
clustering algorithms. In Mining Text Data, pages 77–
128. Springer.
Aletras, N. and Stevenson, M. (2013). Evaluating topic co-
herence using distributional semantics. In Proc. 10th
International Conference on Computational Seman-
tics, IWCS ’13, pages 13–22. ACL.
Atzberger, D., Cech, T., de la Haye, M., S
¨
ochting, M.,
Scheibel, W., Limberger, D., and D
¨
ollner, J. (2021).
Software Forest: A visualization of semantic similar-
ities in source code using a tree metaphor. In Proc.
16th International Conference on Information Visual-
ization Theory and Applications – Volume 3, IVAPP
’21, pages 112–122. INSTICC, SciTePress.
Atzberger, D., Cech, T., Scheibel, W., Trapp, M., Richter,
R., D
¨
ollner, J., and Schreck, T. (2023). Large-scale
evaluation of topic models and dimensionality reduc-
tion methods for 2d text spatialization. IEEE Trans-
actions on Visualization and Computer Graphics.
Behrisch, M., Blumenschein, M., Kim, N. W., Shao, L., El-
Assady, M., Fuchs, J., Seebacher, D., Diehl, A., Bran-
des, U., Pfister, H., Schreck, T., Weiskopf, D., and
Keim, D. A. (2018). Quality metrics for information
visualization. Wiley/EG Computer Graphics Forum,
37(3):625–662.
Blei, D. M., Ng, A. Y., and Jordan, M. I. (2003). Latent
Dirichlet allocation. Journal of Machine Learning Re-
search, 3:993–1022.
Chang, J., Gerrish, S., Wang, C., Boyd-Graber, J., and Blei,
D. (2009). Reading tea leaves: How humans interpret
topic models. Advances in Neural Information Pro-
cessing Systems, 22.
Cox, M. A. A. and Cox, T. F. (2008). Multidimensional
scaling. In Handbook of Data Visualization, pages
315–347. Springer.
Crain, S. P., Zhou, K., Yang, S.-H., and Zha, H. (2012).
Dimensionality reduction and topic modeling: From
latent semantic indexing to latent Dirichlet allocation
and beyond. In Mining Text Data, pages 129–161.
Springer.
Deerwester, S., Dumais, S. T., Furnas, G. W., Landauer,
T. K., and Harshman, R. (1990). Indexing by latent
semantic analysis. Journal of the American Society
for Information Science, 41(6):391–407.
Espadoto, M., Martins, R. M., Kerren, A., Hirata, N.
S. T., and Telea, A. C. (2021). Toward a quantita-
tive survey of dimension reduction techniques. IEEE
Transactions on Visualization and Computer Graph-
ics, 27(3):2153–2173.
Gisbrecht, A. and Hammer, B. (2015). Data visualization by
nonlinear dimensionality reduction. Wiley Data Min-
ing and Knowledge Discovery, 5(2):51–73.
Joia, P., Coimbra, D., Cuminato, J. A., Paulovich, F. V., and
Nonato, L. G. (2011). Local affine multidimensional
projection. IEEE Transactions on Visualization and
Computer Graphics, 17(12):2563–2571.
Kucher, K. and Kerren, A. (2019). Text visualization revis-
ited: The state of the field in 2019. In Proc. European
Conference on Visualization, EuroVis ’19, pages 29–
31. EG.
Lau, J. H., Newman, D., and Baldwin, T. (2014). Machine
reading tea leaves: Automatically evaluating topic co-
herence and topic model quality. In Proc. 14th Con-
ference of the European Chapter of the Association for
Computational Linguistics, pages 530–539. ACC.
Lee, D. D. and Seung, H. S. (1999). Learning the parts of
objects by non-negative matrix factorization. Springer
Nature, 401(6755):788–791.
McInnes, L., Healy, J., and Melville, J. (2020).
UMAP: Uniform manifold approximation and pro-
jection for dimension reduction. arXiv CoRR,
stat.ML(1802.03426):1–63. pre-print.
Morariu, C., Bibal, A., Cutura, R., Fr
´
enay, B., and Sedlmair,
M. (2023). Predicting user preferences of dimension-
ality reduction embedding quality. IEEE Transactions
on Visualization and Computer Graphics, 29(1):745–
755.
Nenkova, A. and McKeown, K. (2012). A survey of
text summarization techniques. In Mining Text Data,
pages 43–76. Springer.
Noether, G. E. (1981). Why Kendall tau? Wiley Teaching
Statistics, 3(2):41–43.
Paulovich, F. and Minghim, R. (2006). Text map explorer:
a tool to create and explore document maps. In Proc.
Quantifying Topic Model Influence on Text Layouts Based on Dimensionality Reductions
601

10th International Conference on Information Visual-
isation, IV ’06, pages 245–251. IEEE.
Riehmann, P., Kiesel, D., Kohlhaas, M., and Froehlich, B.
(2019). Visualizing a thinker’s life. IEEE Trans-
actions on Visualization and Computer Graphics,
25(4):1803–1816.
R
¨
oder, M., Both, A., and Hinneburg, A. (2015). Explor-
ing the space of topic coherence measures. In Proc.
8th International Conference on Web Search and Data
Mining, WSDM ’15, pages 399–408. ACM.
Sedlmair, M. and Aupetit, M. (2015). Data-driven evalua-
tion of visual quality measures. Wiley/EG Computer
Graphics Forum, 34(3):201–210.
Sedlmair, M., Munzner, T., and Tory, M. (2013). Empir-
ical guidance on scatterplot and dimension reduction
technique choices. IEEE Transactions on Visualiza-
tion and Computer Graphics, 19(12):2634–2643.
Sievert, C. and Shirley, K. (2014). LDAvis: A method for
visualizing and interpreting topics. In Proc. Workshop
on Interactive Language Learning, Visualization, and
Interfaces, pages 63–70. ACL.
Sips, M., Neubert, B., Lewis, J. P., and Hanrahan, P. (2009).
Selecting good views of high-dimensional data using
class consistency. Wiley/EG Computer Graphics Fo-
rum, 28(3):831–838.
van der Maaten, L. and Hinton, G. (2008). Visualizing data
using t-SNE. Journal of Machine Learning Research,
9(11):2579–2605.
van der Maaten, L., Postma, E., and van den Herik, J.
(2009). Dimensionality reduction: a comparative re-
view. Technical Report 009–005, Tilburg University,
Tilburg Centre for Creative Computing, The Nether-
lands.
Venna, J. and Kaski, S. (2006). Visualizing gene interaction
graphs with local multidimensional scaling. In Proc.
European Symposium on Artificial Neural Networks,
Computational Intelligence and Machine Learning,
ESANN ’06, pages 557–562. ESANN.
Vernier, E. F., Comba, J. L. D., and Telea, A. C. (2021).
Guided stable dynamic projections. In Wiley/EG Com-
puter Graphics Forum, volume 40(3), pages 87–98.
Vernier, E. F., Garcia, R., Silva, I. d., Comba, J. L. D., and
Telea, A. C. (2020). Quantitative evaluation of time-
dependent multidimensional projection techniques. In
Wiley/EG Computer Graphics Forum, volume 39(3),
pages 241–252.
Wallach, H. M., Mimno, D., and McCallum, A. K. (2009).
Rethinking LDA: Why priors matter. In Proc. 22nd
International Conference on Neural Information Pro-
cessing Systems, NIPS ’09, pages 1973–1981.
Wang, Y., Feng, K., Chu, X., Zhang, J., Fu, C.-W., Sedlmair,
M., Yu, X., and Chen, B. (2018). A perception-driven
approach to supervised dimensionality reduction for
visualization. IEEE Transactions on Visualization and
Computer Graphics, 24(5):1828–1840.
Xia, J., Huang, L., Lin, W., Zhao, X., Wu, J., Chen, Y.,
Zhao, Y., and Chen, W. (2023). Interactive visual
cluster analysis by contrastive dimensionality reduc-
tion. IEEE Transactions on Visualization and Com-
puter Graphics, 29(1):734–744.
Xia, J., Lin, W., Jiang, G., Wang, Y., Chen, W., and
Schreck, T. (2021). Visual clustering factors in scat-
terplots. IEEE Computer Graphics and Applications,
41(5):79–89.
Xia, J., Zhang, Y., Song, J., Chen, Y., Wang, Y., and
Liu, S. (2022). Revisiting dimensionality reduction
techniques for visual cluster analysis: An empirical
study. IEEE Transactions on Visualization and Com-
puter Graphics, 28(1):529–539.
IVAPP 2024 - 15th International Conference on Information Visualization Theory and Applications
602
