
Automated Brain Lobe Segmentation and Feature Extraction from
Multiple Sclerosis Lesions Using Deep Learning
Nada Haj Messaoud
1,2 a
, Rim Ayari
2b
Asma Ben Abdallah
2c
and Mohamed Hedi Bedoui
2d
1
Faculty of Sciences of Monastir (FSM), University of Monastir, Monastir, Tunisia
2
Medical Technology and Image Processing Laboratory, Faculty of medicine, University of Monastir, Monastir, Tunisia
Keywords: Brain Lobes Segmentation, Deep Learning, Multiple Sclerosis Lesion, U-Net, Features Extraction.
Abstract: This study focuses on automating the segmentation of brain lobes in MRI images of Multiple Sclerosis (MS)
lesions to extract crucial features for predicting disability levels. Extracting significant features from MRI
images of MS lesions is indeed a complex task due to the variability in lesion characteristics and the detailed
nature of MRI images. Furthermore, all these studies required continuous patient monitoring. Therefore, our
contribution lies in proposing an approach for the automatic segmentation of brain lobes and the extraction of
lesion features (number, size, location, etc.) to predict disability levels in MS patients. To achieve this, we
introduced a model inspired by U-Net to perform the segmentation of different brain lobes, aiming to
accurately locate the MS lesions. We utilized two private and public databases and achieved an average mean
IoU score of 0.70, which can be considered encouraging. Following the segmentation phase, approximately
7200 features were extracted from the MRI scans of MS patients.
1 INTRODUCTION
Multiple sclerosis (MS) is a demyelinating disease of
the central nervous system (CNS) characterized by
damage to the protective myelin surrounding the nerve
fibers within the brain and spinal cord. It primarily
affects young adults and leads to increasing disability
(Thompson, et al., 2018). Diagnosis is confirmed
through magnetic resonance imaging (MRI), with
varying contrast in cerebral MRI. MS lesions are
surrounded by edema, which appears as a
hyperintense signal on the T2 FLAIR image. These
lesions can appear in different areas of the brain. They
are characterized by their variability in terms of
volume, location, shape, subjects, and texture, leading
to symptoms that vary depending on where these
lesions are located. Consequently, the cerebral lobes
are also vulnerable to the impact of MS, as they
contain numerous nerve fibers and play a crucial role
in various brain functions. So, MS Lesion appears in:
• The temporal lobe can affect vision, touch,
memory, hearing, and language comprehension.
a
http://orcid.org/0000-0001-6243-1373
b
http://orcid.org/0000-0002-8292-7656
c
http://orcid.org/0000-0001-7821-7734
d
http://orcid.org/0000-0003-4846-1722
• The frontal lobe can lead to issues with
emotional control, cognitive functions, planning,
decision-making, as well as the supervision of
voluntary movements and activities.
• The parietal lobe can disrupt the processing of
information related to temperature, taste, touch, and
movement.
• The occipital lobe can lead to vision problems,
such as visual perception alterations, visual
disturbances, and even partial or total vision loss.
Thus, extracting meaningful features from brain
lesions to classify these anomalies based on cerebral
lobes can provide valuable insights into predicting
which human activities or tasks may be affected by
these abnormalities. Therefore, to extract these
features, a step of segmenting the different cerebral
lobes is required to facilitate the localization of brain
lesions. However, automatic brain region
segmentation is challenging due to variations of brain
size and shape from one individual to another, as well
as variations in the quality, size, and number of MRI
slices. Furthermore, cerebral lobe segmentation is
532
Haj Messaoud, N., Ayari, R., Ben Abdallah, A. and Bedoui, M.
Automated Brain Lobe Segmentation and Feature Extraction from Multiple Sclerosis Lesions Using Deep Learning.
DOI: 10.5220/0012390700003660
Paper published under CC license (CC BY-NC-ND 4.0)
In Proceedings of the 19th International Joint Conference on Computer Vision, Imaging and Computer Graphics Theory and Applications (VISIGRAPP 2024) - Volume 3: VISAPP, pages
532-540
ISBN: 978-989-758-679-8; ISSN: 2184-4321
Proceedings Copyright © 2024 by SCITEPRESS – Science and Technology Publications, Lda.

typically performed using 3D data, making the use of
2D slices with a reduced number of MRI slices, not
an easy task. Indeed, collecting data on multiple
sclerosis (MS) can be a challenging task, especially
when it involves both imaging and clinical data. To
meet our research needs and consider our medical
context, we utilized two separate databases: our own
database and the public database proposed by
(Almutairi, 2022). The characteristics of the two
databases are similar, that’s why we chose to combine
them to perform the segmentation task.
For the segmentation of brain regions, several
tools and methods based on machine learning (ML)
and Deep Learning (DL) have been proposed, each
having its own advantages and disadvantages. In this
research, our approach involves utilizing the U-Net
architecture to segment the distinct brain lobes. This
segmentation aims to facilitate the extraction of
features from MS lesions, pinpoint their locations,
and predict the disease's progression. The objective of
the study is the segmentation of these regions using
only 2D data with a limited number of slices.
The structure of this paper is as follows. Related
works are detailed in Section 2. Datasets are
explained in Section 3. The proposed workflow is
detailed in Section 4. Section 5 provides the results of
the method we proposed. Finally, Sections 6 closes
with a discussion, conclusion and main limitations of
this study.
2 RELATED WORKS
Accurate segmentation of MRI images becomes a
crucial task for Alzheimer's disease, dementia, partial
epilepsy, multiple sclerosis, etc. It has become an
important task for many evaluations in neurological
research, including the diagnosis, progression and
treatment of various neurological diseases such as
neurological diseases. Manual segmentation is
considered the gold standard in the field of
anatomical segmentation. Determining brain
structure is time-consuming and detailed because an
MRI can consist of hundreds of segments, depending
on the resolution of the MRI. Therefore, this labor-
intensive method is not suitable for large-scale
neuroimaging studies. Automatic segmentation
techniques attempt to resolve the limitations
associated with manual segmentation.
Following the advancement of algorithms and
computing resources several segmentation techniques
have been developed. These techniques include (a)
FreeSurfer, (b) FMRIB Software Library (FSL), and
(c) Statistical Parametric Mapping (SPM) (Singh,
2021)… Moreover, approaches that utilize
convolutional neural networks (CNN) are widely
employed for automatic segmentation tasks.
Table 1: State of the art of published works on the
segmentation of brain structures.
Authors Model Application Description
(Sken,
2016)
FCN
with a
late
fusion
method
Tissue
segmentation
FCNs for the
segmentation
of isointense
phase brain
MR images.
(Klein,
2018)
DeepNA
T
Anatomical
segmentation
3D Deep
convolutional
neural
network for
the automatic
segmentation
of
NeuroAnaTo
m
y
.
(Ayed,
2018)
3D CNN
Anatomical
segmentation
3D and fully
convolutional
neural
network
(CNN) for
subcortical
brain structure
segmentation
in MRI.
(Llado,
2019)
FCNN
Tissue
segmentation
Eight FCNN
architectures
inspired by
robust stateof-
the-art
methods on
brain
segmentation
related tasks.
(Tang,
2019)
U-net
Tissue
segmentation
Skip-
connection U-
net for WM
hyper
intensities
se
g
mentation.
(Gao,
2020)
Fuzzy C-
mean
Tissue
segmentation
Fuzzy C-
means
framework to
brain tissue
segmentation
The Table 1 summarizes the different automated
segmentation techniques mentioned in the literature.
FreeSurfer is an open-source software. Its focus is
on processing 3D images, including full volumetric
MR images. It is optimized for segmentation, 3D
brain reconstruction, and volumetric analysis from
Automated Brain Lobe Segmentation and Feature Extraction from Multiple Sclerosis Lesions Using Deep Learning
533

these types of images. FSL is a comprehensive library
of neuroimaging tools for structural, functional, and
diffusion tensor imaging (DTI) studies. It is capable
of handling a wide range of data and is known for its
robustness. SPM is a package developed for the
analysis of neuroimaging data coming from several
imaging modalities. It is capable of performing
complex and detailed statistical analyses, but requires
MATLAB platform, volBrain (Online Web Platform)
is a web-based pipeline for MRI brain volumetry. Its
system is primarily based on a multi-atlas, patch-
based segmentation method. Registration is necessary
to use this platform, but there is a limit on the number
of concurrent jobs that can be submitted. Although it
is user-friendly, it does not offer as much as more
advanced software, which results in limitations of
specific tasks. Although there are a variety of tools to
analyze functional and structural imaging, they are
not specifically designed for processing 2D data with
fewer slices. In addition to the segmentation tools
previously presented, there are several works
proposed for the segmentation of brain regions based
on deep learning. The Table 1 provides a summary of
some model. The majority of previous studies have
typically aimed to segment various brain tissues,
including white matter, gray matter, and
cerebrospinal fluid. However, our approach is
distinct. Our research focuses on the segmentation of
brain lobes, which allows for the precise localization
of MS lesions. By concentrating on this specific
region of the brain, we can thoroughly evaluate how
these lesions impact human cognitive and sensory
functions, offering a unique perspective on the
consequences of MS.
3 CONSIDERED DATASETS
Two datasets were used: our private MS database and
the public database proposed by (Almutairi,
2022),(https://data.mendeley.com/datasets/8bctsm8
jz7/1).
3.1 MS Private Dataset
We recruited 22 patients diagnosed with relapsing-
remitting multiple sclerosis (RR-MS) and obtained
informed consent from the Fattouma Bourguiba
University Hospital Ethics Committee. MRI T2-
FLAIR image sequences were acquired at the
Neurology Department of Fattouma Bourguiba
University Hospital in Monastir. Each patient had
multiple time-points, ranging from 2 to 4. The dataset
was generated using a Philips 1.5T machine (Ingenia,
Philips, medical systems, Best, the Netherlands)
equipped with a 20-channel phased-array coil for the
head, neck, and spine, located at the Fattouma
Bourguiba Hospital Medical Imaging Department.
The original images of MS patients varied in
dimensions from (352 × 352) to (512 × 512), with a
spatial resolution of (0.46 × 0.46) and a slice
thickness of 7 mm. Ground truths were meticulously
prepared and validated by our highly experienced
expert with 16 years of expertise (Figure 2). Among
these 22 patients, clinical data is accessible for 19 of
them. Demographic and lesion characteristics are
detailed in Table 2 and Table 3.
Table 2: Baseline characteristics of MRI Image (Private
dataset).
Baseline characteristics (MRI Ima
g
e)
Sex ratio
(
male : female
)
0,46 [7:15]
Modalit
y
T2- FLAIR
Image Size 256×256
Number of original images 370
Number of groundtruth 370
Total number of lesions
(SD) [min : max]
1716 ± 3.98 [1:26]
Surface area of lesion (mm
2
)
[min : max]
(
SD
)
[4.0, 859.0] ± 93.63
Table 3: Baseline characteristics of Clinical Data (Private
dataset).
Baseline characteristics (Clinical Data)
Sex ratio
(
male : female
)
0,35 [5:14]
Current age (years) [min :
max]
35 ± 9.2 [20 : 50]
A
g
e of onset 8,05 ± 3,48 [3 : 16]
EDSS [min : max] 3,10 ± 2,35 [1 : 8]
Types of Medicines [1,2,3,4]
Co-moroidity (No/Yes) (16/3)
3.2 MS Public Dataset
Offered by (Almutairi, 2022) in 2022, this dataset
constitutes a valuable resource in the field of multiple
sclerosis (MS) (see Table 4 and Table 5). It comprises
multi-sequence MRI (1.5 Tesla) data from 60 patients
diagnosed with MS, accompanied by a consensus-
based manual segmentation of lesions, assessments of
disability levels using the Expanded Disability Status
Scale (EDSS), general patient information, and
relevant clinical data. One of the dataset's standout
features is the quality of its manual lesion
segmentation. Two expert radiologists and a
neurologist, ensuring a high level of accuracy and
reliability, performed this segmentation. It covers
three crucial MRI sequences: T1-weighted, T2-
VISAPP 2024 - 19th International Conference on Computer Vision Theory and Applications
534

weighted, and FLAIR (fluid-attenuated inversion
recovery), enabling in-depth analysis of lesion
characteristics in various contexts.
Table 4: Baseline characteristics of MRI Image (Prublic
dataset).
Baseline characteristics (MRI Images)
Modalities T1/T2/T2-
FLAIR
Number of OI
5
FLAIR 1446
Number of GT
6
(FLAIR) with at
least one lesion
794
Number of OI
(
T2
)
1385
Number of GT
6
(T2) with at least
one lesion
644
Number of OI (T1) 1358
Table 5: Baseline characteristics of Clinical Data (Public
dataset).
Baseline characteristics (Clinical Data)
Sex ratio (male : female) 0,30 [14:46]
Current age (years) [min :
max]
34 ± 12,1 [15 : 56]
A
g
e of onset 29,7 [8 : 52]
EDSS [min : max] 2,26 ± 1,5 [0 : 6]
Types of Medicines [1,2,3,4,5]
Co-moroidity (No/Yes) (47/13)
4 PROPOSED WORKFLOW
Our proposed pipline is composed of six steps (Figure
1): (i) Pre-processing to refine images and facilitate
brain lobes segmentation, (ii) Clinical data
preprocessing to ensure their compatibility with AI
algorithms, achieving greater consistency. (iii) Brain
lobes Segmentation based on DL architecture, (iv)
Automated feature extraction for capturing
significant characteristics including lesion Number,
lesion size, localization, and lobe area... (v) Creating
a file that combines both MRI features and clinical
data to identify the most correlated features to the MS
patients' disability levels and (vi) EDSS Prediction.
Each of these steps will be presented in the following
section.
4.1 Pre-Processing
In this phase, we applied preprocessing operations to
both the image data and clinical data as follows:
5
Original Image (OI)
6
Groundtruth (GT)
Preprocessing of Image Data
• Skull Stripping: We isolated the region of
interest by extracting it from extracranial and
non-cerebral tissues.
• Background Reduction: The black background
was minimized through cropping operations
• Image Resizing: All MRI images were resized
to (256× 256) in order to standardize the
database.
Preprocessing of Clinical Data
• Z-Score Normalization: We used the Z-Score
method to normalize variables such as age and age
of onset. The new value is calculated using the
formula (x - μ) / σ, where x represents the original
value, μ is the mean of the data, and σ is the
standard deviation of the data.
• Encoding: We applied encoding to variables such
as gender, comorbidities, presenting symptoms,
and type of medicines.
4.2 Brain Lobes Segmentation
Automatically segmenting brain lobes presents a
complex set of challenges due to the inherent
variability in brain shapes, sizes, and abnormalities,
as well as the diverse qualities and sizes of brain MRI
scans. Traditional methods rely on 3D MRI data,
making segmentation with 2D scans particularly
complex (Singh, 2021).
Multiclass segmentation is an advanced computer
vision task that extends beyond binary segmentation.
It categorizes every pixel in an image into distinct
classes, allowing for the differentiation of various
anatomical structures in medical imaging within an
MRI scan, such as the brain, heart, and lungs. For our
initial work, we chose to utilize the U-Net
(Ronneberger, Fischer, & Brox, 2015) architecture, as
it continues to be a reference in the field of medical
image segmentation (Liang, 2018) (Wen, 2019). This
choice was based on its proven effectiveness and
reliability in accurately segmenting medical images.
It features an encoding and decoding path, which
progressively reduces and increases spatial
resolution. U-Net can simultaneously segment
multiple classes in a single pass, with each class
corresponding to a specific object or region. This
capability is crucial for tasks like semantic
segmentation, where precise classification of
different categories within an image is essential.
Automated Brain Lobe Segmentation and Feature Extraction from Multiple Sclerosis Lesions Using Deep Learning
535
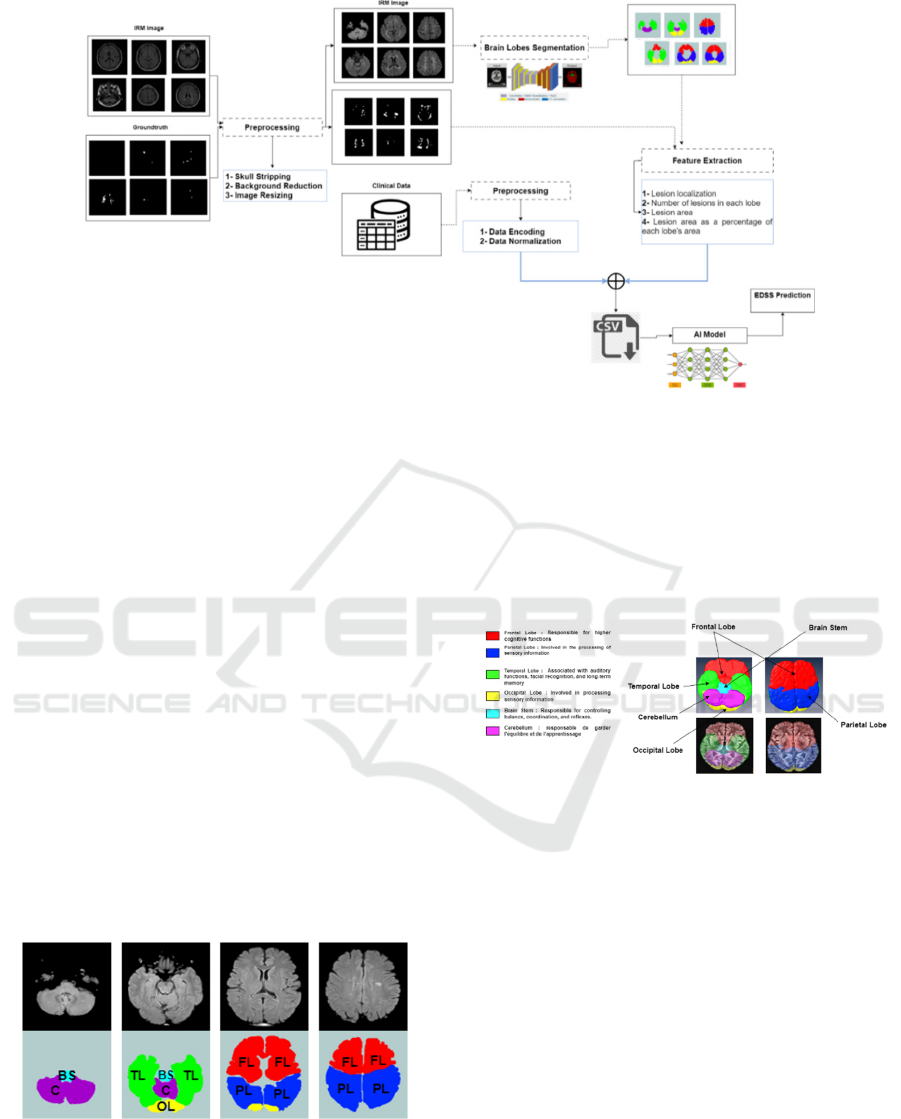
Figure 1: Workflow proposed for Brain Lobes Segmentation and MS lesions features extraction.
U-Net's skip connections maintain spatial
information, ensuring accurate segmentation.
Consequently, it is a fundamental tool in medical
image analysis. To achieve this, we began by
preparing the ground truth data for each cerebral lobe
in collaboration with our expert. We then proceeded
to implement the U-Net model. In total, we had seven
classes to segment, which included the Frontal Lobe
(FL), Occipital Lobe (OL), Parietal Lobe (PL),
Temporal Lobe (TL), Brain Stem (BS), Cerebellum
(C), and the background (B). Figure 2 provides an
example of the prepared ground truth data. Figure 3
depicts the functioning of each cerebral lobe,
highlighting the specific regions and functions of
each lobe. This illustration aids in gaining a better
understanding of how different parts of the brain
interact to control various aspects of cognition,
perception, and movement. It serves as a valuable
resource for studying MS as it helps us comprehend
the potential impacts of lesions on different brain
functions.
Figure 2: Example of Brain Lobe groundtruth.
U-Net wass proposed by (Ronneberger et al. 2015) in
2015 for biomedical image segmentation. It consisted
of a contraction path (downsampling) associated with
an expansion path (upsampling). It was proposed to
overcome the major limitation of the traditional CNN,
which is a compromise between location accuracy,
represented by low-level features, and contextual
information, provided by higher-level features.
During the contraction path, spatial information is
reduced while feature information is increased.
Figure 3: Illustration of the functioning of each cerebral
lobe.
However, during expansion, upsampling is
performed through the transposed convolutions to
build the segmented image. It is characterised by skip
connections (concatenation) between these two paths
for more accurate retrieval of spatial information. We
operated two modifications : (i) Batch Normalisation
to speed up learning and produce accurate models. (ii)
Dropout between the two consecutive convolutional
layers to avoid overfitting (Ronneberger, Fischer, &
Brox, 2015). Table 6 sums up the hyper-parameters
of convolution and deconvolution layers used in this
model. The following notations are used: BN stands
for Batch Normalisation and ReLu stands for
Rectified Linear Unit.
For the implementation of U-
Net model, Table 5 sums up the hyper-parameters of
convolution and deconvolution layers used in this
model.
VISAPP 2024 - 19th International Conference on Computer Vision Theory and Applications
536
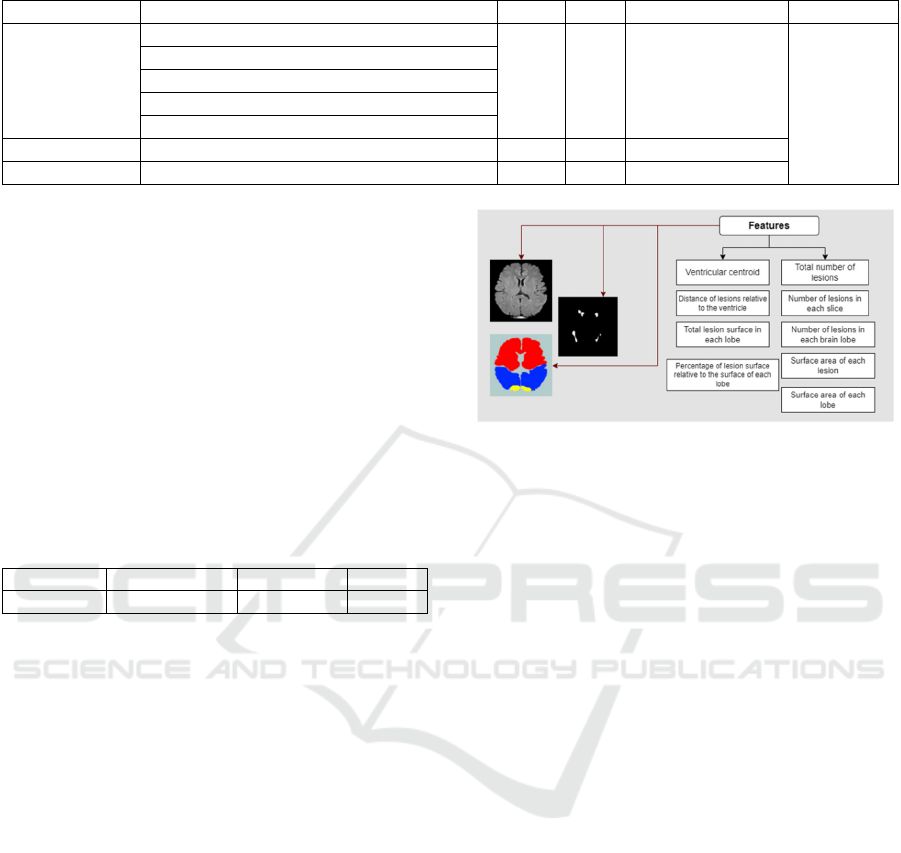
Table 6: U-Net structure details for the two paths.
Type Taille/Nombre of filters Padding Stride kernel_initializer Parameters
Convolution
((3 × 3 × 16) + BN +ReLu) ×2 + Dropout (0.1)
1
1
he_normal
1,946,807
((3 × 3 × 32) + BN +ReLu) ×2 + Dropout (0.1)
((3 × 3 × 64) + BN +ReLu) ×2 + Dropout (0.1)
((3 × 3 × 128) + BN +ReLu) ×2 + Dropout (0.1)
((3 × 3 × 256) + BN +ReLu) ×2 + Dropout (0.1)
MaxPooling (2x2)
Conv2DTranspose (2x2) 2
4.3 Implementation Details
The training phase requires establishing a set of
parameters such as the optimiser, learning rate,
number of epochs, and batch size . . . These are
usually experimentally selected or based on recent
studies with the aim of producing precise
segmentation performance. The implementation is
conducted onIntel Core i9-11900F @ 2.50 GHz,
32Go RAM and a Nvidia GeForce RTX 3090. The
suggested models were implemented in Python
language using Keras with Tensorflow backend.
Table 7 summarizes the hyperparameters used.
Table 7: hyper parameter used in the training step.
Optimizer Learning rate Batch_Size Epochs
ADAM 0.001 16 200
As metrics, we used accuracy, recall, and dice to
evaluate the model during training.
𝐴𝑐𝑐𝑢𝑟𝑎𝑐𝑦 𝑇𝑁 𝑇𝑃/𝑇𝑃 𝐹𝑃 𝑇𝑁 𝐹𝑁 (1)
𝐷𝑖𝑐𝑒 2 𝑇𝑃/2𝑇𝑃 𝐹𝑃 𝐹𝑁
(2)
𝑅𝑒𝑐𝑎𝑙𝑙 𝑇𝑃/𝑇𝑃 𝐹𝑁
(3)
4.4 Feature Extraction Process
McDonalds is considered standard diagnostic criteria
for multiple sclerosis (MS) based on clinical,
radiological and other medical data. These criteria
allow doctors to confirm the diagnosis based on
several pieces of evidence such as the patient's
symptoms, the results of magnetic resonance imaging
(MRI) examinations and other tests. They are used to
standardize the diagnostic process and to guarantee
consistency. Consistent with these criteria
(Skripuletz, 2019), we extracted FLAIR MRI features
and specific disease characteristics based on feature
types, including lesion location, shape, size, number,
and density (Figure 4). To do this, a graphical
interface has been developed.
Figure 4: Example of Features extracted from MRI Images.
The main goal of this interface is to make the feature
extraction process more accessible to non-technical
users or experts in a particular field. This helps speed
up the data analysis process, especially when dealing
with large amounts of information or complex data.
The proposed extraction steps are as follows:
• Measure the centroid of the ventricle to identify
lesions located near the cerebral ventricular
system.
• Load the brain lobes and calculate the area of each
lobe.
• Segment MS lesions and calculate the area,
location and number of each lesion.
• Create a file containing all the features extracted
from FLAIR MRIs.
• Integrate clinical data with imaging data to
facilitate predictive modeling, ultimately
identifying features with the strongest correlations
with disability progression.
Figure 5 presents a visual representation of the
process we proposed. It allows you to better
understand how our methodology works.
For the MS lesion segmentation phase we used
our own "Concat-U-Net" method published in
(Messaoud, 2022) which makes it possible to segment
objects of variable size, location and number such is
the case of lesions.
Automated Brain Lobe Segmentation and Feature Extraction from Multiple Sclerosis Lesions Using Deep Learning
537
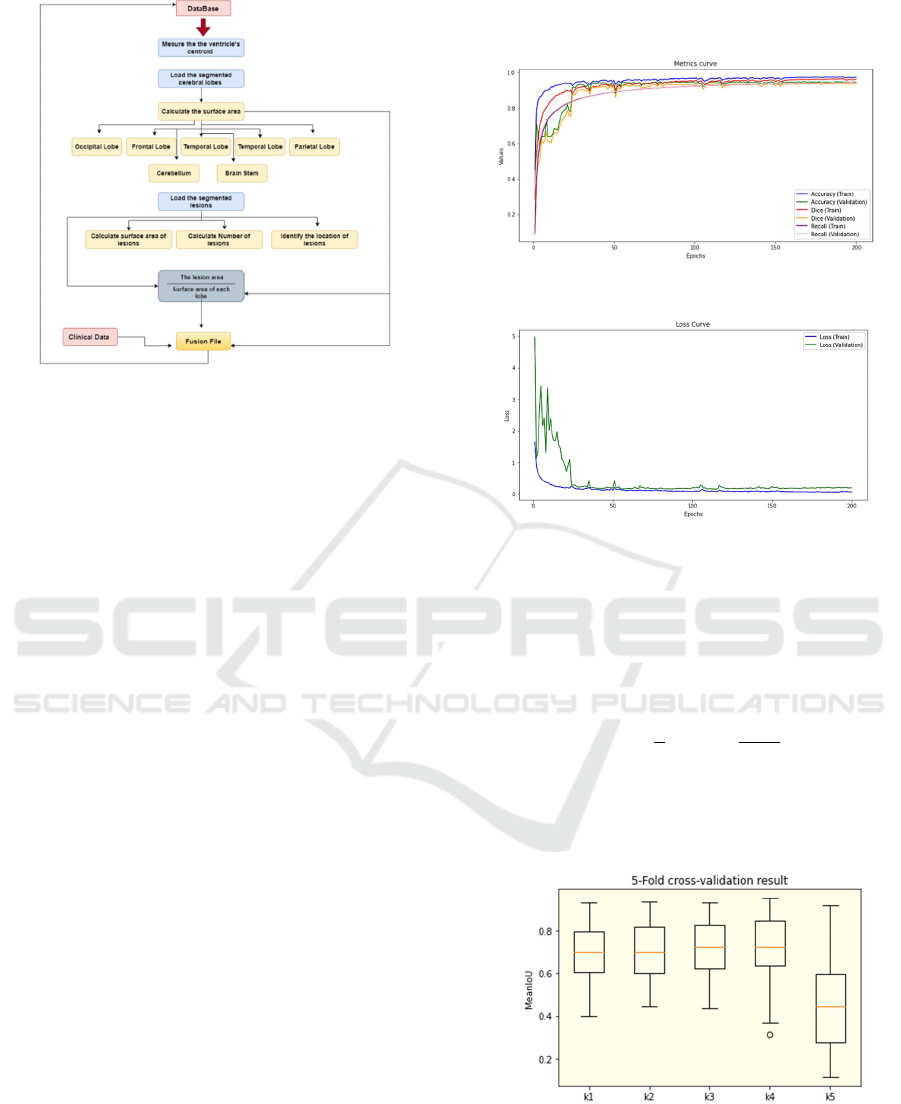
Figure 5: Workflow proposed for the MS lesion features
extraction.
5 RESULTS OF BRAIN LOBE
SEGMENTATION
In total, we prepared the ground truths of 32 patients.
We implemented a nested 5-fold cross-validation
over the whole datasets. The training curves of the U-
Net model are presented in Figure 6 and Figure 7. The
letters S stand for Subject, and the numbers represent
the subject identifier. (– denotes the subjects from 1
to N). Using the previously presented 5-Fold cross-
validation scheme, we have successfully applied
Deep learning to segment the cerebral lobes, even
with a limited number of slices for each patient. This
approach has significantly improved our ability to
accurately locate multiple sclerosis (MS) lesions and
estimate their size.
In the works of (Almutairi, 2022), the approach
involved segmenting the various brain lobes through
a series of steps. These steps included dividing the
brain into four subregions, measuring the center,
width, and height of each region, and subsequently
segmenting each subregion into four additional
sections, each of which was labeled accordingly.
However, in our case, we utilized a U-Net-inspired
architecture to calculate the surface of each cerebral
lobe, enabling us to extract the percentage of lesion
involvement in the brain lobes. This information
could serve as a significant biomarker for multiple
sclerosis diagnostic analysis.
Figure 6: Accuracy, Recall, Dice curves.
Figure 7: Training loss and Validation Loss curves.
To evaluate the obtained result, we used the Mean
Intersection over Union (MeanIoU) is a metric used
to assess the accuracy of image segmentation models.
It calculates the intersection over the union for each
class and then computes the average across all classes.
The formula for calculating MeanIoU is as follows:
MeanIoU
∑
∩
∪
(4)
The boxplots presented in Figure 8 depict the
results for each testing level. As an average result, we
achieved a mean IoU (Intersection over Union) score
of 0.70, which can be deemed highly encouraging.
Figure 8: Boxplots showing the performance of tested
model with all results obtained.
VISAPP 2024 - 19th International Conference on Computer Vision Theory and Applications
538
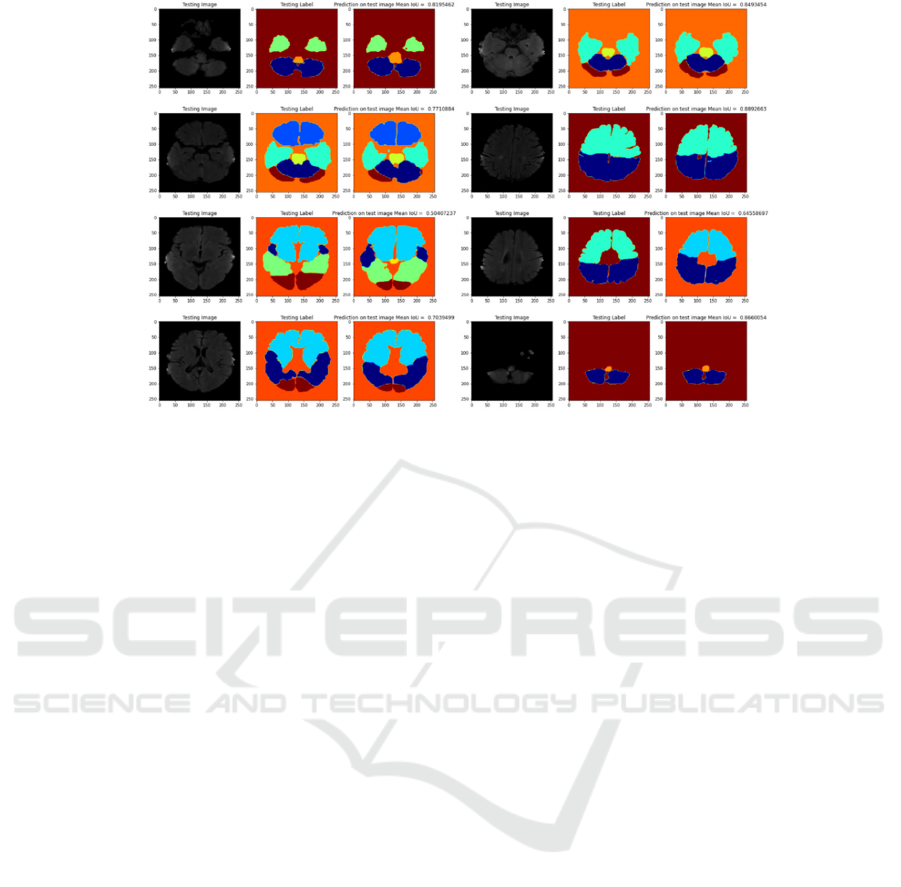
Figure 9: Example of Output segmentation results.
This high score indicates a strong match between the
model's predictions and the ground truths,
underscoring the effectiveness of our cerebral lobe
segmentation approach for assessing multiple
sclerosis lesions. This can be readily appreciated in
Figure 9, which is also reflected in the measured
MeanIoU value of the implemented U-Net. After
performing the segmentation of brain regions, we
followed the workflow presented in Figure 5 to
extract features from MS lesions. These features were
then integrated with clinical and demographic data to
study the correlation between the features and their
impact on the progression of this pathology. In total,
we extracted +7200 features. The calculation of these
features was performed using the following formula:
Total number of features = (Number of features per
slice) x (Number of slices per patient) x (Number of
patients). The proposed works is published in
https://github.com/nadandan/MRI-Brain-Region-Seg
mentation
6 DISCUSSION AND
CONCLUSION
The key contribution of this study is the segmentation
of brain lobe regions using only 2D data with a
limited number of slices and proposing an automated
approach to extract features from MS lesions and
combine them with patients' clinical and
demographic data. As our initial step, we selected the
U-Net architecture, which has demonstrated superior
performance in medical image segmentation. We
developed a U-Net-inspired model for the
segmentation of seven classes: the Frontal Lobe (FL),
Occipital Lobe (OL), Parietal Lobe (PL), Temporal
Lobe (TL), Brain Stem (BS), Cerebellum (C), and the
background (B). This was accomplished using 2D
data with a reduced number of slices for each patient.
On average, we achieved a highly encouraging mean
Intersection over Union (IoU) score of 0.70. Our
focus lies in examining the surface, localization, and
the number of lesions. Consequently, we successfully
extracted approximately 7200 features. In our future
work, we intend to utilize the generated feature file
(both clinical and image data) from our interface to
predict the disability level of MS patients. This
study's limitation lies in its exclusive use of the U-Net
architecture. It is essential for us to assess other
architectures for performance comparison and
possibly develop our unique model. Furthermore,
expanding the dataset with more images is crucial for
improving overall performance.
REFERENCES
Almutairi, A. M. (2022). Brain MRI dataset of multiple
sclerosis with consensus manual lesion segmentation
and patient meta information. Data in Brief.
Ayed, J. D. (2018). 3D fully convolutional networks for
subcortical segmentation in MRI: A large-scale study.
NeuroImage.
Gao, P. L. (2020). Temporally Consistent Segmentation of
Brain Tissue From Longitudinal {MR} Data. {IEEE}
Access.
Klein, C. W. (2018). DeepNAT: Deep convolutional neural
network for segmenting neuroanatomy. NeuroImage.
Automated Brain Lobe Segmentation and Feature Extraction from Multiple Sclerosis Lesions Using Deep Learning
539

Liang, Z. Z. (2018). Unet++: A nested u-net architecture
for medical image segmentation. Lecture Notes in
Computer Science (including subseries Lecture Notes
in Artificial Intelligence and Lecture Notes in
Bioinformatics).
Llado, J. B. (2019). Quantitative Analysis of Patch-Based
Fully Convolutional Neural Networks for Tissue
Segmentation on Brain Magnetic Resonance Imaging.
IEEE Access.
Messaoud, N. H. (2022). Automated segmentation of
multiple sclerosis lesions based on convolutional
neural networks. Computer Methods in Biomechanics
and Biomedical Engineering: Imaging and
Visualization.
Ronneberger, O., Fischer, P., & Brox, T. (2015). U-net:
Convolutional networks for biomedical image
segmentation. International Conference on Medical
image computing and computer-assisted intervention.
Singh, M. K. (2021). A Review of Publicly Available
Automatic Brain Segmentation Methodologies,
Machine Learning Models, Recent Advancements, and
Their Comparison. Annals of Neurosciences.
Sken, D. N. (2016). Fully convolutional networks for multi-
modality isointense infant brain image segmentation.
International Symposium on Biomedical Imaging.
Skripuletz, P. S.-W. (2019). Impact of the {McDonald}
Criteria 2017 on Early Diagnosis of Relapsing-
Remitting Multiple Sclerosis. Frontiers in Neurology.
Tang, J. W. (2019). Skip connection U-Net for white matter
hyperintensities segmentation from MRI. IEEE Access.
Thompson, A. (2018). Diagnosis of multiple sclerosis: 2017
revisions of the McDonald criteria. The Lancet
Neurology
Wen, F. C. (2019). An Improved Framework Called Du++
Applied to Brain Tumor Segmentation. 15th
International Computer Conference on Wavelet Active
Media Technology and Information Processing,
ICCWAMTIP 2018.
VISAPP 2024 - 19th International Conference on Computer Vision Theory and Applications
540
