
Robust Denoising and DenseNet Classification Framework for Plant
Disease Detection
Kevin Zhou
1
and Dimah Dera
2 a
1
Electrical and Computer Engineering, The University of Texas Rio Grande Valley, Brownsville, TX 78520 U.S.A.
2
Chester F. Carlson Center for Imaging Science, Rochester Institute of Technology, Rochester, NY 14623 U.S.A.
Keywords:
Plant Disease Detection, DenseNet Image Classification, Robust Machine Learning, Denoising Neural
Networks.
Abstract:
Plant disease is one of many obstacles encountered in the field of agriculture. Machine learning models have
been used to classify and detect diseases among plants by analyzing and extracting features from plant images.
However, a common problem for many models is that they are trained on clean laboratory images and do not
exemplify real conditions where noise can be present. In addition, the emergence of adversarial noise that can
mislead models into wrong predictions poses a severe challenge to developing preserved models against noisy
environments. In this paper, we propose an end-to-end robust plant disease detection framework that combines
a DenseNet-based classification with a vigorous deep learning denoising model. We validate a variety of deep
learning denoising models and adopt the Real Image Denoising network (RIDnet). The experiments have
shown that the proposed denoising classification framework for plant disease detection is more robust against
noisy or corrupted input images compared to a single classification model and can also successfully defend
against adversarial noises in images.
1 INTRODUCTION
Plants, such as citrus fruits, provide various health
benefits and are used in the production of various food
products, which make them vital to the economies of
many nations. Thus, it is essential to prevent signif-
icant losses in agricultural productivity to maintain a
stable economy. One of the biggest causes of loss to
plant production is plant diseases, which can render
crop outputs to be less suitable for consumption or us-
age. Detection of these plant diseases is crucial to pre-
vent significant losses in productivity (Li et al., 2020).
The earlier a disease is treated in crop fields, the less
damage it can cause. Removing diseased plants on as-
sembly lines would increase the quality of sold prod-
ucts.
Traditional image processing methods of plant
disease detection can be time-consuming, costly and
need field experts. Recently, machine learning (ML)
models have been used to detect and diagnose plant
diseases among certain crop species automatically
and accurately. In particular, deep convolution neu-
ral networks (DCNNs) have been used extensively to
a
https://orcid.org/0000-0002-7168-5858
identify and classify plant diseases (Nivethitha et al.,
2022; Lakshmanarao et al., 2021; Shaikh and Dhole,
2017). Many of these models developed different
techniques to improve the accuracy of plant disease
detection and classification from plant images. How-
ever, a common problem with most of the models in
the literature is that they do not fully exemplify real-
life conditions. In other words, most of the state-
of-the-art models have been trained on images pre-
pared in laboratories or clean settings. In particular,
recent models did not consider various sorts of noise
in images, which can be generated simply through el-
evated light levels, heat, or the resolution of the cam-
era sensors and can decrease the overall accuracy of
a model (Boyat and Joshi, 2015). In addition to nat-
ural noise, adversarial noise also presents a challenge
to obtaining a stable performance (Huq and Pervin,
2020). Adversarial noise is an imperceptible inten-
tionally crafted perturbation added to input images
and drives ML models to make incorrect predictions.
This type of smart noise can pose an obstacle to de-
ploying many ML-based models due to security con-
cerns and the lack of robustness.
Previous techniques to remove noise often in-
cluded filters such as median filters. However, many
166
Zhou, K. and Dera, D.
Robust Denoising and DenseNet Classification Framework for Plant Disease Detection.
DOI: 10.5220/0012390400003660
Paper published under CC license (CC BY-NC-ND 4.0)
In Proceedings of the 19th International Joint Conference on Computer Vision, Imaging and Computer Graphics Theory and Applications (VISIGRAPP 2024) - Volume 3: VISAPP, pages
166-174
ISBN: 978-989-758-679-8; ISSN: 2184-4321
Proceedings Copyright © 2024 by SCITEPRESS – Science and Technology Publications, Lda.

filtering techniques distort image quality after recon-
struction and often can not effectively remove adver-
sarial noise where noise levels can be very small. Re-
cently, deep learning models, including deep neural
networks (DNNs), have been applied to remove dis-
tortions and noise from images effectively.
In this paper, we propose a novel DenseNet-
based classification model to classify three differ-
ent citrus diseases on leaves and fruits. The pro-
posed DenseNet model is trained in two different
scenarios: (1) with noise injection image augmen-
tation and (2) without any form of image augmen-
tation. In our experiments, we adopt and evaluate
three state-of-the-art deep learning denoising mod-
els, i.e., Convolution Blind Denoising network (CBD-
net) (Guo et al., 2019), Real Image Denoising net-
work (RIDnet)(Anwar and Barnes, 2020), and Resid-
ual Encoder-Decoder network (REDnet) (Mao et al.,
2016). We train these three denoising models in two
different scenarios: (1) We train the models on cit-
rus images corrupted with Gaussian and salt and pep-
per noise. (2) We perturbed the citrus images with
two types of adversarial attacks (Fast Gradient Sign
Method (FGSM) (Goodfellow et al., 2015), and Pro-
jected Gradient Descent (PGD) (Madry et al., 2019)).
The three denoising models are then combined with
our DenseNet classification model, which makes the
model more robust and stable in predicting citrus dis-
eases. We summarize our contributions as follows:
• Developing a novel DenseNet-based model for
citrus disease classification with and without
noise injection image augmentation techniques.
• Training and validating three different denoising
models, i.e., CBDnet, RIDnet, and REDnet, with
Gaussian, salt and pepper, and adversarial noise.
Then, the denoising models are combined with the
proposed DenseNet classification model.
• Evaluating and analyzing the citrus disease
DenseNet classification models’ performance
against Gaussian, salt and pepper and adversarial
noise with and without combining the denoising
models. The experiments show that the denoising
models contribute to increasing the robustness of
the proposed DenseNet classification against var-
ious types of noise, especially FGSM and PGD
adversarial noise.
The paper is structured as follows. Section 2 is
the literature review. Section 3 explains the pro-
posed denoising-classification plant disease detection
framework. Section 4 presents experimental settings.
Section 5 shows the experiments and simulation re-
sults. Section 6 discusses and analyzes the experi-
mental results. Section 7 is the conclusion.
2 LITERATURE REVIEW
Shireesha et al. showed how a DenseNet121-
based CNN model with transfer learning techniques
achieved a 96% accuracy in detecting four different
citrus diseases (Shireesha and Reddy, 2022), indi-
cating the strengths of DenseNet for the classifica-
tion problem of citrus disease. Sharma et al. com-
bined a CNN network of three 224 × 224 convolu-
tion layers, three 112 × 112 convolution layers and
64 max-pooling layers with a long short-term mem-
ory (LSTM) network to classify citrus canker on
lemons based on the stage of the disease. The model
achieved an accuracy of 94.2% for the hybrid model
and 98.43% for the early level of lemons citrus canker
disease severity (Sharma and Kukreja, 2022). Li et al.
made a comprehensive summary of various popular
models and methods of detecting plant diseases, such
as VGG-16, inception v3, GoogleNet, and hyperspec-
tral imaging (Li et al., 2021).
While many of these models performed relatively
well in classifying their respective diseases, the accu-
racy of these models was achieved by training them
on clean images. To combat this problem, some
studies have combined image-cleaning methods to
remove noise from images before classification (Xu
et al., 2018). Huang et al. introduced an asymp-
tomatic non-local mean network (ANLM) and an ex-
treme learning machine (ELM), a learning algorithm
based on a single feed-forward hidden layer opti-
mized by linear particle swarm optimization (PSO).
The ANLM model was fused with a parallel CNN
(PCNN) utilizing exponential linear unit (ELU) to
form a new ML model. The ANLM network was
used to denoise images, while the hybrid ANLM-
PCNN was used to classify images that include five
types of peach diseases (Huang et al., 2020). How-
ever, the study focused on classifying peach diseases,
and there was no direct measure of how much of an
effect the denoising model had on the overall accu-
racy. Narmadha et al. proposed an image-processing
system that consisted of image acquisition, prepro-
cessing, feature extraction, and segmentation (Nar-
madha and Arulvadivu, 2017). During the segmen-
tation part, the K-means algorithm was used to both
denoise and enhance the images (Lloyd, 1982). Sim-
ilarly, Deepa utilized both the median filter and K-
means algorithm to clean and enhance images before
classification (Deepa, 2018). Using both techniques,
the quality of the image increased to 35% and allowed
for better performance of the classification model.
In the past few years, more advanced denoising
models based on deep learning have been proven to
excel at cleaning images with noise and perturbations
Robust Denoising and DenseNet Classification Framework for Plant Disease Detection
167

compared to traditional methods, such as non-local
means (NLM) and median filters (Limshuebchuey
et al., 2020). Zilvan et al. used a denoising convolu-
tional variational autoencoder to denoise images and
classify different plant diseases through unsupervised
learning. The model outperformed non-convolutional
denoising variational autoencoders; however, it was
only tested on salt and pepper noise (Zilvan et al.,
2019). Saeed et al. proposed REDNet as an autoen-
coder denoising model with convolutional layers and
skip connections. The model was able to achieve an
average peak-signal-to-noise ratio (PSNR) of 33.63
dB on the Berkely Segmentation Dataset (BSD) (Mar-
tin et al., 2001). However, deep learning convolution
models have shown to be better than autoencoders for
denoising. Guo et al. introduced CBDNet, which is
a convolutional denoising model with a noise estima-
tion sub-network. The model improved the average
PSNR to 38.06 dB on the Darmstadt noise dataset
(DnD) (Pl
¨
otz and Roth, 2017). Mao et al. pro-
posed RIDNet with a modular architecture and resid-
ual structure for feature attention that achieved a bet-
ter PSNR of 39.23 dB compared to CBDnet on the
DnD dataset.
3 PROPOSED METHODS
We propose a hybrid model that combines two deep
learning architectures, one for denoising and improv-
ing image quality and the second for disease detection
and image classification. The proposed model allows
the classification to operate against various unwanted
image noise, increasing the robustness of a disease
classification model. We evaluate three state-of-the-
art deep learning denoising CNNs, i.e., CBDNet,
REDNet, and RIDNet, through an extensive simula-
tion to demonstrate which denoising model brings the
most improvements to the proposed DenseNet deep
learning classification models for plant disease detec-
tion. The hybrid architecture demonstrates higher ro-
bustness and superior performance under noisy con-
ditions and adversarial attacks.
3.1 CNN-Based Image Denoising
The Convolution Blind Denoising network (CBDnet)
(Guo et al., 2019) consists of two sub-networks. The
first sub-network performs the noise estimation, and
the second sub-network is used for non-blind denois-
ing. The noise estimation sub-network creates an es-
timated noise map, which is used as an input to the
non-blind denoising sub-network to get the final de-
noising results. We use the mean squared error (MSE)
loss. Given that ˆy
i
is the noisy-corrupted image and y
i
is the ground truth, the loss is defined as follows:
Loss =
n
∑
i=1
(y
i
− ˆy
i
)
2
+ (λ ∗TV)), (1)
where λ is a hyperparameter and TV is the total vari-
ation regularize.
The Real Image Denoising network (RIDnet) (An-
war and Barnes, 2020) is an autoencoder-based de-
noising model with convolutional and deconvolu-
tional layers. The convolutional portion acts as a fea-
ture extractor, while the deconvolutional layers, with
the help of skip connections, are combined to recover
the image content details. In this study, we implement
the convolutional layers with zero padding to ensure
that the input and output feature maps have the same
dimension. The transposed convolutional layers with
zero padding are used for the deconvolutional layers.
The Residual Encoder-Decoder network (RED-
net) (Mao et al., 2016) consists of three major mod-
ules: feature extraction module, feature learning
residual module, and reconstruction module. The fea-
ture extraction module is composed of one convolu-
tional layer that extracts features of the original im-
age. The feature learning residual module contains
the enhancement attention modules (EAM) and lo-
cal and short skip connections to form the residual
structure. Similar to the feature extraction model,
the reconstruction module consists of one convolu-
tional layer that outputs the denoised image (Anwar
and Barnes, 2020).
3.2 DenseNet Classification
We develop a novel DenseNet classification model for
image classification and plant disease detection. The
model is trained in separate settings with and without
noise injection image augmentation techniques. The
proposed model is mainly composed of dense blocks
and transition layers. Every dense block comprises a
selected number of pairs of 1 ×1 and a 3 ×3 convo-
lution layers with the rectified linear unit (ReLU) ac-
tivation function and batch normalization associated
with every convolution layer. On the other hand, ev-
ery transition layer includes 1 ×1 convolution layer
with the ReLU activation function and batch normal-
ization and 2×2 average pooling layer. The proposed
model considers a small DenseNet architecture with
7 ×7 convolution layer, three dense blocks, and three
transition layers, with the dense blocks consisting of
4, 6, and 8 pairs. Thus, the proposed DenseNet archi-
tecture contains 41 convolution layers and one fully
connected layer (DenseNet-41). Figure 1 shows a
block diagram that explains the steps of plant image
VISAPP 2024 - 19th International Conference on Computer Vision Theory and Applications
168

classification and disease detection. Figure 2 shows
the DenseNet model architecture.
4 EXPERIMENTAL SETTINGS
4.1 Data Collection and Processing
In this paper, we assemble citrus plant images in var-
ious healthy and diseased conditions, species, and
environments manually using home plants and on-
line available plant images. We also use two pub-
licly available datasets, i.e., the PlantVillage dataset
(Hughes and Salath
´
e , 2015) and the Colombian citrus
fruits dataset (Torres, 2021). The total number of data
samples is 17, 306 citrus plant images. We apply mul-
tiple processing techniques, such as cropping, zoom-
ing, and many more. The collected images are based
on six classes: Black Spot, Canker, Citrus Greening
Leaves, Citrus Greening Fruits, Healthy Fruits, and
Healthy Leaves. Then, we divide the dataset into
training, validation, and test sets to train and validate
the learning and robustness of the proposed models
accurately. The evaluation criterion is set to have the
diseased portion of the tree or fruit being clearly visi-
ble to the human eye and being the center or focus of
the image. The manually collected images are sorted,
labeled and assigned manually to their corresponding
folder to generate training, validation and test sets of
citrus images. The images are split into three sets:
66% for the training set, 16.5% for the validation set,
and 17.5% for the test set.
4.2 Data Augmentation
We use image augmentation techniques to train the
denoising models (CBDnet, RIDnet, and REDnet) on
Gaussian and salt and pepper noise (using MATLAB).
For the purpose of data augmentation, the original im-
ages are perturbed with Gaussian noise and salt and
pepper noise. The salt and pepper noise corrupts 2%
of pixels within the images. The standard deviation of
the Gaussian noise is set to 0.1.
On the other side, we train the denoising models
on two types of adversarial examples using the Fast
Gradient Sign Method (FGSM) (Goodfellow et al.,
2015) and the Projected Gradient Descent (PGD)
(Madry et al., 2019). The severity of the adversar-
ial noise is measured by ε value for both FGSM and
PGD. For every image, the ε value is assigned ran-
domly from the range of (0.01 −0.1). For the PGD
adversarial noise, the number of iterations is 7. In to-
tal, 17, 306 augmented images are created either with
Gaussian, salt and pepper, FGSM, or PGD noise.
4.3 Adversarial Noise
Adversarial noise is a specific type of noise that is
injected into an image to mislead a machine-learning
model into making incorrect predictions. The strength
of adversarial noise is that perturbations can be small
enough not to be visible to the human eye yet enough
to raise the chance of incorrect classification. Adver-
sarial noise has two types depending on the knowl-
edge available to the adversarial network. The white-
box attack is the attack generated utilizing the targeted
model’s parameters. While the black-box attack is the
attack generated without having access to the targeted
model’s parameters. FGSM is a fast and computation-
ally light adversarial attack that uses the signed gradi-
ents of the model to create adversarial examples. The
FGSM adversarial example can be represented as:
X
Adv
= X + ε ∗sgn(∇
X
J(θ, X, y), (2)
where X
Adv
is the adversarial image, X is the original
input image, y is the ground truth label, J is the loss
function, θ is the model parameters, and ε measures
the severity of the attack.
PGD is a more effective but computationally
heavy adversarial attack that is generated in an iter-
ative process by computing the gradient that maxi-
mizes the loss with respect to the input image. The
PGD adversarial example can be represented as:
X
Adv
i+1
= Clip
X,ε
n
X
i
+ α sign
∇
X
J(θ;X, y)
o
, (3)
where α is a small step size. The clipping opera-
tion ensures that the adversarial examples are in the
ε-neighborhood of the original data.
4.4 Training Settings
We train all models using the Adam optimization al-
gorithm. All the denoising models are trained for 100
epochs. The MSE loss is used as a metric during the
training of all the denoising models. For training the
denoising models on adversarial noise, certain layers
within the models have a larger kernel size and num-
ber of filters to increase the parameter space and boost
the ability to detect pixel differences among denoising
models. The proposed DenseNet plant disease classi-
fication model is trained in two different scenarios,
i.e., training the model with and without noise im-
age augmentation. The categorical cross entropy is
used for the classification model in the two mentioned
training scenarios.
Robust Denoising and DenseNet Classification Framework for Plant Disease Detection
169
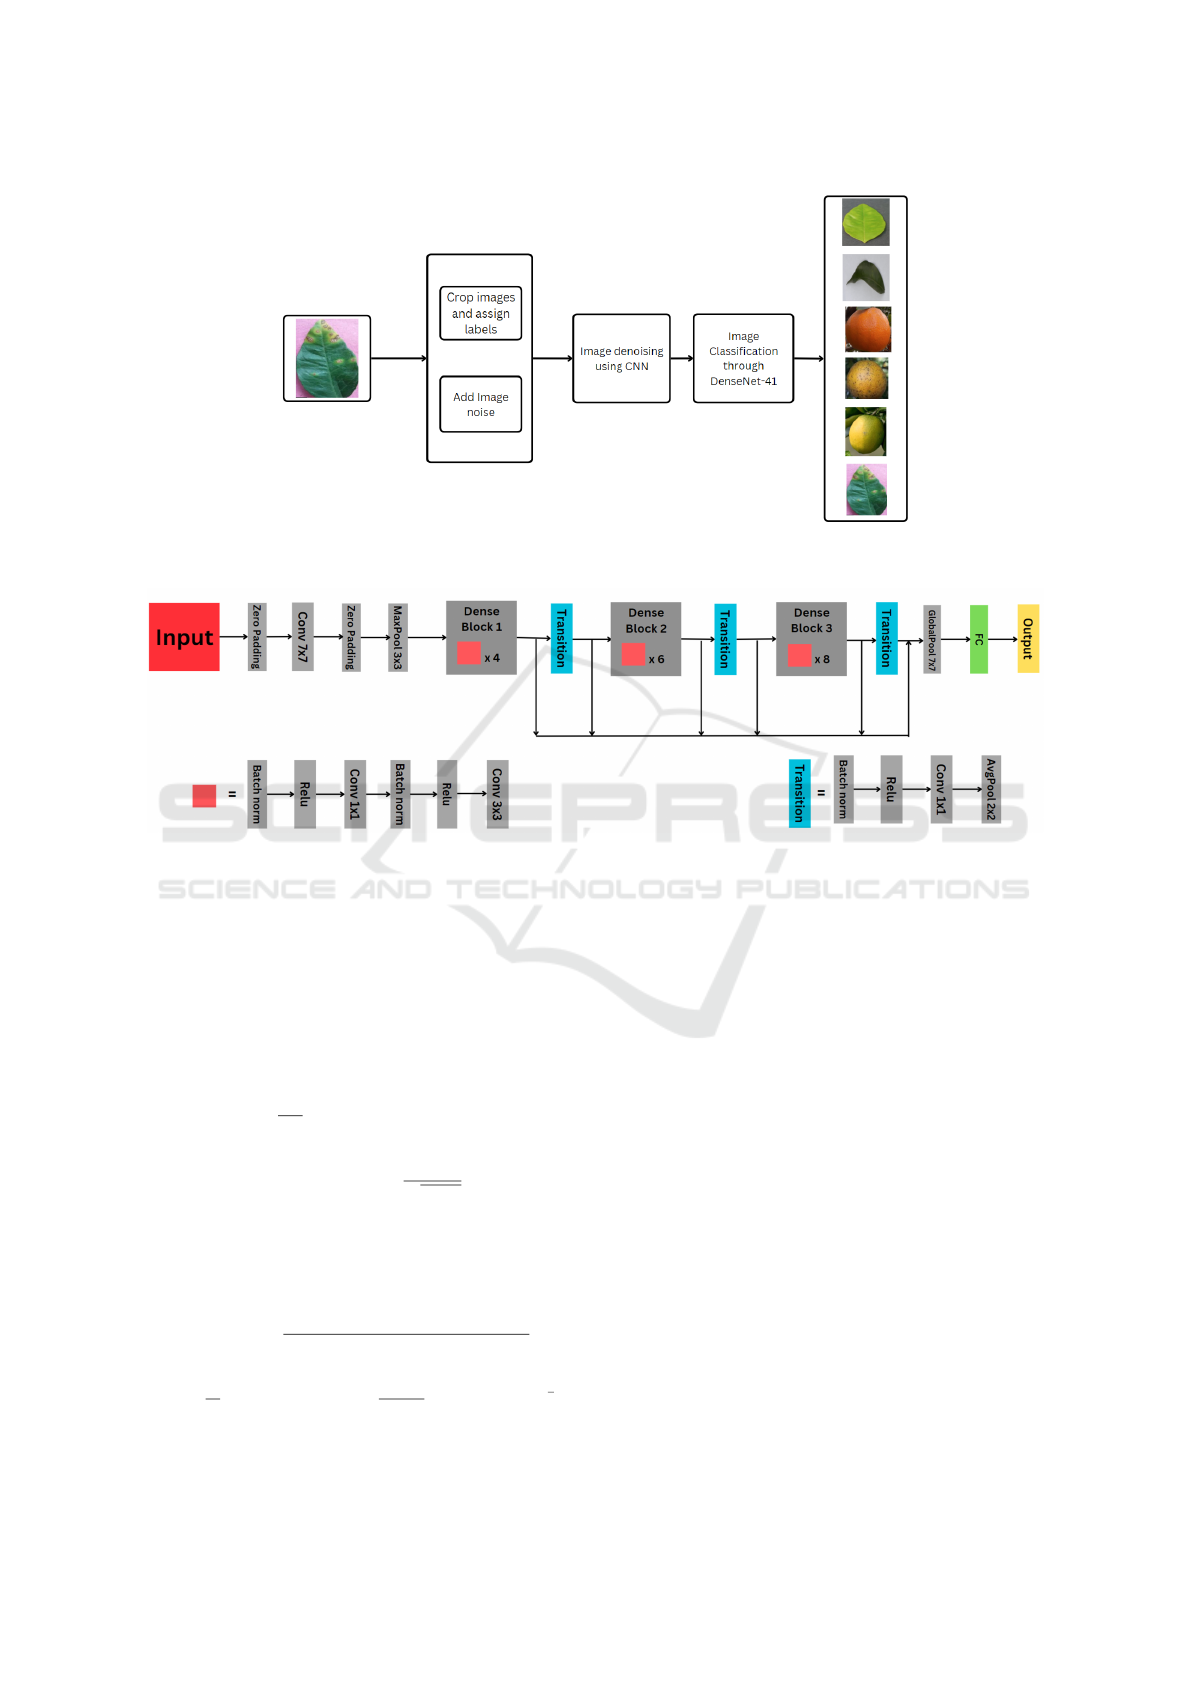
Figure 1: Block diagram that shows the steps used for the plant disease classification, including (1) image processing and
noise injection augmentation, (2) image denoising using CNN, and (3) image classification using the proposed DenseNet-41.
Figure 2: The proposed DenseNet architecture has three dense blocks and three transition layers. The dense blocks have 4, 6,
and 8 pairs of convolution layers within each dense block. Thus, the proposed DenseNet architecture contains 41 convolution
layers and one fully connected layer (DenseNet-41).
4.5 Testing Settings
4.5.1 Image Quality Metrics
We use a peak-signal-to-noise ratio (PSNR) and a
structural similarity index measure (SSIM) to evalu-
ate image quality. PSNR is calculated as follows:
MSE =
1
mn
m−1
∑
i=0
n−1
∑
j=0
[I(i, j) −K(i, j)]
2
. (4)
PSNR = 20 ∗log
10
(
max(I)
√
MSE
), (5)
where max(I) is the maximum possible pixel value of
an m ×n image I and the noisy image K and MSE is
the mean squared error. On the other hand, SSIM is
calculated as follows (Wang et al., 2004):
SSIM(X, Y) =
2(µ
X
µ
Y
+C
1
)(σ
XY
+C
2
)
(µ
2
X
+ µ
2
Y
+C
1
)(σ
2
X
+ σ
2
Y
+C
2
)
. (6)
µ
X
=
1
N
N
∑
i=1
X
i
, and σ
X
= (
1
N −1
N
∑
i=1
(X
i
−µ
X
)
2
)
1
2
,
(7)
where X and Y are non-negative image signals, µ and
σ are the average intensity and standard deviation.
4.5.2 Test Set-Up
The experimental devices and platforms used are
Ubuntu 20.04.6 with a lambda machine of NVIDIA
Quadro RTX 6000. TensorFlow is the library used
for building the proposed deep learning architectures.
After training the denoising and classification mod-
els, the denoising models are individually combined
with the DenseNet image classification model. The
denoising models that are trained on Gaussian and salt
and pepper noise are tested on the Gaussian and salt
and pepper noise test set, and the average PSNR and
structural similarity index measure (SSIM) are col-
lected. We create an adversarial test set for the de-
noising models that are trained on adversarial noise
with a perturbation multiplier (ε) value of 0. The
denoising models are then paired with a DenseNet-
41 to create three different denoising- classification
methods: CBDNet and DenseNet-41 (CBD-DNet),
RIDNet and DenseNet-41 (RID-DNet), and RED-
VISAPP 2024 - 19th International Conference on Computer Vision Theory and Applications
170

Table 1: PSNR and SSIM before and after applying the denoising models for Gaussian and salt and pepper noise.
PSNR SSIM
Before Denoising RIDNet CBDNet REDNet Before Denoising RIDNet CBDNet REDNet
Gaussian 20.39 43.6 38.23 32.16 0.22 0.98 0.94 0.81
Salt & Pepper 21.86 34.01 34.01 31.13 0.58 0.83 0.78 0.75
Net and DenseNet-41 (RED-DNet). An independent
DenseNet-41 without denoising models is also uti-
lized. The PSNR of the denoised image, the accu-
racy, and the loss are collected. We conduct several
experiments where the perturbation multiplier (ε) is
increased gradually by 0.005. At the test time, we
test the models on images corrupted with adversarial
noise with (ε) value from 0 to 0.1.
5 EXPERIMENTAL RESULTS
Table 1 shows the PSNR and SSIM values before
and after applying the denoising models, i.e., RIDNet,
CBDNet, and REDNet. We observe from the table
that the denoising models improve image quality in
the denoised images with higher PSNR and SSIM as
compared to noisy images before applying the denois-
ing models. We also observe that the RIDNet model
performs better than the other two denoising mod-
els with PSNR measurements of 43.6 dB and 34.01
dB and SSIM measurements of 0.98 and 0.83 for the
Gaussian and salt and pepper noise, respectively.
Table 2 shows the evaluation performance of the
proposed DenseNet classification model before com-
bining it with the denoising models. The table
presents the precision, recall, F1-score, and support
for the model before and after applying the noise in-
jection image augmentation techniques. We notice
when noise injection image augmentation is imple-
mented into the training of DenseNet-41, the accuracy
improves by 1.1%. A reason for only a subtle increase
in accuracy is that the noise levels used in the noise in-
jection image augmentations are relatively low, mean-
ing that the images might not significantly differ from
the ground truth image, and DenseNet-41 can still rec-
ognize key patterns within the images, even with a
minor noise disturbance. With higher noise levels and
other image augmentation methods, such as flipping,
the classification model may not easily recognize the
image. Table 3 depicts the accuracy and loss values
for the proposed DenseNet before and after combin-
ing it with the denoising models, where CBD-DNet
means CBD combined with DenseNet and similarly
for RED-DNet and RID-DNet. Figure 3 and 4 show
the accuracy, loss, and PSNR values plotted versus
ε for the proposed DenseNet classification with and
without combining the denoising models for the ad-
versarial noise, FGSM and PGD, respectively. We ob-
serve that combining the denoising models allows for
higher accuracy and lower loss, thus, higher robust-
ness and better stability for the model behavior.
Table 2: Classification evaluation of DenseNet-41 without
the denoising models.
Metrics Disease Ground Truth Noise Augmentation
Training Training
Precision
Black Spot 0.72 0.79
Canker 0.75 0.87
Greening Fruit 1.00 0.97
Healthy Fruit 1.00 1.00
Greening Leaves 0.99 0.99
Healthy Leaves 0.95 0.97
Recall
Black Spot 0.89 0.95
Canker 0.39 0.48
Greening Fruit 0.93 0.94
Healthy Fruit 1.00 1.00
Greening Leaves 1.00 1.00
Healthy Leaves 1.00 1.00
F1-Score
Black Spot 0.80 0.86
Canker 0.51 0.62
Greening Fruit 0.97 0.96
Healthy Fruit 1.00 1.00
Greening Leaves 0.99 0.99
Healthy Leaves 0.98 0.98
Support
Black Spot 250 250
Canker 148 148
Greening Fruit 120 120
Healthy Fruit 1251 1251
Greening Leaves 1114 1114
Healthy Leaves 121 121
6 DISCUSSION AND ANALYSIS
We recognize from our extensive simulation that the
denoising models improve image quality with higher
PSNR and SSIM for the Gaussian and salt and pepper
Robust Denoising and DenseNet Classification Framework for Plant Disease Detection
171
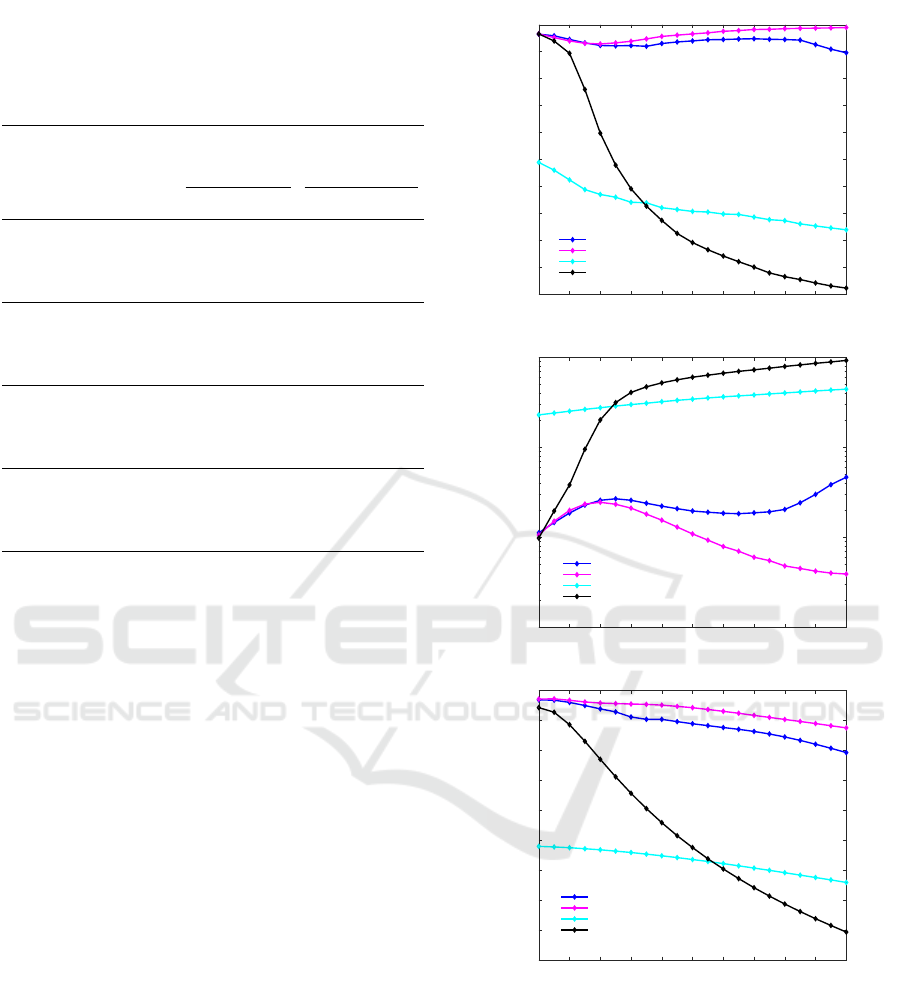
Table 3: Accuracy and loss values for the proposed
DenseNet classification model before and after combined
with the denoising models. Two types of training are
shown: One with noise injection image augmentation and
one without.
Ground Truth Noise Augmentation
Training Training
Methods Image Type Accuracy Loss Accuracy Loss
DenseNet-41
Gaussian 95.67 0.1235 96.77 0.0989
Salt & Pepper 95.91 0.1186 96.94 0.0982
Ground Truth 95.81 0.1213 96.90 0.0985
CBD-DNet
Gaussian 95.67 0.1240 96.80 0.0992
Salt & Pepper 95.74 0.1240 96.84 0.1023
Ground Truth 95.57 0.1250 96.77 0.1000
RED-DNet
Gaussian 95.74 0.1194 96.87 0.0994
Salt & Pepper 95.67 0.1237 96.77 0.1010
Ground Truth 95.64 0.1266 96.67 0.0998
RID-DNet
Gaussian 95.64 0.1270 96.67 0.1021
Salt & Pepper 95.61 0.1242 96.74 0.0993
Ground Truth 95.67 0.1236 96.74 0.0989
noisy images (Table 1). However, when the denois-
ing models are combined with the proposed DenseNet
classification, they don’t significantly contribute to
a higher performance. Table 3 shows insignificant
changes in the loss and accuracy values for the pro-
posed DenseNet-41 before and after combining the
denoising models for the Gaussian and salt and pep-
per noise. The experiments suggest that DenseNet-41
is resistant to Gaussian and salt and pepper noise. On
the other hand, the results for the adversarial noise
show that the deep learning denoising CNNs act as
an effective defense against adversarial noise when
combined with the proposed DenseNet classification
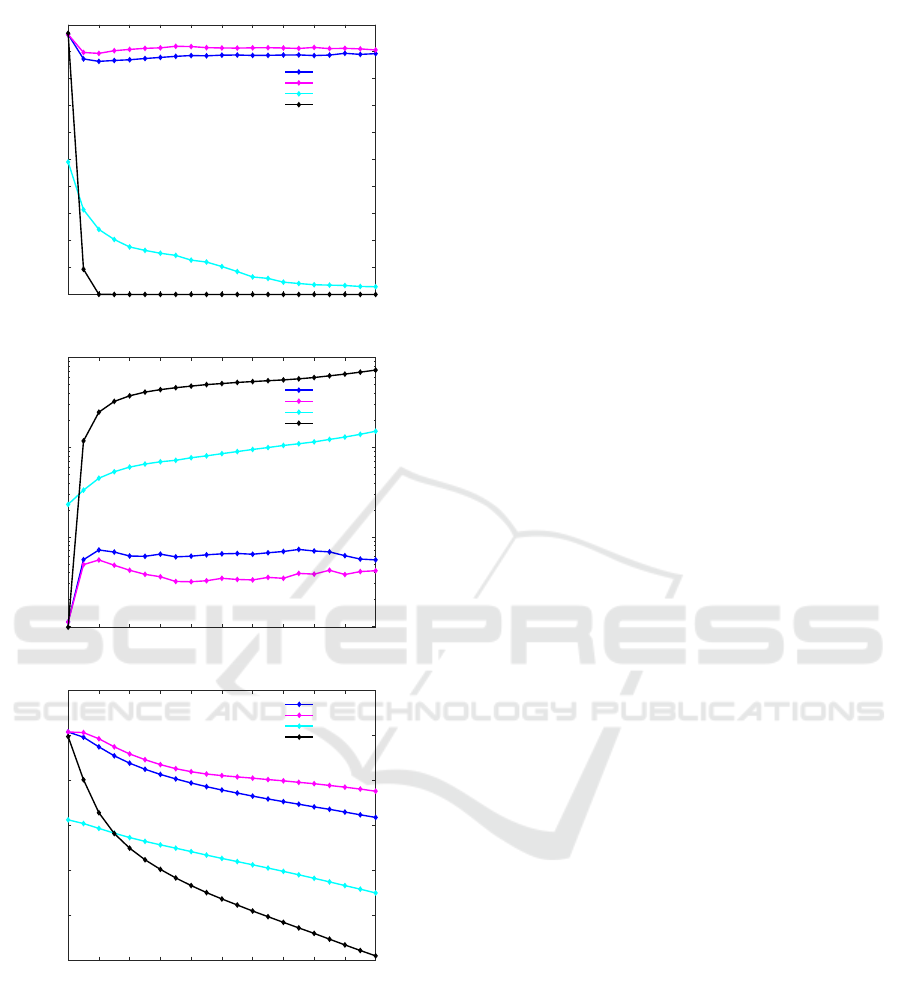
model. Figures 3 and 4 demonstrate that RID-DNet
and CBD-DNet have stable accuracy and loss curves.
Overall, the best-performing denoising model is
RIDnet, achieving the highest PSNR and SSIM mea-
surements when denoising Gaussian and salt and pep-
per noise and the highest stable accuracy when com-
bined with the DenseNet-41 (RID-DNet) against ad-
versarial noise. The RID-DNet model stabilized ac-
curacy is between 89.71% and 92.01% for PGD ad-
versarial noise and between 92.88 and 98.83% for
FGSM adversarial noise. The best-performing RID-
Net denoising model has enhancement attention mod-
ules (EAM), which are known to be effective in fea-
ture extraction and retention.
0 0.01 0.02 0.03 0.04 0.05 0.06 0.07 0.08 0.09 0.1
Epsilon
0
10
20
30
40
50
60
70
80
90
100
Accuracy[%]
CBD-DNet
RID-DNet
RED-DNet
DenseNet-41
0 0.01 0.02 0.03 0.04 0.05 0.06 0.07 0.08 0.09 0.1
Epsilon
10
-2
10
-1
10
0
10
1
Loss
CBD-DNet
RID-DNet
RED-DNet
DenseNet-41
0 0.01 0.02 0.03 0.04 0.05 0.06 0.07 0.08 0.09 0.1
Epsilon
18
20
22
24
26
28
30
32
34
36
PSNR[dB]
CBD-DNet
RID-DNet
RED-DNet
DenseNet-41
Figure 3: The test accuracy, loss and PSNR of proposed
frameworks against FGSM plotted versus the severity of the
adversarial noise ε.
7 CONCLUSION
We propose a deep learning denoising classification
system to increase the robustness and efficiency of
citrus disease detection against noisy and adversar-
ial inputs. We evaluate the capabilities of three state-
VISAPP 2024 - 19th International Conference on Computer Vision Theory and Applications
172
0 0.01 0.02 0.03 0.04 0.05 0.06 0.07 0.08 0.09 0.1
Epsilon
0
10
20
30
40
50
60
70
80
90
100
Accuracy[%]
CBD-DNet
RID-DNet
RED-DNet
DenseNet-41
0 0.01 0.02 0.03 0.04 0.05 0.06 0.07 0.08 0.09 0.1
Epsilon
10
-1
10
0
10
1
10
2
Loss
CBD-DNet
RID-DNet
RED-DNet
DenseNet-41
0 0.01 0.02 0.03 0.04 0.05 0.06 0.07 0.08 0.09 0.1
Epsilon
10
15
20
25
30
35
40
PSNR[dB]
CBD-DNet
RID-DNet
RED-DNet
DenseNet-41
Figure 4: The test accuracy, loss and PSNR of proposed
frameworks against PGD plotted versus the severity of the
adversarial noise ε.
of-the-art denoising models before and after they are
each combined with the proposed DenseNet-41 clas-
sification model. The experiments show that the com-
bination of deep learning denoising models and the
DenseNet-41 classification model is able to improve
the quality of images with Gaussian and impulsive
noise before classification and can successfully detect
citrus diseases against white-box adversarial noises.
The proposed hybrid framework of the deep learning
denoising CNN combined with the DenseNet classi-
fication model allows for cleaner images and a higher
success rate against both types of adversarial noise,
i.e., FGSM and PGD. By comparing the performance
of the denoising models for both image quality and
accuracy when combined with the DenseNet classifi-
cation, the overall best denoising model is RIDnet. In
the future, we aim to stretch the extent of the model by
utilizing different types of image distortion and noise,
such as image blurring, and use substantially stronger
adversarial noise to validate the extent of the robust-
ness of the proposed plant disease classification and
detection framework.
ACKNOWLEDGMENT
This work was supported by the National Science
Foundation Award CRII-2153413/2401828.
REFERENCES
Anwar, S. and Barnes, N. (2020). Real image denoising
with feature attention.
Boyat, A. K. and Joshi, B. K. (2015). A review paper: Noise
models in digital image processing.
Deepa (2018). A pre processing approach for accurate
identification of plant diseases in leaves. In Inter-
national Conference on Electrical, Electronics, Com-
munication, Computer, and Optimization Techniques
(ICEECCOT), pages 249–252.
Gavhale, K. R., Gawande, U., and Hajari, K. O. (2014).
Unhealthy region of citrus leaf detection using image
processing techniques. In International Conference
for Convergence for Technology-2014, pages 1–6.
Goodfellow, I. J., Shlens, J., and Szegedy, C. (2015). Ex-
plaining and harnessing adversarial examples.
Guo, S., Yan, Z., Zhang, K., Zuo, W., and Zhang, L.
(2019). Toward convolutional blind denoising of real
photographs.
Huang, S., Zhou, G., He, M., Chen, A., Zhang, W., and Hu,
Y. (2020). Detection of peach disease image based on
asymptotic non-local means and pcnn-ipelm. IEEE
Access, 8:136421–136433.
Hughes, D. P. and Salath
´
e , M. (2015). An open ac-
cess repository of images on plant health to en-
able the development of mobile disease diagnostics
through machine learning and crowdsourcing. CoRR,
abs/1511.08060.
Huq, A. and Pervin, M. T. (2020). Analysis of adversarial
attacks on skin cancer recognition. In 2020 Interna-
tional Conference on Data Science and Its Applica-
tions (ICoDSA), pages 1–4.
Khan, M. M. R., Sakib, S., Arif, R. B., and Siddique, M.
A. B. (2018). Digital image restoration in matlab: A
Robust Denoising and DenseNet Classification Framework for Plant Disease Detection
173

case study on inverse and wiener filtering. In 2018 In-
ternational Conference on Innovation in Engineering
and Technology (ICIET), pages 1–6.
Lakshmanarao, A., Babu, M. R., and Kiran, T. S. R. (2021).
Plant disease prediction and classification using deep
learning convnets. In 2021 International Conference
on Artificial Intelligence and Machine Vision (AIMV),
pages 1–6.
Li, L., Zhang, S., and Wang, B. (2021). Plant disease de-
tection and classification by deep learning—a review.
IEEE Access, 9:56683–56698.
Li, S., Wu, F., Duan, Y., Singerman, A., and Guan, Z.
(2020). Citrus greening: Management strategies and
their economic impact. HortScience horts, 55(5):604
– 612.
Limshuebchuey, A., Duangsoithong, R., and Saejia, M.
(2020). Comparison of image denoising using
traditional filter and deep learning methods. In
2020 17th International Conference on Electrical
Engineering/Electronics, Computer, Telecommunica-
tions and Information Technology (ECTI-CON), pages
193–196.
Lloyd, S. (1982). Least squares quantization in pcm. IEEE
Transactions on Information Theory, 28(2):129–137.
Madry, A., Makelov, A., Schmidt, L., Tsipras, D., and
Vladu, A. (2019). Towards deep learning models re-
sistant to adversarial attacks.
Mao, X.-J., Shen, C., and Yang, Y.-B. (2016). Image
restoration using convolutional auto-encoders with
symmetric skip connections.
Martin, D., Fowlkes, C., Tal, D., and Malik, J. (2001).
A database of human segmented natural images and
its application to evaluating segmentation algorithms
and measuring ecological statistics. In Proc. 8th Int’l
Conf. Computer Vision, volume 2, pages 416–423.
Narmadha, R. P. and Arulvadivu, G. (2017). Detection and
measurement of paddy leaf disease symptoms using
image processing. In 2017 International Conference
on Computer Communication and Informatics (IC-
CCI), pages 1–4.
Nivethitha, T., Vijayalakshmi, P., Jaya, J., and Shriram, S.
(2022). A review on coconut tree and plant disease de-
tection using various deep learning and convolutional
neural network models. In International Conference
on Smart and Sustainable Technologies in Energy and
Power Sectors (SSTEPS), pages 130–135.
Pl
¨
otz, T. and Roth, S. (2017). Benchmarking denoising al-
gorithms with real photographs.
Shaikh, R. P. and Dhole, S. A. (2017). Citrus leaf unhealthy
region detection by using image processing technique.
In 2017 International conference of Electronics, Com-
munication and Aerospace Technology (ICECA), vol-
ume 1, pages 420–423.
Sharma, R. and Kukreja, V. (2022). Amalgamated con-
volutional long-term network (cltn) model for lemon
citrus canker disease multi-classification. In Interna-
tional Conference on Decision Aid Sciences and Ap-
plications (DASA), pages 326–329.
Shireesha, G. and Reddy, B. E. (2022). Citrus fruit and
leaf disease detection using densenet. In 2022 Inter-
national Conference on Smart Generation Computing,
Communication and Networking (SMART GENCON),
pages 1–5.
Solomon, S. (2021). Image denoising using deep learning.
accessed on November, 2022.
Torres, J. C. C. (2021). Columbian citrus fruits.
Wang, Z., Bovik, A., Sheikh, H., and Simoncelli, E. (2004).
Image quality assessment: from error visibility to
structural similarity. IEEE Transactions on Image
Processing, 13(4):600–612.
Xu, Z., Terada, Y., Jia, D., Cai, Z., and Gao, S. (2018).
Recognition effects of deep convolutional neural net-
work on smudged handwritten digits. In 2018 5th
International Conference on Information Science and
Control Engineering (ICISCE), pages 412–416.
Zilvan, V., Ramdan, A., Suryawati, E., Kusumo, R. B. S.,
Krisnandi, D., and Pardede, H. F. (2019). Denoising
convolutional variational autoencoders-based feature
learning for automatic detection of plant diseases. In
2019 3rd International Conference on Informatics and
Computational Sciences (ICICoS), pages 1–6.
VISAPP 2024 - 19th International Conference on Computer Vision Theory and Applications
174
