
TreeSpecies-PC2DT: Automated Tree Species Modeling from Point
Clouds to Digital Twins
Like Gobeawan
1 a
, Xuan Liu
1 b
, Chi Wan Lim
1 c
, Venugopalan Raghavan
1 d
, Joyjit Chattoraj
1 e
,
Jan Schindler
2
and Feng Yang
1
1
Institute of High Performance Computing, Agency for Science, Technology and Research,
1 Fusionopolis Way #16-16 Connexis, Singapore, Singapore
2
Manaaki Whenua - Landcare Research, Wellington, New Zealand
schindlerj@landcareresearch.co.nz
Keywords:
Digital Twin, Tree Species Model, Point Cloud Data, Tree Branch Reconstruction, Procedural Modeling,
Optimisation.
Abstract:
3D digital twin trees for a city-scale have been limited to low-resolution, static shape models due to challenges
in automation/scalability, cost performance, tree growth dynamics, species complexities and compatibilities
with simulations and virtual city platforms. To address those challenges for high-resolution tree models,
we propose an automated workflow of generating large-scale, lightweight, dynamic digital-twin tree species
models from point cloud data. Species digital twins are modelled as detailed hierarchical branch structures
by solving for all species profile parameters through stages of branch reconstruction from point cloud data,
species profiling by machine learning, tropism transfer, optimisation and species growth modelling based on
botany and limited field survey. We show that the generated high-resolution tree models can be lightweight
while representing their true species characteristics and dynamic botanical architecture (branching patterns
and growth processes).
1 INTRODUCTION
1.1 Motivation
With the rise of artificial intelligence (AI) technolo-
gies for automation tasks, the digital twin (DT) for
objects, processes or systems in real life are gain-
ing traction in manufacturing, aviation and transporta-
tion, healthcare, medicine (Barricelli et al., 2019), and
more slowly, smart city domain and city-scale DT
for urban planning, sustainability and climate change
mitigation (Mylonas et al., 2021). DT cities poses
many challenges in coverage and operationalisation
(Lei et al., 2023) due to complexities in urban life
comprising physical structures and living things (hu-
man beings, greeneries and animals). In particular,
DT cities often focus on physical structures at various
a
https://orcid.org/0000-0001-6501-6394
b
https://orcid.org/0000-0002-1760-9993
c
https://orcid.org/0000-0002-8319-9742
d
https://orcid.org/0000-0003-0831-4218
e
https://orcid.org/0000-0003-1910-8954
levels of details and leave out the dynamic structure of
greeneries that play essential social-economic, envi-
ronmental roles in green cities such as Singapore (Na-
tional Research Foundation, 2018). More specifically,
DT trees for a city-scale have been limited to low-
resolution/simplistic, static watertight shape models
for their cost performance and compatibilities with
simulations.
On the other hand, addressing dynamic species-
level trees and their interactions with the environ-
ments in the form of high-resolution species digital
twins will enable more comprehensive simulations
and analysis, leading to better insights and improved
urban planning. However, this poses a grand chal-
lenge in automating and maintaining the modelling
of millions of dynamically growing tree species at a
large/city scale based on remote sensing data. Firstly,
remote sensing data, such as (lower-resolution) satel-
lite imagery and (higher-resolution) LiDAR (light de-
tection and ranging) scanned point cloud, generally
contain fuzzy information of tree characteristics due
to noises, obstacles and other limitations in their ac-
quisition. Thus, they require manual pre-processing
Gobeawan, L., Liu, X., Lim, C., Raghavan, V., Chattoraj, J., Schindler, J. and Yang, F.
TreeSpecies-PC2DT: Automated Tree Species Modeling from Point Clouds to Digital Twins.
DOI: 10.5220/0012389700003660
Paper published under CC license (CC BY-NC-ND 4.0)
In Proceedings of the 19th International Joint Conference on Computer Vision, Imaging and Computer Graphics Theory and Applications (VISIGRAPP 2024) - Volume 1: GRAPP, HUCAPP
and IVAPP, pages 81-91
ISBN: 978-989-758-679-8; ISSN: 2184-4321
Proceedings Copyright © 2024 by SCITEPRESS – Science and Technology Publications, Lda.
81
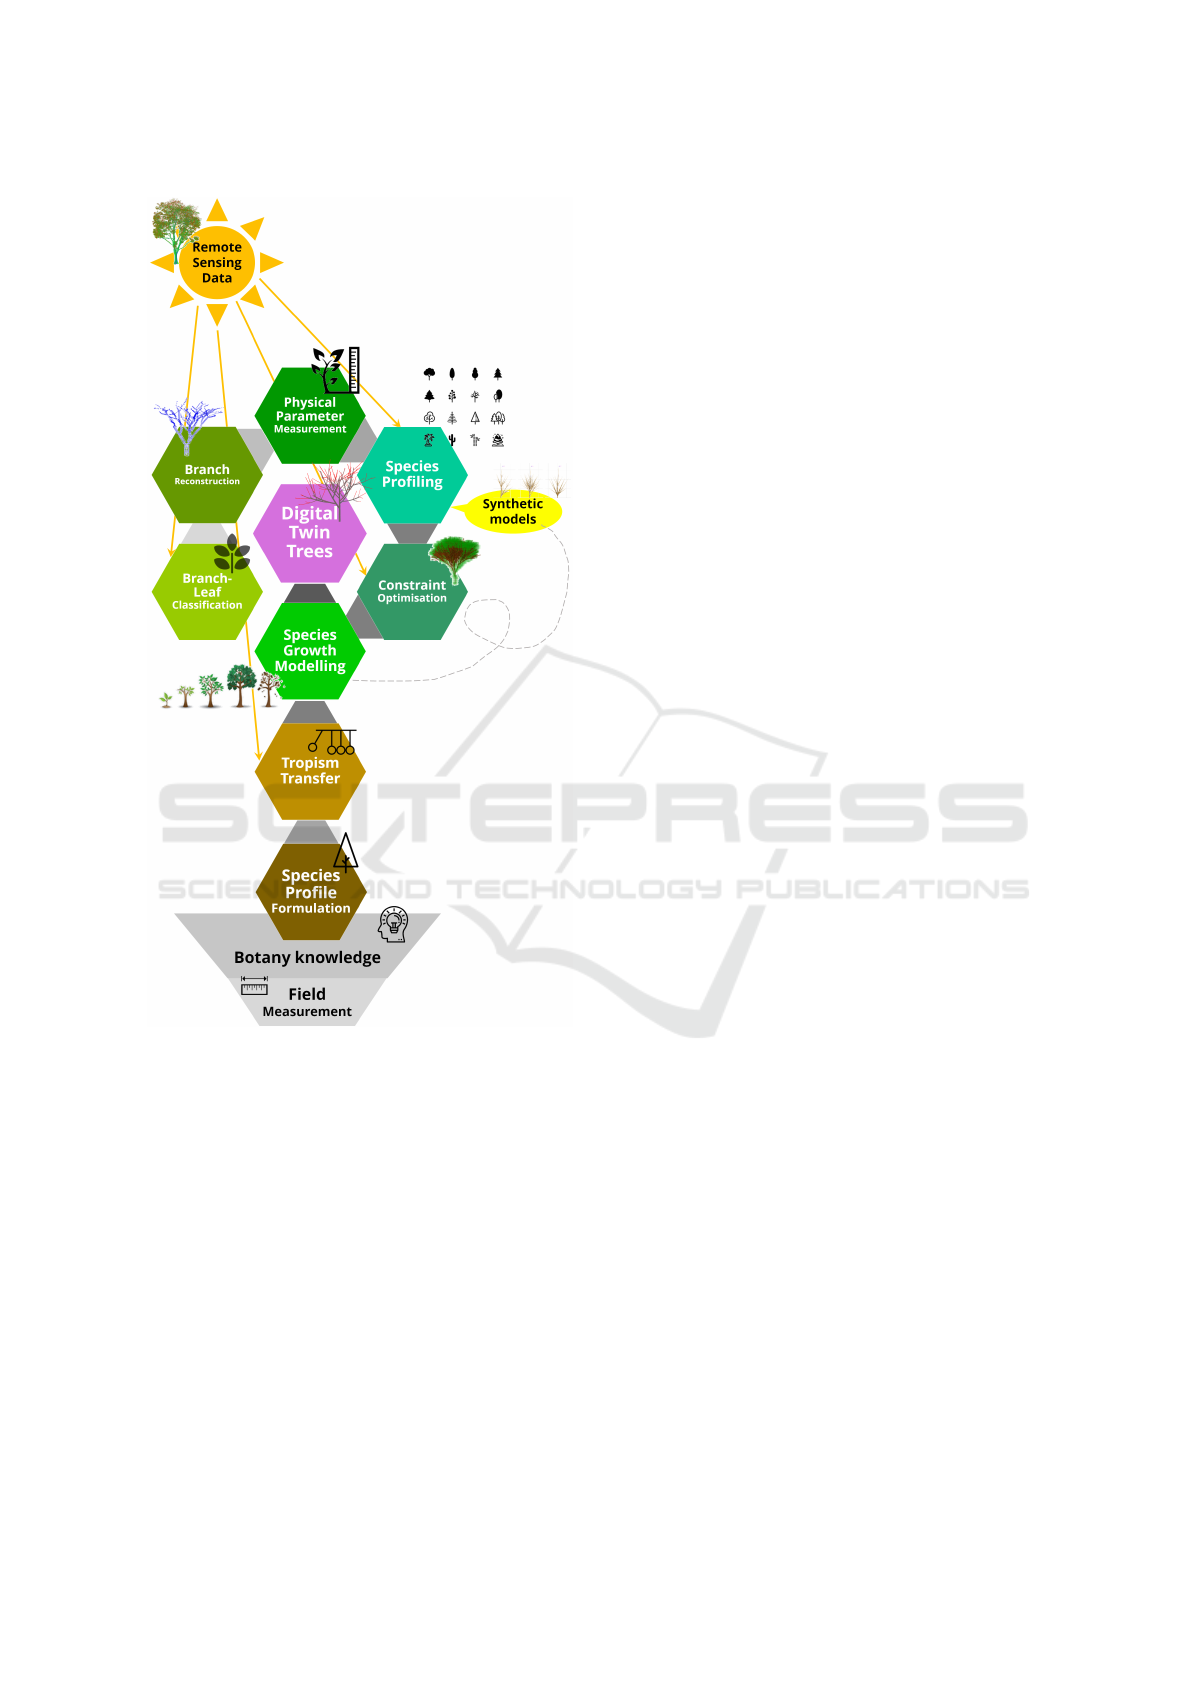
Figure 1: Automated digital twin tree species model from
remote sensing data.
and patching in order to produce estimated models
with limited accuracies on the actual branch structure
of the tree species. Secondly, temporal data of tree
growths are very scarce. They can only be reliably in-
ferred from high-resolution MLS (mobile laser scan-
ning) point cloud or photogrammetry, whose acquisi-
tion is, in contrast, low in frequency (typically annu-
ally or biennially) for a city-wide campaign. Thirdly,
such high-resolution data of millions of trees have an
extremely low cost performance - they take consider-
able resources to exist dynamically on DT city plat-
forms.
1.2 Problem Statements
This work seeks to automatically generate city-scale,
lightweight and dynamic tree models to represent the
trees at a high-resolution species level, i.e. displaying
high-fidelity branch patterns and growth processes of
individual trees. To remain lightweight, the species
models should not be represented by mesh surfaces
or volumes with high count of polygons or voxels.
1.3 Literature Review
Most DT city tools seek to model (in 3D) static physi-
cal structures at various level of details, yet stop short
in modelling greeneries as low-resolution, static 3D
shape tree models (Lin et al., 2018) in virtual cities
(National Research Foundation, 2018; Government,
2019). For high-resolution trees, (Gobeawan et al.,
2018; Stava et al., 2014; Makowski et al., 2019) at-
tempted to generate dynamic tree models from re-
mote sensing data to high-resolution textured polygon
models, however they are not validated for a city-scale
implementation as their high polygon counts lead to
tendency to overload the platform rendering in real
time.
In the field of FSPM (functional-structural plant
modelling), there are many works (Godin and Sino-
quet, 2005; Vos et al., 2010; Siev
¨
anen et al., 2014;
Yi et al., 2018; Talle and Kosinka, 2020; Niese et al.,
2020) on modelling individual tree species along with
their growth and functions at high levels of detail, yet
very specific to certain individual or species, hence
they are not scalable. At the core of FSPM, L-system
(Prusinkiewicz and Lindenmayer, 1996) is a good
candidate to produce lightweight species models, as
it adopts a procedural modelling approach of using
a small set of rules to generate a wide variety of tree
models. However, there have been very few concerted
efforts to establish a procedural-based framework for
DT species at the city-scale.
As such, we propose an automated workflow of
city-scale, dynamic tree species modelling from re-
mote sensing data to digital twin tree models.
2 METHODOLOGY
Our automated workflow, herein codenamed as
TreeSpecies-PC2DT, starts with the point cloud data
of a tree as an input and generates a final output of a
digital twin species model (Figure 1). The workflow
comprises of 5 main modules:
• branch segmentation and reconstruction for tree
measurements
GRAPP 2024 - 19th International Conference on Computer Graphics Theory and Applications
82
• species profiling
• tropism transfer
• constraint optimisation
• species growth modelling
Each digital twin tree is individually modelled
to closely match the actual trees by a set of param-
eters with different values that define their unique
species profiles. The values of these parameters are
derived for an individual tree by reconstructing pre-
liminary branch structures from point cloud data by
branch point classification and branch/skeleton re-
construction. Due to fuzziness in the crown where
leaves might obstruct high-order branches (twigs), the
branch reconstruction stage is only effective in mea-
suring trunk and branch components which are not
concealed by leaves and other objects within the tree
crown. Hence, the tree measurements can be obtained
for trunk parameters such as trunk height and diame-
ter, trunk pitch and roll angles, as well as first order
branch count and first branching pitch and roll angles.
Subsequently, the ML (machine learning)-based
species profiling module will use the reconstructed
branches to predict values of other unknown tree pa-
rameters with a certain level of confidence. The ML
is trained to recognise or estimate tree parameter val-
ues by learning from the big data of synthetic species
models which were generated based on true botanic
growth and branching processes incorporated in the
species growth modelling module. The knowledge
learnt is then transferred to train on reconstructed
branches derived from the scarce real point cloud
data.
Along with the former two modules above, the
tropism transfer module estimates the tree tropism,
i.e. the growth response of the tree to environment
stimuli. The tropism transfer uses the reconstructed
branch structure and existing tropism models in liter-
ature to derive the change in growth direction along
the tree stem and the stem elasticity parameter of the
tree along its proximal (trunk) and distal (branches).
Finally, the remaining unknown parameter values
(or parameter values with low confidence) will be
solved by the optimisation module. The completely
solved parameter configuration will be fed into the
species growth modelling module to generate the dig-
ital twin species models.
The species growth modelling module contains
a set of growth rules that dictate how the tree
grows over time. The growth rules are formu-
lated from botany knowledge and limited field sur-
vey/measurements.
As a whole workflow, TreeSpecies-PC2DT is
able to automatically process city-scale individual
trees from the point cloud data into the botanically-
representative, lightweight, and dynamic digital twin
species models.
2.1 Input Data
The input to TreeSpecies-PC2DT workflow is LiDAR
(light detection and ranging) point clouds with res-
olutions ranging from high to low. The point cloud
resolution depends on the means of scanning, such as
MLS (mobile laser scanning), TLS (terrestrial laser
scanning), and ULS (UAV (unmanned aerial vehicle)
laser scanning) or ALS (aerial laser scanning).
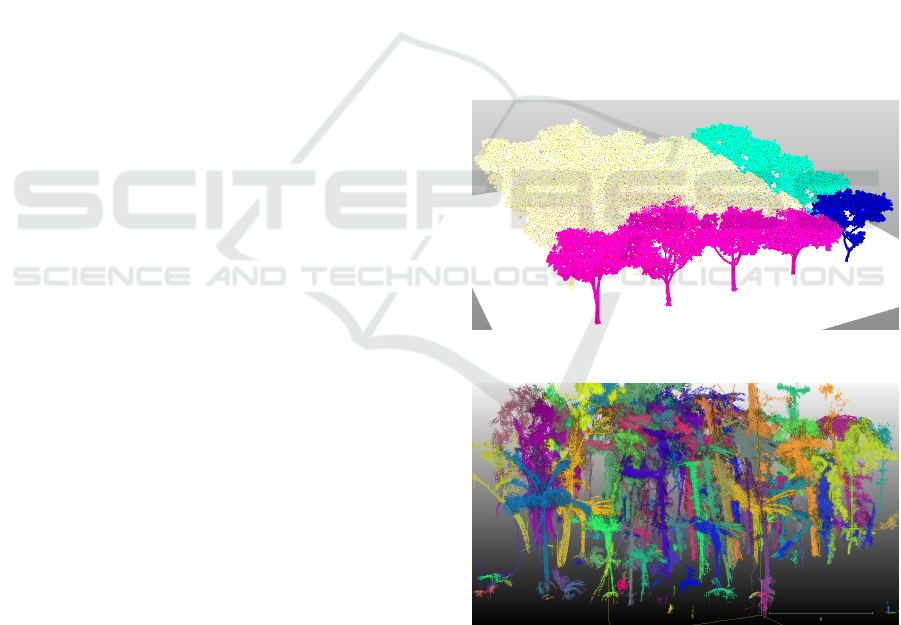
The main input data used for the workflow demon-
stration in this paper is the high-resolution MLS point
cloud, which were acquired by Singapore Land Au-
thority (SLA) (Soon and Khoo, 2017) using Riegl
VMX-450 with a density of 40 points/m
2
. Individual
tree point clouds were extracted using tree segmenta-
tion algorithms (Gobeawan et al., 2018). A group of
MLS datasets are also placed on a plot (Figure 2) for
testing the tree modelling workflow.
Figure 2: Individual MLS trees on a plot.
Figure 3: Segmented individual trees from subcanopy TLS
data.
We also experimented with the subcanopy TLS
data of a complex natural forest plot in New Zealand
(Figure 3). The point cloud data was captured with
a FARO Focus3D X 330 laser scanner in the Oron-
gorongo Valley in the Greater Wellington Region,
New Zealand. The study site is particularly challeng-
TreeSpecies-PC2DT: Automated Tree Species Modeling from Point Clouds to Digital Twins
83
ing because of dense undergrowth including vines, a
mixture of native species and rough terrain making
accurate high-resolution measurements difficult. The
point cloud was stitched together from several mea-
surements with the help of survey reflectors placed
in the field, and further post-processed for noise fil-
tering, ground-vegetation classification, as well as
woody material and stem segmentation and individual
stems using point clustering. Starting at seeded stem
locations, the entire individual trees were segmented
using a region-growing algorithm.
2.2 Branch Segmentation and
Reconstruction for Tree
Measurements
This section entails branch segmentation (i.e. branch-
leaf classification) and branch reconstruction for de-
riving tree measurements. While there have been
works in tree measurements from point cloud data
such as (Hartley et al., 2022), in general they still
require labourious onsite survey to obtain measure-
ments for higher order branches of the trees. Hence,
we focus on automated tree measurements for lower
order trunk and branches.
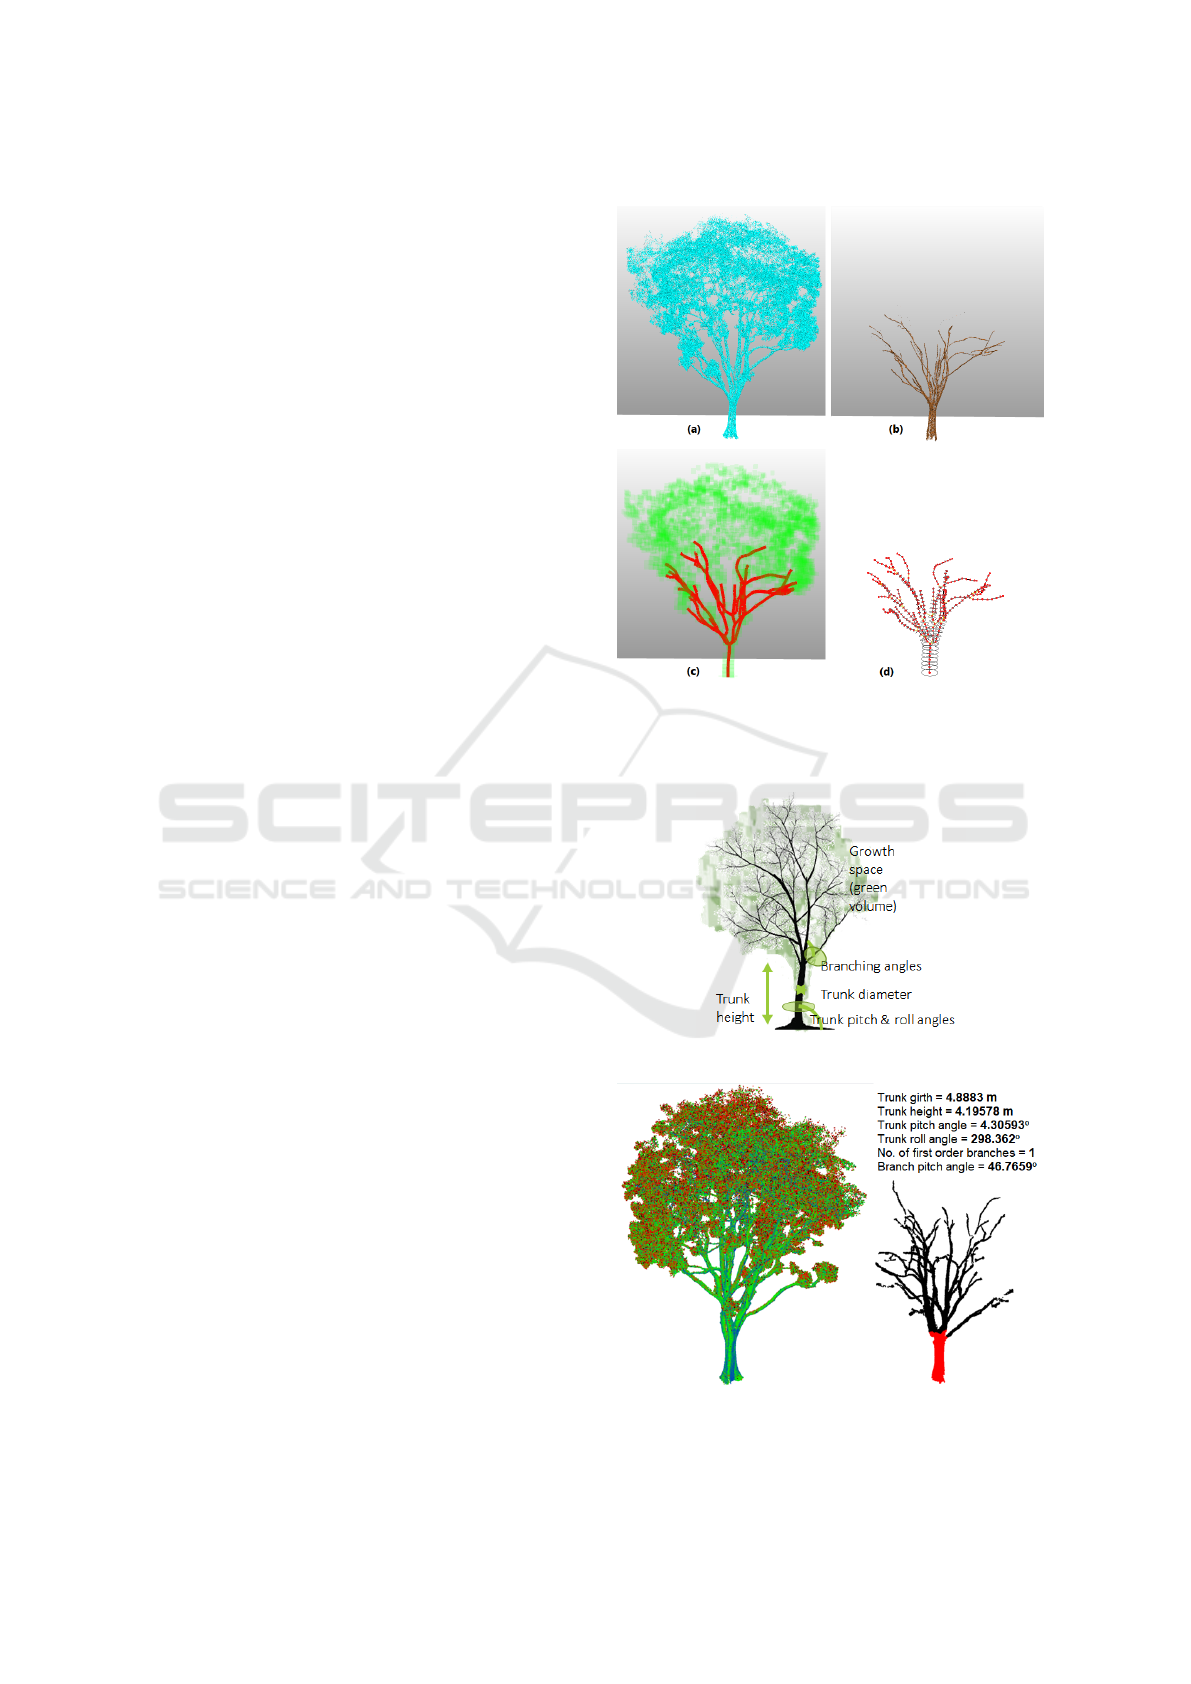
Given the input point cloud data of an individ-
ual tree, we perform branch-leaf classification to ex-
tract the tree’s woody points and then branch recon-
struction to connect those woody points into a skele-
ton structure of branch centre points with their corre-
sponding radii (Figure 4).
The branch segmentation and reconstruction algo-
rithms are based on (Lim et al., 2020), producing an
MTG (multiscale tree graph) detailing the hierarchi-
cal branch points with their radius and connectivity.
Each node in the MTG file consists of a radius param-
eter to indicate the thickness of the branch. The first
node of the MTG node is the tree base on the ground.
Using the branch connectivity and radius values, we
can derive values of an initial set of parameters for
tree measurements, such as trunk height, trunk pitch
and roll angles, trunk diameter and girth, branch pitch
and roll angles, and number of first order branches
(Figure 5). To get appropriate measurements, it is
important to modify the MTG in (Lim et al., 2020)
to consider the actual sizes of trunk and branches
in determining the hierarchy of all nodes (stems and
twigs), i.e. parent-child relationships at all branching
points.
To do this, radii of all nodes corresponding to
each branching point are compared, starting from the
ground level of the trunk, i.e. the first node of the
MTG. If any trunk node has a single child node, that
child node is also assigned as the trunk node. In the
Figure 4: (a) Original point cloud, (b) woody point cloud,
(c) reconstructed branch skeleton (red) superimposed with
growth space (green), (d) hierarchy of branch centre points
and their radii (MTG format).
Figure 5: Tree measurement diagram.
Figure 6: Woody segmentation and branch reconstruction
for tree measurement of Khaya senegalensis.
GRAPP 2024 - 19th International Conference on Computer Graphics Theory and Applications
84
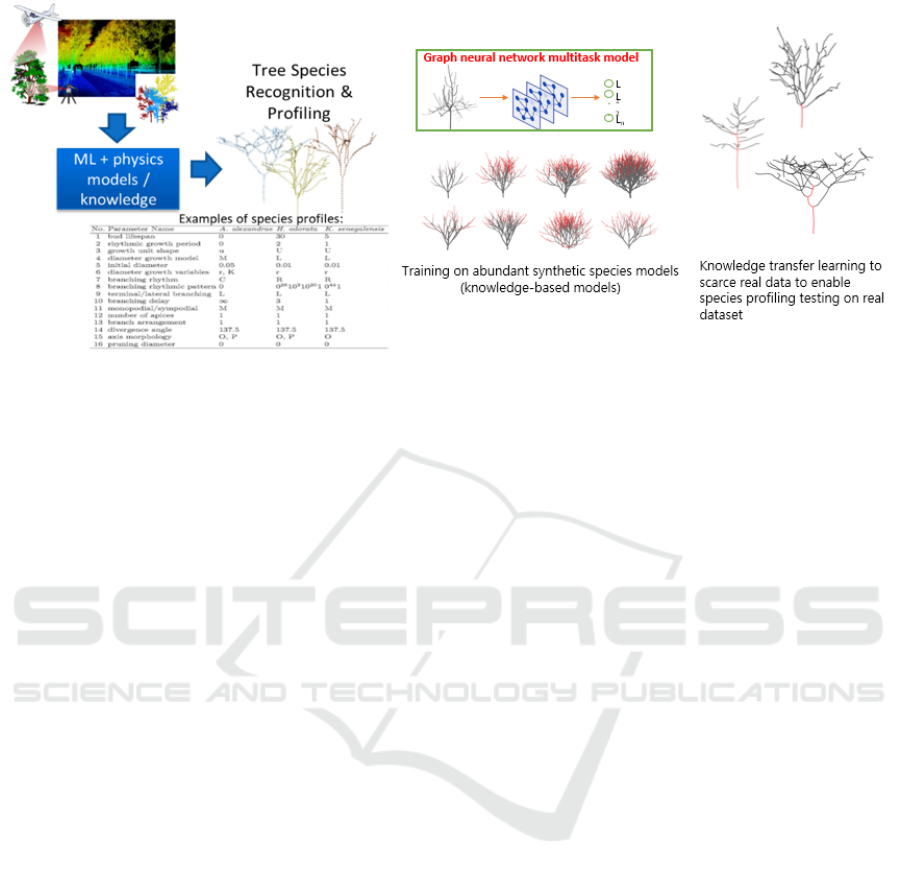
Figure 7: Species profiling flow.
case of a branching point with multiple child nodes, a
simple test is applied to determine if any of the child
node is a trunk node too. If the combined cross-
sectional area of the child nodes is larger than the
cross sectional area of the parent node, then the child
with the largest radius assigned as the continuation of
the trunk node.
Once all the trunk nodes are assigned, tree mea-
surements can be derived (Figure 6). The trunk height
can be computed by adding up the distances between
adjacent trunk nodes. The trunk ground girth is taken
as the circumference of the trunk node closest to
the ground level. The trunk pitch angle is taken as
the smallest angle from the up vector to the trunk
axis, while the trunk roll angle is measured counter-
clockwise from the North vector to the projected trunk
axis on the horizontal plane. The number of first or-
der branching is taken as the first instance of multiple
child node encountered from ground up. The branch
pitch and roll angles are derived from the first order
branches with respect to the trunk.
2.3 Species Profiling
The species profiling module aims to determine the
values of all species profile parameters with corre-
sponding levels of confidence (Figure 7). If unknown
parameters can be solved with an acceptable level
of confidence, they are considered solved and subse-
quently passed to the next stage in the TreeSpecies-
PC2DT workflow.
The species profiling work has been described in
detail in (Chattoraj et al., 2022). In this work, ML-
based method of knowledge transfer learning from
abundant synthetic species data with known param-
eter values to scarce real tree data was devised to de-
tect species profile parameter values of a given real
tree input.
The species profile parameters and their values
(listed in Table 2) are collated from all runs and
organised into XML (extensible markup language)-
formatted:
• individual profiles for individual trees with their
known individual and species information
• species profiles for known species with their
species-specific statistics obtained from botany
knowledge and field surveys, then bootstrapped
by newly detected values from species profiling
of incoming real tree data, and
• species library as a collection of species profiles
and individual profiles.
The species library are used by the species growth
modelling module (Section 2.6) to generate synthetic
species data for training the species profiling module
(Gobeawan et al., 2023).
2.4 Tropism Transfer
The tropism transfer module seeks to detect tropism
characteristics (such as bending curvature and elastic-
ity of tree trunk and branches) from reconstructed tree
branches and to transfer the tropism onto DT species
models. As tropism detection requires temporal data
such as tree growth snapshots which are generally not
present in individual reconstructed trees, we rely on
growth snapshots of synthetic trees or experimental
tropism data to derive ranges of values of relevant
tropism parameters in our species growth modelling
(Section 2.6).
While our preliminary work (Raghavan et al.,
2023) performs a direct transfer of the trunk bend-
TreeSpecies-PC2DT: Automated Tree Species Modeling from Point Clouds to Digital Twins
85
ing appearance from a tree point cloud skeleton to an
individual tree model, the tropism transfer module in
this paper expands it as a mapping of the trunk/branch
bending appearance of a tree point cloud skeleton to a
tropism model that predicts growth changes of a tree
model in response to environment/external stimuli.
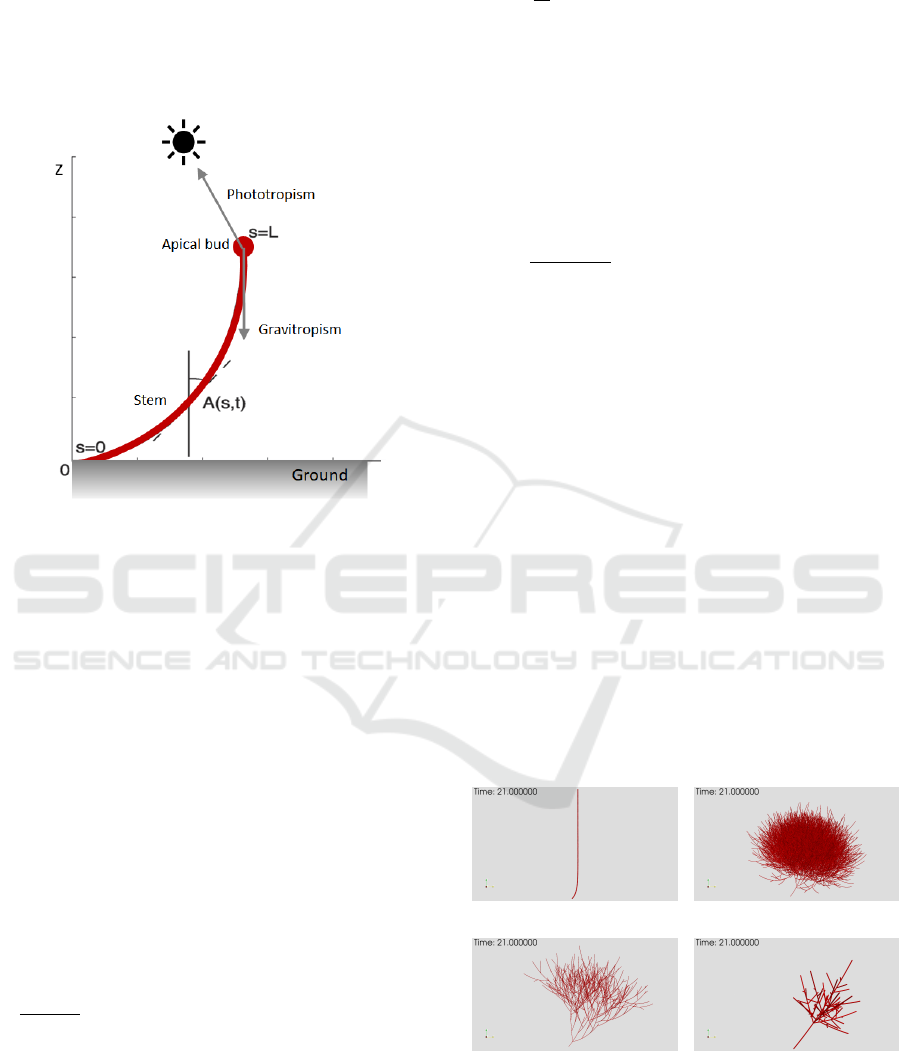
Figure 8: Diagram of phototropism and gravitropism on a
stem.
Modelling of tropism, particularly the tree growth
response to light (phototropism) and gravity (gravit-
ropism) as well as its own ability to grow straight in
the absence of environment stimuli (autotropism), has
been done by deriving a mathematical representation
of the behaviour of plants (Bastien et al., 2015; Moul-
ton et al., 2020). In (Bastien et al., 2015), the tropism
is modelled as changes in angles and curvatures of the
part of the plant that is growing (Figure 8). Depend-
ing on the considered tropisms (phototropism, gravit-
ropism and/or autotropism), angles and curvatures are
linked to one or more tropism sensitivity parameters
(photosensitivity, gravisensitivity and/or propriosen-
sitivity) by partial differential equations (PDEs).
Our current work considers all three tropisms by
adopting the A
a
R
C model in (Bastien et al., 2015) (Fig-
ure 8), which is formulated as
∂C(s, t)
∂t
= −ν(A(L, t)) − A
P
) − βA(s, t) − γC(s, t)
(1)
where s represents the curvilinear coordinate of a
node along a stem (s = 0 at stem end at ground and s =
L at the apical end), A(s, t) is the node’s bending angle
(with respect to up vector) at s and at time t, C(s,t)
is the local curvature at s and t, A
P
is the direction
angle of light from down vector, while ν, β and γ are
the photo-, gravi- and proprio- sensitivity coefficients
respectively.
As
∂A
∂s
= C, Equation 1 is complex to solve an-
alytically, hence a numerical approach is adopted.
While numerical approaches are capable of handling
integro-differential equations, Equation 2 is assumed
to ensure a better understanding of the underlying
phenomena.
A(s,t) = A(0, t) +C(s, t)s (2)
Thus, Equation 1 becomes
C
k+1
i
−C
k
i
∆t
= −ν(A
k
i
− A
P
) − βA
k
i
− γC
k
i
(3)
where superscript k indicates the current time step
while the subscript i indicates the current point along
the growing member.
To solve Equation 3, we adopted an explicit time-
stepping with a restriction on the value of ∆t that
can be used. Our tests indicate that the time-step ∆t
should range from 1e
−3
to 1e
−4
time units to ensure
convergences for the angle and curvature values.
Assuming that the values of the tropism sensitiv-
ity parameters, ν, β and γ are obtained from available
growth data (either from field experiments or analyt-
ics from synthetic tree data), the angles and curvatures
of all points along the stem for each time step can be
computed.
By solving all the tropism parameters above, we
can generate species models with the same tropism
behaviour of a tree input (Figure 9). Based on the in-
herent characteristics of each species, the exhibited
tropism effect will be different even with the same
specified values for the tropism parameters (refer to
species profile parameters for tropism in Table 2).
(a) (b)
(c) (d) .
Figure 9: A tropism is transferred to four tree species: (a)
Archontophoenix alexandrae, (b) Khaya senegalensis, (c)
Samanea saman, (d) Hopea odorata.
GRAPP 2024 - 19th International Conference on Computer Graphics Theory and Applications
86
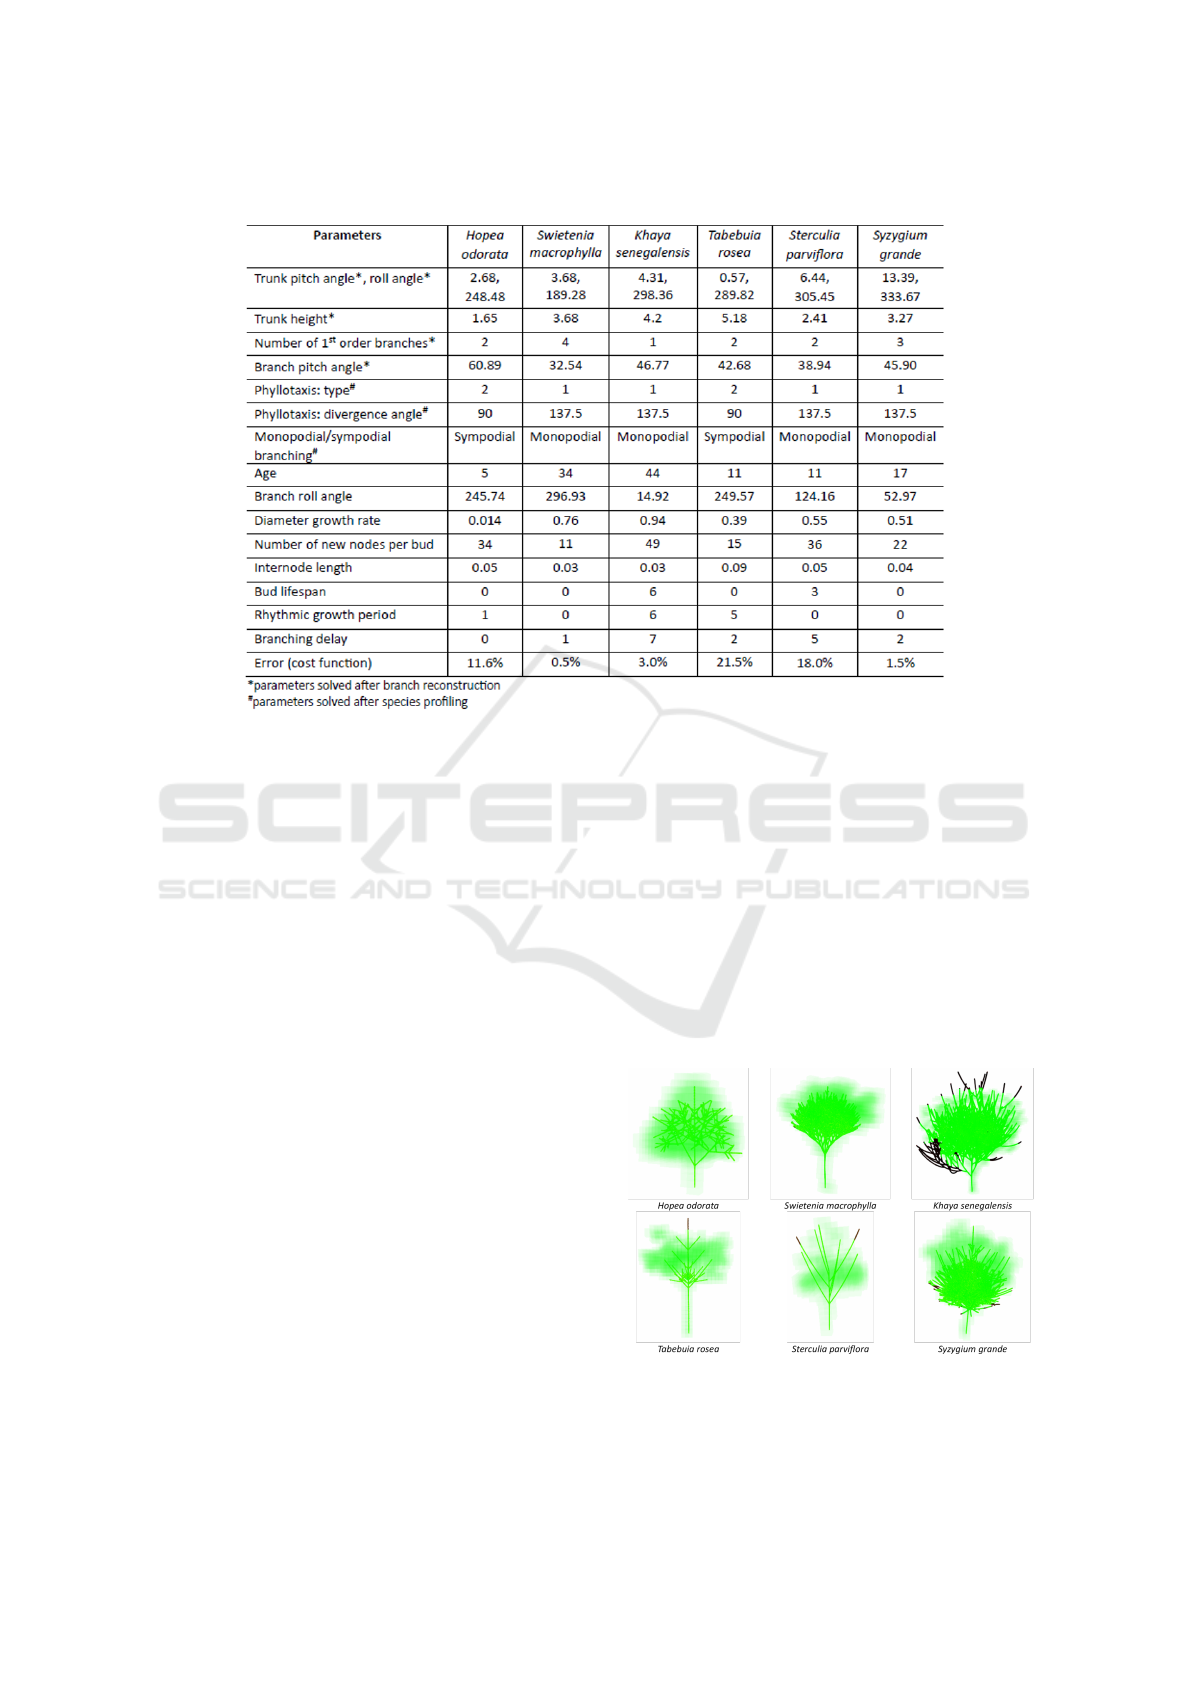
Table 1: Optimised parameters for various tree samples.
2.5 Optimisation
The final round of solving for remaining parameters
with unknown values or low confidences from branch
reconstruction and species profiling modules is done
by optimisation. The optimisation module utilises a
genetic algorithm (GA) method to find the best con-
figuration of species profile parameters within speci-
fied physical constraints (Gobeawan et al., 2021; Lim
et al., 2023). An initial database is generated from
a population of possible parameter configuration so-
lutions over ranges of possible values appended with
cost function evaluated for each solution. The algo-
rithm then pairs a selection of the best solutions with
a number of random solutions from the database, cre-
ating parent solutions. A successive generation of 4
child solutions are generated from the parent solution
by making slight adjustments to their values. These
successive generations along with their correspond-
ing cost function elevations, are appended to update
the database. This process continues iteratively until
a predefined number of generations is reached or the
cost meets the specified threshold.
The cost function of the optimisation measures
a linear weighted distances between the solution
and the physical constraints. Theses physical con-
straints include both macroscopic shape (i.e.crown
shape and dimension) and microscopic structure of
the target tree (i.e. trunk bending, measurements,
growth space). Specifically, the growth space refers
to a set of voxels within a uniform grid in the 3D
space derived from input point cloud data. Details
of the cost function are described in (Gobeawan et al.,
2021).
Table 1 shows the optimised parameters for indi-
vidual trees of various species. It has 3 categories
of parameters: (1) solved by branch reconstruction:
trunk pitch angle, trunk roll angle, trunk height, num-
ber of first order branches and branch pitch angle, (2)
solved by species profiling: phyllotaxis and monopo-
dial/sympodial branching and (3) solved by optimisa-
tion: the rest of all parameters. Any solved parame-
ters with low confidence levels in the previous mod-
ules (branch reconstruction and species profiling) will
be re-solved by optimisation.
Figure 10: Optimised species models (black) within growth
spaces (green).
TreeSpecies-PC2DT: Automated Tree Species Modeling from Point Clouds to Digital Twins
87

Figure 11: Comparison of running times for each iteration
with and without parallelisation.
In addition, if the tree comes with identified
species, the optimisation search space can be further
reduced to within smaller ranges of parameter values
specific to that species.
The optimisation process is set to terminate by a
limited period of time or when the error E falls be-
low 10%, whichever is earlier. Their corresponding
tree models with given growth space (voxel spacing
of 50cm, minimum of 5 points per voxel) are shown
in Figure 10.
The optimisation process is also highly paral-
lelised for improving system efficiency and running
time. Figure 11 shows that the running time decreases
linearly with the increase in the number of computing
processors used.
2.6 Species Growth Modelling
The species growth modelling module aims to gen-
erate dynamically growing DT species models (Fig-
ure 12) based on the input values of species profile pa-
rameters. The mechanism and formulation of growth
rules in this module is described in details in (Gob-
eawan et al., 2021). Further updates to the list of
species profile parameters are shown in Table 2 to in-
clude tropism parameters. Additional growth param-
eters can be added to the list in order to simulate more
phenomena and interactions between trees and envi-
ronments.
In addition, synthetic models can be generated by
varying the values of species profile parameters.
3 RESULTS AND DISCUSSION
We tested high-resolution MLS data of Singapore
trees and low-resolution TLS data of New Zealand
trees, both individually and as a scene of trees, in the
TreeSpecies-PC2DT workflow.
Given an individual tree of known species Khaya
senegalensis from MLS input data, the TreeSpecies-
PC2DT workflow generates a DT species model with
a good fit with the actual scanned tree (Figure 13).
Figure 12: Clockwise from top left: Growth snapshots of a
typical tree of species Tabebuia rosea grows from 1 to 17
years old, with a growth space reference (green) at 11 years
old.
For an individual tree of unknown species from low-
resolution TLS input data, the workflow generates a
very simple DT model correspondingly, while captur-
ing the essential bending and architecture of the input
tree (Figure 14).
While time benchmark was not done in this exper-
iment, we show the planting of DT species models in
a plot for both MLS and TLS data in Figures 15 and
16 and observed stark difference in loading time for
DT models (in seconds) and original point clouds (in
minutes) on the same computer system. This shows
the potential of lightweight DT species models for
large-scale city platforms.
4 CONCLUSIONS
The proposed high-resolution, species-level represen-
tation DT models in MTG format is very lightweight
yet representing fundamental species characteristics
of branching patterns and dynamic growth, making
them suitable for large scale simulations. While their
visual appearance as not as realistic as high-polygon-
count trees with textures, the DT species models cor-
respond to the actual tree branch structure in real-
ity. Meshing such DT species models as in (Lim
et al., 2020) potentially turns the DT models into
simulation-ready models - enabling many environ-
mental simulations and analysis without using expen-
sive high-resolution tree models.
Future works for TreeSpecies-PC2DT are planned
for testing with more types of LiDAR data while eval-
uating the performance of DT species on virtual cities,
in addition to expansion to include root of the trees
in order to allow wider environment simulations us-
ing whole trees for tree health and safety management
purposes.
GRAPP 2024 - 19th International Conference on Computer Graphics Theory and Applications
88

Table 2: Species profile parameters.
No. Parameter Name Format Unit Description
A Growth process
1 bud lifespan ≥ 0 year Lifespan of a bud, 0 if indeterminate
2 rhythmic growth period ≥ 0 year Period of rhythmic growth to produce
1 GU, zero if continuous growth
3 growth unit shape a choice - Unspecified (U), acrotonic (A),
mesotonic (M), or basitonic (B)
4 diameter growth model a choice - Relative growth rate (RGR): linear (L),
exponential (E), power law (P),
monomolecular (M), 3-param logistic (3PL),
4-param logistic (4PL), Gombertz (G)
5 initial diameter > 0 meter Non-zero minimum branch diameter
6 diameter growth ranges t:day, Variables for RGR equation with respect
variables r, β, K, L M:cm, to growth model
B Branching process
7 branching rhythm a choice - Continuous (C), rhythmic (R), or diffuse (D)
8 rhythmic branching pattern xxx - Binary rhythmic branching pattern of 0s and 1s
9 terminal/lateral a choice - New branches are formed by lateral
branching buds (L) or apical split (T)
10 branching delay ≥ 0 year New branches grow out immediately (0)
or after some delay
11 monopodial/sympodial a choice - Apical stem remains dominant with emergence of
branching lateral branches (M) or stops growing with
emergence of dominant lateral branches (S)
12 no. of dominant apices ≥ 1 - Sole or multiple dominant apices (scaffolds)
13 phyllotaxis type a choice - Alternate (1), opposite (2), or whorled (n)
14 divergence angle 0 ≤ θ ≤ 180 degree Angle between two branches from adjacent rows
C Tropism One or multiple entries
15 tropism type a choice - Gravitropism, phototropism, or autotropism
16 proximal response a choice - Trunk responds towards/against stimulus,
orthotropically/plagiotropically
17 distal response a choice - Branches respond towards/against stimulus,
orthotropically/plagiotropically
18 plagiotropic angle a range, degree For plagiotropy, at an angle from stimulus
0 ≤ θ ≤ 90
19 elasticity a range, - Ease to bend
0 < E < 1
20 source format a vector - Field, point, plane, or volume to respond to
21 pruning diameter ≥ 0 meter To prune branches smaller than pruning diameter
E Constraints
22 growth space a volume - Physical space occupied by the tree
23 age a range, ≥ 1 year Simulation age for the species
24 trunk ground girth a range, > 0 m Circumference of trunk closest to ground level
25 trunk pitch angle a range, degree Angle between up vector and trunk axis
0 ≤ θ ≤ 180 closest to ground
26 trunk roll angle a range, degree Counter-clockwise (CCW) angle from
0 ≤ θ < 360 North to trunk on ground
27 trunk height a range, ≥ 0 meter Distance from ground to first branching point
28 no. of 1
st
order branches a range, ≥ 0 - At first branching point from bottom
29 branch pitch angle a range, degree From parent’s head down to start of branch
0 ≤ θ ≤ 180
30 branch roll angle a range, degree Rotate CCW around parent’s head
0 ≤ θ < 360
31 diameter growth rate a range, - Normalised growth rate; first three decimals
0 ≤ g ≤ 1 are mapped to diameter growth variables
32 number of new nodes a range, > 0 /year Number of nodes a bud produces in a year
33 internode length a range, ≥ 0 meter Length of a segment between adjacent nodes
TreeSpecies-PC2DT: Automated Tree Species Modeling from Point Clouds to Digital Twins
89
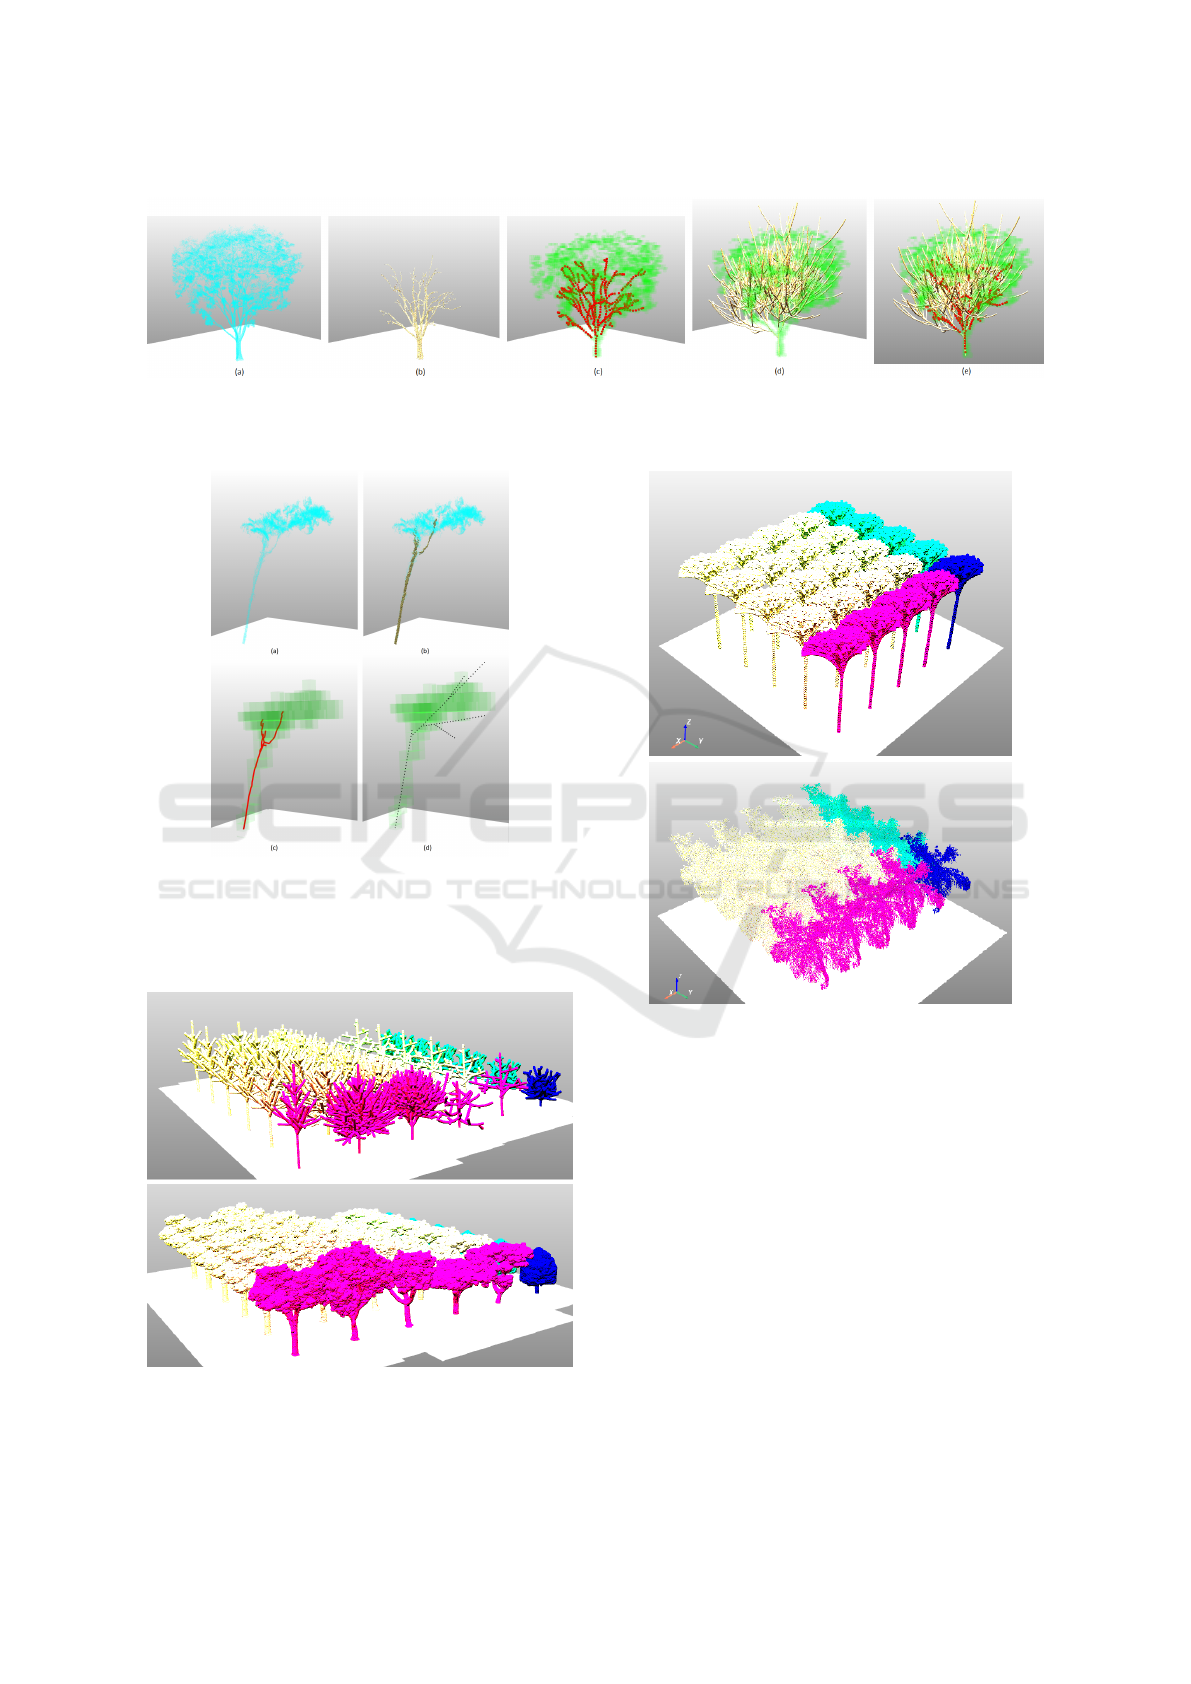
Figure 13: Generating DT species of Khaya senegalensis from MLS data: (a) MLS point cloud, (b) segmented branch point
cloud, (c) reconstructed branch (red) within growth space (green), (d) DT species (yellow) within growth space (green), (e)
DT species (yellow) superimposed with reconstructed branch (red) within growth space (green).
Figure 14: Generating a DT tree of unidentified species
from TLS data: (a) TLS point cloud, (b) segmented branch
point cloud (brown), (c) reconstructed branch (red) within
growth space (green), (d) DT tree (black) within growth
space (green).
Figure 15: Comparison of a scene of lightweight DT species
(top) with a scene of much denser MLS point clouds of the
same tree species (bottom).
Figure 16: Comparison of a scene of lightweight DT palms
(left) with a scene of denser TLS point clouds of palms
(right).
ACKNOWLEDGEMENTS
This research/project is supported by the Catalyst:
Strategic Fund from Government Funding, adminis-
tered by the Ministry of Business Innovation & Em-
ployment, New Zealand under contract C09X1923, as
well as the National Research Foundation, Singapore
under its Industry Alignment Fund – Pre-positioning
(IAF-PP) Funding Initiative. Any opinions, findings
and conclusions or recommendations expressed in
this material are those of the author(s) and do not re-
flect the views of National Research Foundation, Sin-
gapore.
GRAPP 2024 - 19th International Conference on Computer Graphics Theory and Applications
90

REFERENCES
Barricelli, B. R., Casiraghi, E., and Fogli, D. (2019). A
survey on digital twin: Definitions, characteristics,
applications, and design implications. IEEE Access,
7:167653–167671.
Bastien, R., Douady, S., and Moulia, B. (2015). A uni-
fied model of shoot tropism in plants: Photo-, gravi-
and propio-ception. PLoS computational biology,
11:e1004037.
Chattoraj, J., Yang, F., Lim, C. W., Gobeawan, L., Liu,
X., and Raghavan, V. S. (2022). Knowledge-driven
transfer learning for tree species recognition. In 2022
17th International Conference on Control, Automa-
tion, Robotics and Vision (ICARCV), pages 149–154.
Gobeawan, L., Chattoraj, J., Yang, F., Lim, C. W., Liu,
X., and Raghavan, V. S. G. (2023). Knowledge-
based learning for plant phenotyping. In Chen, T.-W.,
Kahlen, A. F. K., and St
¨
utzel, H., editors, 10th Inter-
national Conference on Functional-Structural Plant
Models (FSPM2023), pages 140–141.
Gobeawan, L., Lin, E. S., Tandon, A., Yee, A. T. K., Khoo,
V. H. S., Teo, S. N., Su, Y., Lim, C. W., Wong, S. T.,
Wise, D. J., Cheng, P., Liew, S. C., Huang, X., Li,
Q. H., Teo, L. S., Fekete, G. S., and Poto, M. T.
(2018). Modeling trees for Virtual Singapore: From
data acquisition to CityGML models. International
Archives of the Photogrammetry, Remote Sensing and
Spatial Information Sciences, XLII-4/W10:55–62.
Gobeawan, L., Wise, D. J., Wong, S. T., Yee, A. T. K.,
Lim, C. W., and Su, Y. (2021). Tree species modelling
for digital twin cities. Transactions on Computational
Science XXXVIII, pages 17–35.
Godin, C. and Sinoquet, H. (2005). Functional–structural
plant modelling. New Phytologist, 166(3):705–708.
Government, N. S. W. (2019). Nsw spatial digital twin.
Hartley, R. J. L., Jayathunga, S., Massam, P. D., De Silva,
D., Estarija, H. J., Davidson, S. J., Wuraola, A., and
Pearse, G. D. (2022). Assessing the potential of
backpack-mounted mobile laser scanning systems for
tree phenotyping. Remote Sensing, 14(14).
Lei, B., Janssen, P., Stoter, J., and Biljecki, F. (2023). Chal-
lenges of urban digital twins: A systematic review and
a delphi expert survey. Automation in Construction,
147:104716.
Lim, C. W., Gobeawan, L., Wong, S. T., Wise, D. J., Cheng,
P., Poh, H. J., and Su, Y. (2020). Generation of tree
surface mesh models from point clouds using skin sur-
faces. In 15th International Conference on Computer
Graphics Theory and Applications, pages 83–92.
Lim, C. W., Liu, X., Gobeawan, L., Raghavan, V. S. G.,
Chattoraj, J., and Yang, F. (2023). Species model
parameterisation. In Chen, T.-W., Kahlen, A. F. K.,
and St
¨
utzel, H., editors, 10th International Conference
on Functional-Structural Plant Models (FSPM2023),
pages 68–69.
Lin, E.-S., Teo, L.-S., Yee, A.-T.-K., and Li, Q.-H. (2018).
Populating large scale virtual city models with 3D
trees. In 55th IFLA World Congress, Singapore.
Makowski, M., H
¨
adrich, T., Scheffczyk, J., Michels, D. L.,
Pirk, S., and Pałubicki, W. (2019). Synthetic silvicul-
ture: Multi-scale modeling of plant ecosystems. ACM
Trans. Graph., 38(4).
Moulton, D., Oliveri, H., and Goriely, A. (2020). Multiscale
integration of environmental stimuli in plant tropism
produces complex behaviors. Proceedings of the
National Academy of Sciences (PNAS), 117:32226–
32237.
Mylonas, G., Kalogeras, A., Kalogeras, G., Anagnostopou-
los, C., Alexakos, C., and Mu
˜
noz, L. (2021). Digital
twins from smart manufacturing to smart cities: A sur-
vey. IEEE Access, 9:143222–143249.
National Research Foundation (2018). Vir-
tual Singapore. NRF website
https://www.nrf.gov.sg/programmes/virtual-
singapore.
Niese, T., Pirk, S., Albrecht, M., Benes, B., and Deussen,
O. (2020). Procedural urban forestry.
Prusinkiewicz, P. and Lindenmayer, A. (1996). The Al-
gorithmic Beauty of Plants. Springer-Verlag, Berlin,
Heidelberg.
Raghavan, V. S. G., Gobeawan, L., Lim, C. W., Liu, X.,
Chattoraj, J., and Yang, F. (2023). Detecting plant
tropism from lidar data. In Chen, T.-W., Kahlen,
A. F. K., and St
¨
utzel, H., editors, Book of Abstracts
of the 10th International Conference on Functional-
Structural Plant Models (FSPM2023), pages 123–
124.
Siev
¨
anen, R., Godin, C., Dejong, T., and Nikinmaa, E.
(2014). Functional-structural plant models: A grow-
ing paradigm for plant studies. Annals of botany,
114:599–603.
Soon, K. H. and Khoo, V. H. S. (2017). CITYGML
MODELLING FOR SINGAPORE 3D NATIONAL
MAPPING. In ISPRS - International Archives of the
Photogrammetry, Remote Sensing and Spatial Infor-
mation Sciences, volume XLII-4-W7, pages 37–42.
Copernicus GmbH.
Stava, O., Pirk, S., Kratt, J., Chen, B., M
´
zch, R., Deussen,
O., and Benes, B. (2014). Inverse procedural mod-
elling of trees. Comput. Graph. Forum, 33(6):118–
131.
Talle, J. and Kosinka, J. (2020). Evolving l-systems in
a competitive environment. In Magnenat-Thalmann,
N., Stephanidis, C., Wu, E., Thalmann, D., Sheng,
B., Kim, J., Papagiannakis, G., and Gavrilova, M.,
editors, Advances in Computer Graphics, pages 326–
350, Cham. Springer International Publishing.
Vos, J., Evers, J. B., Buck-Sorlin, G. H., Andrieu, B.,
Chelle, M., and de Visser, P. H. B. (2010). Func-
tional–structural plant modelling: a new versatile tool
in crop science. Journal of Experimental Botany,
61(8):2101–2115.
Yi, L., Li, H., Guo, J., Deussen, O., and Zhang, X. (2018).
Tree growth modelling constrained by growth equa-
tions. Computer Graphics Forum, 37(1):239–253.
TreeSpecies-PC2DT: Automated Tree Species Modeling from Point Clouds to Digital Twins
91
