
Oral Dysplasia Classification by Using Fractal Representation Images
and Convolutional Neural Networks
Rafael H. O. Carvalho
1 a
, Adriano B. Silva
1 b
, Alessandro S. Martins
2 c
, S
´
ergio V. Cardoso
3 d
,
Guilherme R. Freire
4 e
, Paulo R. de Faria
5 f
, Adriano M. Loyola
3 g
, Tha
´
ına A. A. Tosta
6 h
,
Leandro A. Neves
7 i
and Marcelo Z. do Nascimento
1 j
1
Faculty of Computer Science, Federal University of Uberl
ˆ
andia, Brazil
2
Federal Institute of Tri
ˆ
angulo Mineiro, Brazil
3
Area of Oral Pathology, School of Dentistry, Federal University of Uberl
ˆ
andia, Brazil
4
Department of Informatics Engineering, Faculty of Engineering, University of Porto, Portugal
5
Department of Histology and Morphology, Institute of Biomedical Science, Federal University of Uberl
ˆ
andia, Brazil
6
Science and Technology Institute, Federal University of S
˜
ao Paulo, Brazil
7
Department of Computer Science and Statistics (DCCE), S
˜
ao Paulo State University, Brazil
Keywords:
Dysplasia, Fractal Geometry, Reshape, Convolutional Neural Network, Ensemble, Histological Image.
Abstract:
Oral cavity lesions can be graded by specialists, a task that is both difficult and subjective. The challenges in
defining patterns can lead to inconsistencies in the diagnosis, often due to the color variations on the histo-
logical images. The development of computational systems has emerged as an effective approach for aiding
specialists in the diagnosis process, with color normalization techniques proving to enhance diagnostic accu-
racy. There remains an open challenge in understanding the impact of color normalization on the classification
of histological tissues representing dysplasia groups. This study presents an approach to classify dysplasia
lesions based on ensemble models, fractal representations, and convolutional neural networks (CNN). Ad-
ditionally, this work evaluates the influence of color normalization in the preprocessing stage. The results
obtained with the proposed methodology were analyzed with and without the preprocessing stage. This ap-
proach was applied in a dataset composed of 296 histological images categorized into healthy, mild, moderate,
and severe oral epithelial dysplasia tissues. The proposed approaches based on the ensemble were evaluated
with the cross-validation technique resulting in accuracy rates ranging from 96.1% to 98.5% with the non-
normalized dataset. This approach can be employed as a supplementary tool for clinical applications, aiding
specialists in decision-making regarding lesion classification.
1 INTRODUCTION
Oral epithelial dysplasia is a benign precancerous ab-
normality with the potential to progress into malig-
a
https://orcid.org/0000-0003-2673-3125
b
https://orcid.org/0000-0001-8999-1135
c
https://orcid.org/0000-0003-4635-5037
d
https://orcid.org/0000-0003-1809-0617
e
https://orcid.org/0000-0001-5883-2983
f
https://orcid.org/0000-0003-2650-3960
g
https://orcid.org/0000-0001-9707-9365
h
https://orcid.org/0000-0002-9291-8892
i
https://orcid.org/0000-0001-8580-7054
j
https://orcid.org/0000-0003-3537-0178
nant oral cancer (Warnakulasuriya et al., 2008). It is
a relatively common precursor of oral cancer and, if
not treated in its early stages, it may progress to oral
squamous cell carcinoma (Smith et al., 2009). Tabag-
ism, alcoholism, nutritional deficiencies and genetic
predispositions are the main etiological and predis-
posing factors that contribute to the lesion malignant
progression (Pires et al., 2013). These lesions are lo-
cally invasive and are associated with a 50% survival
rate (Sagheer et al., 2021).
In the diagnostic process, these lesions may be
categorized into different types by the specialist, ren-
dering the diagnosis subjective and presenting chal-
lenges in distinguishing the lesions (Warnakulasuriya
et al., 2008). The diagnosis is often performed by
524
Carvalho, R., Silva, A., Martins, A., Cardoso, S., Freire, G., R. de Faria, P., Loyola, A., Tosta, T., Neves, L. and Z. do Nascimento, M.
Oral Dysplasia Classification by Using Fractal Representation Images and Convolutional Neural Networks.
DOI: 10.5220/0012389000003660
Paper published under CC license (CC BY-NC-ND 4.0)
In Proceedings of the 19th International Joint Conference on Computer Vision, Imaging and Computer Graphics Theor y and Applications (VISIGRAPP 2024) - Volume 3: VISAPP, pages
524-531
ISBN: 978-989-758-679-8; ISSN: 2184-4321
Proceedings Copyright © 2024 by SCITEPRESS – Science and Technology Publications, Lda.

microscopical analysis of the lesion size and the in-
tensity of morphological alterations in tissue nuclei.
These histological structures are commonly assessed
using the hematoxylin-eosin (H&E) stain, in which
the cell nuclei are dyed purple and the cytoplasm and
other structures are dyed in pink color. The diffi-
culty in defining patterns can lead to inconsistencies
in the diagnosis, causing a divergence rate ranging
between 19% and 38% (M
¨
uller, 2018). The devel-
opment of computer-aided diagnosis (CAD) systems
can help pathologists in tissue analysis and reduce er-
rors caused by subjectivity (He et al., 2022).
In CAD systems, different computational algo-
rithms are employed for image classification. These
algorithms are employed at various stages, includ-
ing preprocessing, feature extraction, and classifica-
tion (Ribeiro et al., 2018). One of the approaches
applied during the preprocessing step is color normal-
ization. This technique is relevant to reduce variations
in H&E stain colors caused by differences in digiti-
zation systems or variations in the concentration of
a staining solution (Tosta et al., 2023). These color
variations can significantly reduce the performance of
CAD techniques. Thus, investigating the impact of
H&E normalization on the classification of dysplasia
images remains an ongoing challenge.
In the feature extraction stage, numerous methods
can be found in the literature, including fractal dimen-
sions, entropy, co-occurrence matrix and deep learn-
ing models. However, it is not possible to define a
universal approach that provides relevant results for
any type of image. As a result, it is necessary to in-
vestigate the performance of these methods in differ-
ent types of applications. In recent years, the use of
fractal features, derived from the concepts of fractal
geometry, has shown relevant results in the classifi-
cation of histological images (Roberto et al., 2021a;
Martins et al., 2021; Ribeiro et al., 2019).
Fractal geometry (FG) is a way to describe the
texture of a surface (Morrison, 1975). From ap-
proaches based on FG, it is possible to explore de-
scriptors that are invariant to the scale and rotation of
visual elements present in different image types. The
main descriptors that can be extracted through FG are
the fractal dimension (FD), lacunarity (LAC) and per-
colation (PERC). The DF descriptor is used to mea-
sure the irregularity and complexity of a fractal. The
LAC metric indicates how the space is filled, while
PERC describes properties related to the presence,
size and amount of clusters present within the images.
These descriptors have presented relevant results in
the analysis of histopathological images (Ivanovici
et al., 2009). FG descriptors provide a feature vec-
tor of high dimensionality, as they encompass local
attributes for image regions and global attributes for
the entire image. These features can be investigated
via CNN classification, transforming the 1D descrip-
tor sets into 2D matrices (images).
Among these strategies, the sequential representa-
tion (SR) (Lumini and Nanni, 2018) and the recur-
rence plot (RP) (Eckmann et al., 1995) have been
used for histological images (Roberto et al., 2017).
In recent years, many studies have investigated histo-
logical images through convolutional neural networks
(CNN) (Roberto et al., 2017). Other studies have in-
vestigated the use of engineering-based descriptors,
such as coefficients and heatmaps obtained by wavelet
transforms along with CNNs for lesion classifica-
tion (Hu et al., 2023). The use of strategies based
on 2D matrices from FG attributes is still a challenge
for the classification of dysplasia levels in oral cavity
histological tissues.
This paper presents an ensemble-based model to
classify histological dysplasia lesions of the oral cav-
ity using FG images. The FG features were reshaped
to generate 2D matrices, which were given as input
to CNN models composed of the ResNet-50 and Ef-
ficientNet models. The results obtained from these
CNN models were employed in the ensemble model
for lesion classification. Thus, this study provides the
following contributions:
• An investigation of the H&E stain normalization
stage for the classification of oral epithelial dys-
plasia tissues;
• Evaluation of the use of fractal attributes in a com-
putational method for classifying oral cavity his-
tological tissue images;
• Development of an ensemble approach based on
FG with reshaping techniques and CNN models to
classify histological tissues from the oral cavity;
2 METHODOLOGY
The proposed method is represented in Figure 1
where the first step (2D Texture Image Stage) em-
ployed the FG feature extraction and the reshaping
techniques to compute the 2D representation matri-
ces. For the classification step, the 2D representa-
tion matrix was employed as an input of CNN models
with 10-fold cross-validation. Finally, an ensemble
method was used to combine the classification of the
CNN with different image inputs.
Oral Dysplasia Classification by Using Fractal Representation Images and Convolutional Neural Networks
525
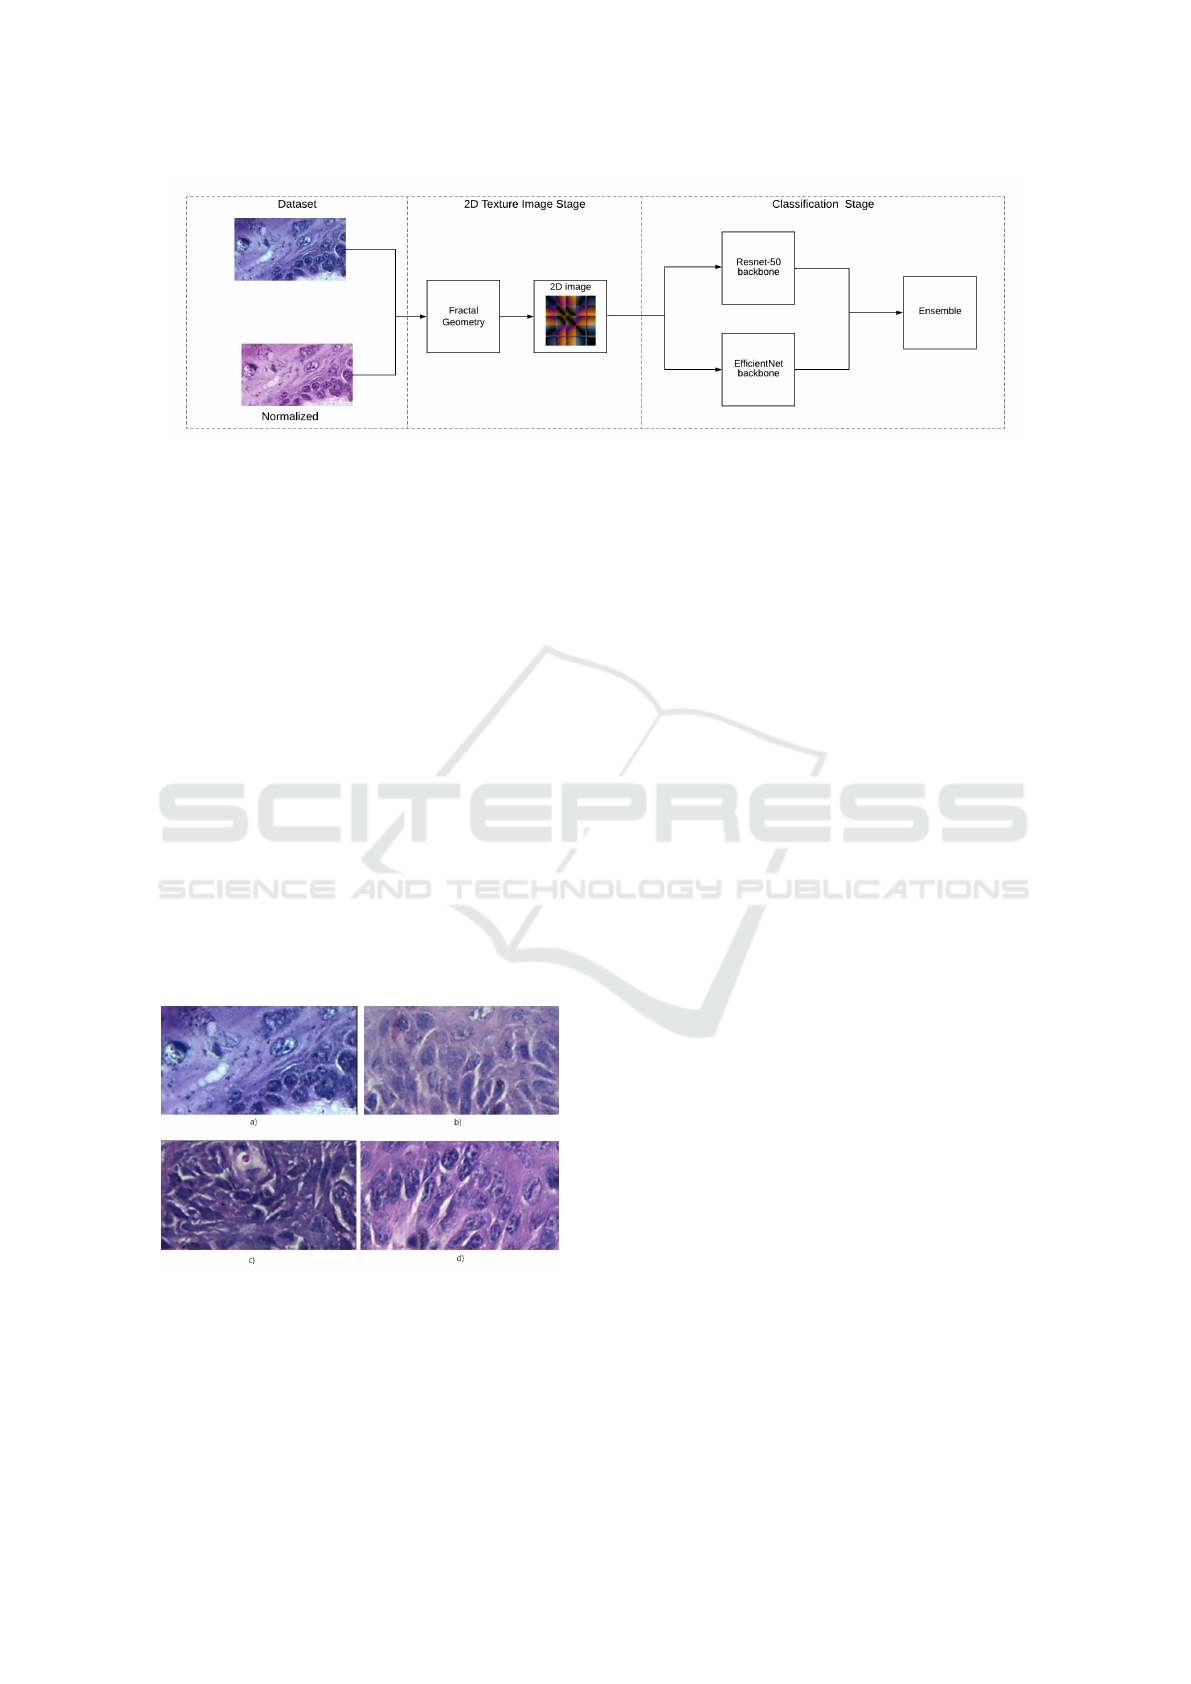
Figure 1: Overview of the proposed approach based on CNN ensemble, FG features, and reshaping procedures for classifica-
tion of dysplasia of oral cavity tissues.
2.1 Image Dataset
This study used an image dataset that consists of mi-
croscopic images of 30 H&E-stained mice tongue
tissue sections previously submitted to a carcino-
gen (Silva et al., 2022a). The tongues were pro-
cessed and embedded in paraffin to create the blocks,
which were sectioned and stained with hematoxylin
and eosin (H&E) for histopathological study. Us-
ing the methodology described by (Lumerman et al.,
1995), the images were classified among healthy mu-
cosa and the mild, moderate and severe dysplasias by
one specialist.
The histological slides were digitized using the
Leica DM500 optical microscope with 400× mag-
nification, resulting in 66 images stored in TIFF file
format, using the RGB color model with an 8-byte
quantization. From these images, 74 regions of in-
terest (ROIs) sized at 450× 250 pixels were obtained
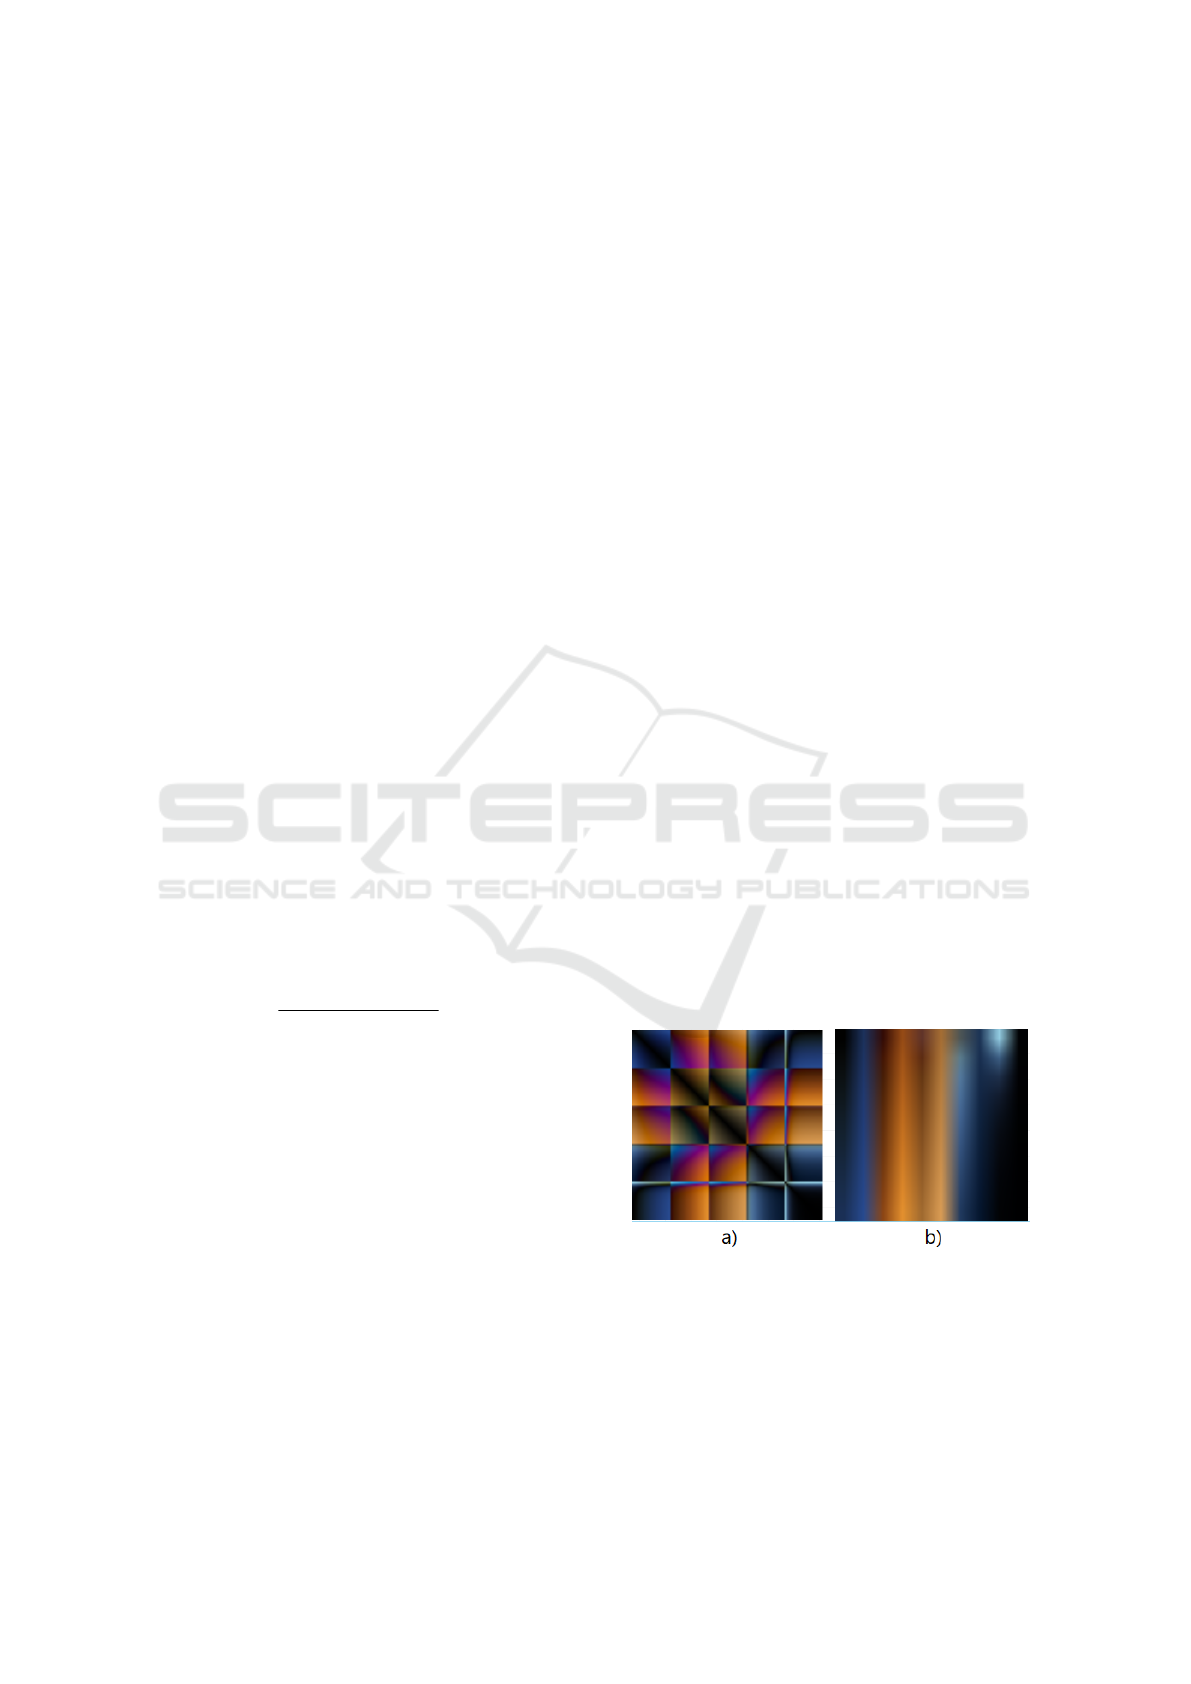
for each class, totaling 296 ROI images. Examples of
these ROIs are displayed in Figure 2.
Figure 2: Examples of histological tissues from the oral
cavity: (a) healthy tissue, (b) mild dysplasia, (c) moderate
dysplasia, and (d) severe dysplasia.
2.2 Normalization
The process employed in the staining of tissue histo-
logical has a significant influence on color variations
or the use of different scanners (Ribeiro et al., 2018).
Then, the influence of these variations on color and
texture features can reduce the effectiveness of pro-
cessing image techniques employed during the classi-
fication of the histological tissues.
In this work, the normalization technique de-
scribed by Tosta et al. (Tosta et al., 2023) was applied
to compare the influence of color normalization in the
process of classification in dysplasia images. Thus,
this investigation considered a stain color normaliza-
tion with a robust dictionary learning method where
the estimation of color appearance matrices and stain
density maps were applied to the normalization of the
H&E histological images. The method considered
pixel selection and weight definition to improve the
color estimation of histological images.
2.3 2D Texture Image Stage
In this step, the gliding box algorithm was consid-
ered with three different distances to extract the fea-
ture vectors. Thus, the attribute vector was reshaped
from a 1D to a 2D matrix using representation mod-
els based on a sequential image and a recurrence plot
image (2D texture image).
2.3.1 Fractal Feature
FG allows quantifying an object about the invariance
of its shape when its scale is changed, keeping its
structure identical to the original. In digital images,
this concept is used to observe self-similarity prop-
erties, when a portion of the image can be seen as a
replica of everything, on a smaller scale. Among the
different algorithms for calculating the self-similarity
properties, due to its efficiency, the gliding-box algo-
rithm stands out (Tolle et al., 2008). This algorithm
VISAPP 2024 - 19th International Conference on Computer Vision Theory and Applications
526
proposes to divide the images into different scales and
then extract information from each sub-image, gen-
erating local and global descriptors. Based on this
approach, features obtained with the FD, LAC, and
PERC metrics have been successfully used in histo-
logical tissue analysis (Roberto et al., 2017).
The gliding box algorithm consists of a multiscale
analysis where a square box of size L×L in the upper
left corner of the image, where L represents the size
of the square box under pixels, in order to slide from
left to right to the bottom region of the image, passing
through all pixels. The box moves through the whole
image, pixel by pixel, and the value of L is increased
after reaching the end line or column. After sliding
across the entire image, the box is repositioned at the
starting point and the value of L is incremented by two
units.
In each box, a color similarity analysis was per-
formed for each pixel in the square box. This analysis
was performed by fixing the central pixel and assign-
ing it to a vector f
c
= (r
c
, g
c
, b
c
), which r
c
, g
c
and b
c
correspond to the intensity of each of the color chan-
nels considering images in RGB color model. The
remaining pixels of the box, f
i
= (r
i
, g
i
, b
i
) were
compared to the central by calculating a color dis-
tance ∆, which allows verifying which pixels belong
to the RGB hyperspace obtained by the central pixel
of the box (Ivanovici et al., 2009). In this work,
the Minkowski (∆
mink
), Euclidean (∆
eucl
) and Man-
hattan (∆
manh
) distances were computed according to
the Equations 1-3:
∆
mink
= max(
|
f
i
(k
i
) − f
c
(k
c
)
|
), k ∈ r, g, b. (1)
∆
eucl
=
s
∑
k
f
i
(k
i
) − f
c
(k
c
)
2
, k ∈ r, g, b. (2)
∆
manh
=
∑
k
|
f
i
(k
i
) − f
c
(k
c
)
|
, k ∈ r, g, b. (3)
When the ∆ value is less than or equal to the scale
L, then f
i
is labeled 1, otherwise, it is labeled 0. Af-
ter calculating the number of pixels that satisfy ∆, for
each box and different values of L, the information
obtained was used to build a probability matrix. In
this matrix, each element corresponds to the probabil-
ity that pixels on a L scale are labeled 1. Finally, this
matrix was normalized so that the sum of all elements
in a column equals 1. This matrix resulted in the local
and global values of the FD, LAC, and PERC metrics
as described in (Roberto et al., 2021a) and (Ribeiro
et al., 2019).
In this work, the use of the gliding box algo-
rithm in multi-resolution allowed obtaining informa-
tion in boxes of size 3 to 41, because these values have
demonstrated relevant results in classification as pre-
sented in (Ribeiro et al., 2019). Then, a local fractal
feature vector was obtained with 100 features for each
∆ parameter.
2.3.2 Reshaping Procedure
In order to generate a 2D representation matrix to
be given as input to a CNN, two different reshaping
procedures, the sequential reshape (SR) and recur-
rence plot (RP) methods were applied to the set of
the 300 local fractal features obtained with 100 val-
ues of each ∆. The SR reshaping procedure is sim-
ilar to the model employed in the study of (Roberto
et al., 2021b), where a simple reshape was obtained
of a 10 × 10 × 3 matrix. The features were extracted
and organized in a sequential arrangement obtained
of ∆
mink
, ∆
eucl
and ∆
manh
correspond to the red, green,
and blue color channels, respectively. The RP reshap-
ing procedure is a technique proposed in (Eckmann
et al., 1995) for the projection of repeated events into
two or three-dimensional spaces. The application of
this technique on a feature vector containing N feature
output a squared matrix N × N wherein each element
R
i, j
of the matrix was obtained by the Equation 4:
R
i, j
=
x
i
− x
j
∀ i, j = 1...N. (4)
where x
i
and x
j
are the i
th
and j
th
features in the vec-
tor, and
x
i
− x
j
is the norm of the euclidean dis-
tance.
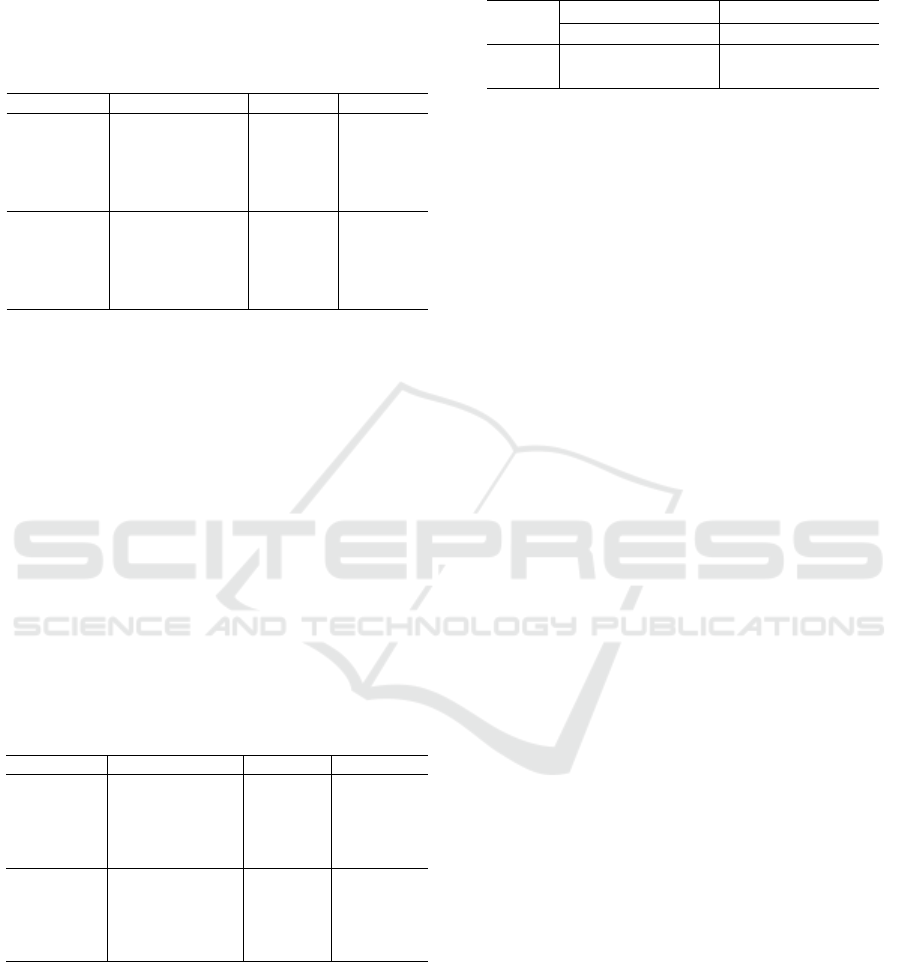
Figure 3 shows the images obtained of the reshap-
ing procedures of a healthy histological tissue digital
image.
Figure 3: The reshaping methods from a healthy tissue im-
age: (a) RP and (b) SR.
2.4 Classification Stage
For the classification step, the 2D representations
were employed as an input of CNN models with 10-
fold cross-validation where 90% of the dataset was
Oral Dysplasia Classification by Using Fractal Representation Images and Convolutional Neural Networks
527

used for model training and 10% for test. An ensem-
ble method was used to combine the classification of
the CNN with different images.
2.4.1 CNN Models
The CNN models are among the most powerful
tools for the analysis of digital images. The pro-
posed model combined strategies capable of extract-
ing features and classifying data based on a super-
vised method (LeCun et al., 1998). In this work, the
ResNet-50 (He et al., 2015) and EfficientNet (Tan and
Le, 2019) models were applied to classifier the rep-
resentation model. In order to use both datasets in
the CNNs models, the input images were resized to
224×224 pixels to fit them to both models. In the
training stage of each network, the representation im-
ages obtained after reshaping the local fractal features
were used with a 10-fold cross-validation technique.
In each training fold (90%), 30% of the set was used
as the validation set and the remaining 10% was used
as a test set. The training was made with 10 epochs
and 5 iterations per epoch with an initial learn rate of
0.01, the piecewise function as the learn rate sched-
ule and with 2 as the learn rate drop period, which
updates the learning rate every 2 epochs.
In order to reduce the training time of CNN and
obtain promising results with a smaller number of
epochs, the transfer learning strategy was adopted to
decrease the evaluation time of a model without pre-
setting the weights. The transfer learning model em-
ployed in this work was the network-based transfer,
in which the parameters of the first CNN layers are
set from a model-trained network. This approach ex-
plored a specific weight adjustment strategy, select-
ing partial instances from the source domain as sup-
plements to the defined training nested in the target
domain. In this work, the last fully connected layer
and the classification layer for both CNN models were
adapted based on the dataset groups.
2.4.2 Ensemble Strategy
With the results obtained from the probabilities of oc-
currence of each class, using the output of the softmax
layer of each CNN, an ensemble model was employed
to classify the data. The use of an ensemble model
is among the most successful approaches in machine
learning applications in recent years, due to its abil-
ity to train different models and combine their pre-
dictions, with relevant results obtained in histopathol-
ogy (Kassani et al., 2019).
Among the several ensemble techniques, simple
averaging is a widely used combination technique in
classification problems with CNN models. In this
strategy, the final decision was obtained by averaging
the results of individual models (Zhou, 2012). Then,
the sample is classified according to the highest class
probability after calculating the average of the proba-
bility curve of each model (see Equation 5).
A(x) =
1
N
N
∑
i=1
a
i
(x), (5)
where A(x) is the final result, N is the number of mod-
els and a
i
(x) is the output generated by the i-th model.
2.5 Experimental Evaluation
For the evaluation of the proposed approach, the fol-
lowing strategies were investigated:
• Strategy 1 - (named CNN baseline): each CNN
model was evaluated with the images from the
dataset;
• Strategy 2 - (named CNN SR); each CNN model
applied with the SR representation images;
• Strategy 3 - (named CNN RP): each CNN model
applied with the RP representation images;
• Strategy 4 - (named SR + RP); an ensemble based
in the SR and RP representation images;
• Strategy 5 (named CNN baseline + SR + RP): an
ensemble based in the SR and RP representation
images with the CNN baseline;
The evaluation of the proposed methods was car-
ried out by comparing the results obtained with the
gold standard classification carried out by the special-
ist, in which the metrics of accuracy (A
CC
) and F1-
score were obtained.
3 EXPERIMENTAL RESULTS
Tables 1 and 2 show the average A
CC
and F1-score
values obtained with the investigated strategies using
both CNN models over the non-normalized and the
normalized datasets, respectively. From the results
presented in Table 1, it is observed that the ResNet-
50 baseline achieved higher A
CC
and F1-score val-
ues than the EfficientNet baseline, but it also shows a
higher standard deviation. For both CNN models, the
reshaping strategies allowed an improvement on the
results, showing higher metric values and lower stan-
dard deviation than the baselines, with the ResNet-50
achieving 97.3% and 94.5% for the metrics of A
CC
and F1-score, respectively. When using the ensemble
methods, Strategies 4 and 5 allowed an increase on
result values for the ResNet-50, but, for the Efficient-
Net, only Strategy 5 showed the same behavior. On
VISAPP 2024 - 19th International Conference on Computer Vision Theory and Applications
528
this experimental test, the highest values were 98.5%
and 96.8% for the A
CC
and F1-score, respectively, us-
ing the ResNet-50 in combination with Strategy 5.
Table 1: Results obtained with proposed classification ap-
proaches on the dataset with the healthy, mild, moderate,
and severe images.
Model Strategy A
CC
F1-score
ResNet50
Baseline 90.5 ± 4.4 80.6 ± 9.0
SR 96.9 ± 2.7 93.8 ± 5.5
RP 97.3 ± 2.7 94.5 ± 5.5
SR+RP 98.1 ± 2.5 96.1 ± 5.2
Baseline+SR+RP 98.5 ± 2.2 96.8 ± 4.6
EfficientNet
Baseline 89.5 ± 3.5 78.6 ± 7.5
SR 96.6 ± 2.7 92.2 ± 5.1
RP 96.1 ± 2.5 93.1 ± 5.6
SR+RP 96.1 ± 2.4 92.1 ± 5.1
Baseline+SR+RP 97.3 ± 2.4 94.5 ± 4.9
The classification results on the normalized
dataset are presented in Table 2. The normalization
showed no significant difference on the results from
the ResNet-50 baseline but showed lower values for
the reshaping and ensemble strategies. The same
behavior was observed for the EfficientNet model,
which showed decrease rates ranging from 0.8% to
4.5% and 2.1% to 8.5% for the metrics of A
CC
and
F1-score, respectively. From the results presented on
this table, it was observed that the normalization stage
played no significant role on the classification stage.
However, for both CNN models and datasets, the use
of reshaping techniques allowed higher classification
results than the baseline and even further improve-
ment when using ensemble methods.
Table 2: Performance of proposed classification methods on
the normalized image dataset with the healthy, mild, mod-
erate, and severe images.
Model Strategy A
CC
F1-score
ResNet50
Baseline 90.5 ± 4.0 80.3 ±8.9
SR 94.8 ± 3.8 89.5 ±7.6
RP 95.9 ± 3.3 91.7 ±6.6
SR+RP 96.6 ± 2.9 93.2 ±5.8
Baseline+SR+RP 97.5 ± 2.6 94.9 ± 5.2
EfficientNet
Baseline 88.7 ± 5.0 76.5 ± 10.6
SR 92.1 ± 3.3 83.7 ±7.0
RP 93.9 ± 4.6 87.7 ±9.0
SR+RP 93.8 ± 3.3 87.2 ±6.7
Baseline+SR+RP 95.8 ± 2.5 91.4 ± 4.0
Since the results presented on Tables 1 and 2 indi-
cates that the best result were obtained by ResNet-50
on the non-normalized dataset, the Wilcoxon test was
performed to assess its statistical relevance compared
to the EfficientNet model and the normalized dataset.
The test was employed with a significance level of
5% and the obtained p-values are shown in Table 3.
All comparisons showed p-values higher than 0.05,
meaning that there’s no statistically significant differ-
Table 3: P-values obtained using the Wilcoxon test for com-
paring the non-normalized ResNet-50 model with the other
approaches.
Metric
Original dataset Normalized dataset
ResNet EfficientNet ResNet EfficientNet
A
CC
- 0.17 0.23 0.09
F1-score - 0.16 0.22 0.09
ence between the methods. It is noted that the Effi-
cientNet model presented p-values of 0.09, represent-
ing the most different results compared to the non-
normalized ResNet-50 approach.
Table 4 depicts the obtained A
CC
values for each
dysplasia class using both models and strategies on
the original image data since it presented the best re-
sults. The healthy and severe classes presented higher
values than the Mild and Moderate. However, this
difference is minimized with the use of reshaping and
ensemble strategies. The ResNet-50 with strategies 4
and 5 showed A
CC
of 99% and 100% for the Severe
Moderate classes, respectively. The values shown by
EfficientNet using the same strategies were slightly
lower.
Table 5 presents an overview of the obtained re-
sults about those provided by relevant computer vi-
sion methods developed to study histopathological
images of the oral cavity. It is important to high-
light that the studies by (Amin et al., 2021) and (Deif
et al., 2022) were developed to distinguish healthy tis-
sues from lesions in advanced stages. It is also noted
that the study presented by (Adel et al., 2018) in-
vestigated OED images, but no assessment regarding
their grades was proposed. The (Silva et al., 2022b)
and (Silva et al., 2022a) studies investigated the clas-
sification of lesions and the degree of dysplasia and
the proposed solution is a new approach to classifica-
tion. Considering these results, the proposed method-
ology provided values compatible with those avail-
able in the literature, achieving significant results for
the automatic grading task, especially via associa-
tion of fractal features, reshape approaches and CNN
models.
4 CONCLUSIONS
This study presented an approach for oral dysplasia
grading based on fractal features in combination with
reshaping techniques and CNN models. Ensemble
strategies were also employed to further improve the
classification results. The proposed reshaping and en-
semble methodology allowed an increase in the clas-
sification results, with the ResNet-50 using the en-
semble of all reshaping strategies providing an A
CC
value of 98.5.
Oral Dysplasia Classification by Using Fractal Representation Images and Convolutional Neural Networks
529
Table 4: Accuracy results for each dysplasia grade on the non-normalized dataset for both CNN models.
CNN Tissue Baseline SR RP SR + RP Baseline + SR + RP
ResNet50
Healthy 91.5 ± 6.9 95.6 ± 4.3 96.6 ± 3.6 96.9 ± 3.8 97.9 ± 2.9
Mild 87.2 ± 4.9 94.9 ± 5.7 94.5 ± 5.5 96.2 ± 5.0 96.9 ± 4.4
Moderate 85.8 ± 8.1 98.3 ± 2.9 97.9 ± 2.4 99.3 ± 1.5 99.0 ± 2.3
Severe 97.6 ± 4.3 99.0 ± 2.3 100.0 ± 0.0 100.0 ± 0.0 100.0 ± 0.0
EfficientNet
Healthy 90.9 ± 7.2 93.9 ± 4.4 94.9 ± 4.6 94.3 ± 4.3 95.9 ± 3.8
Mild 83.5 ± 6.0 92.2 ± 5.1 93.6 ± 5.7 92.6 ± 5.3 94.6 ± 4.9
Moderate 86.5 ± 5.0 98.6 ± 2.4 98.6 ± 2.4 98.3 ± 2.4 99.0 ± 2.3
Severe 97.3 ± 4.2 99.7 ± 1.1 99.3 ± 1.5 99.3 ± 1.5 99.7 ± 1.1
Table 5: Assessment of the proposed methodology in relation to existing approaches for oral image classification present in
the literature.
Study Lesion Type Feature Extraction Classifier A
CC
(Adel et al., 2018) Oral Dysplasia ORB SVM 92.6
(Amin et al., 2021) Squamous Cell Carcinoma Deep features CNN 96.6
(Deif et al., 2022) Squamous Cell Carcinoma Deep features XGBoost 96.3
(Silva et al., 2022b) Oral Dysplasia Texture and morphology features HOP 92.4
(Silva et al., 2022a) Oral Dysplasia Deep features HOP 98.0
Proposed Method Oral Dysplasia Fractal features and reshape Ensemble CNN 98.5
Experimental tests indicated that the use of nor-
malization does not bring any effective gains to the
classification task. However, regardless of the dataset
or CNN model, the reshaping strategies increased the
result values and the ensemble techniques allowed
further improvements of them.
The obtained results were comparable to those
present in the literature, showing A
CC
significantly
higher than four of the presented studies. The pro-
posed methodology can be used as an automated tool
to aid specialists during the histological analysis of
oral dysplasia lesions. In future works, other reshap-
ing techniques will be investigated, such as the Self-
similarity matrix and Markov transition field meth-
ods, and other CNN models will be explored for the
classification task.
ACKNOWLEDGMENT
This study was financed in part by the Coordenac¸
˜
ao
de Aperfeic¸oamento de Pessoal de N
´
ıvel Supe-
rior - Brasil (CAPES) - Finance Code 001. The
authors gratefully acknowledge the financial sup-
port of National Council for Scientific and Techno-
logical Development CNPq (Grants #313643/2021-
0, #311404/2021-9 and #307318/2022-2), the State
of Minas Gerais Research Foundation - FAPEMIG
(Grant #APQ-00578-18 and Grant #APQ-01129-21)
and S
˜
ao Paulo Research Foundation - FAPESP (Grant
#2022/03020-1).
REFERENCES
Adel, D., Mounir, J., El-Shafey, M., Eldin, Y. A., El Masry,
N., AbdelRaouf, A., and Abd Elhamid, I. S. (2018).
Oral epithelial dysplasia computer aided diagnostic
approach. In 2018 13th International Conference on
Computer Engineering and Systems (ICCES), pages
313–318. IEEE.
Amin, I., Zamir, H., and Khan, F. F. (2021). Histopatholog-
ical image analysis for oral squamous cell carcinoma
classification using concatenated deep learning mod-
els. medRxiv, pages 2021–05.
Deif, M. A., Attar, H., Amer, A., Elhaty, I. A., Khosravi,
M. R., Solyman, A. A., et al. (2022). Diagnosis of oral
squamous cell carcinoma using deep neural networks
and binary particle swarm optimization on histopatho-
logical images: an aiomt approach. Computational
Intelligence and Neuroscience, 2022.
Eckmann, J.-P., Kamphorst, S. O., Ruelle, D., et al. (1995).
Recurrence plots of dynamical systems. World Sci-
entific Series on Nonlinear Science Series A, 16:441–
446.
He, K., Zhang, X., Ren, S., and Sun, J. (2015). Deep
residual learning for image recognition. CoRR,
abs/1512.03385.
He, W., Han, Y., Ming, W., Du, J., Liu, Y., Yang, Y., Wang,
L., Wang, Y., Jiang, Z., Cao, C., et al. (2022). Progress
of machine vision in the detection of cancer cells in
histopathology. IEEE Access, 10:46753–46771.
Hu, K., Tan, H., Zhang, Y., Huang, W., and Gao, X. (2023).
Mwg-net: Multi-scale wavelet guidance network for
covid-19 lung infection segmentation from ct images.
IEEE Transactions on Instrumentation and Measure-
ment.
VISAPP 2024 - 19th International Conference on Computer Vision Theory and Applications
530

Ivanovici, M., Richard, N., and Decean, H. (2009). Fractal
dimension and lacunarity of psoriatic lesions-a colour
approach. medicine, 6(4):7.
Kassani, S. H., Kassani, P. H., Wesolowski, M. J., Schnei-
der, K. A., and Deters, R. (2019). Classification of
histopathological biopsy images using ensemble of
deep learning networks. In Proceedings of the 29th
Annual International Conference on Computer Sci-
ence and Software Engineering, pages 92–99.
LeCun, Y., Bottou, L., Bengio, Y., and Haffner, P. (1998).
Gradient-based learning applied to document recogni-
tion. Proceedings of the IEEE, 86(11):2278–2324.
Lumerman, H., Freedman, P., and Kerpel, S. (1995). Oral
epithelial dysplasia and the development of inva-
sive squamous cell carcinoma. Oral Surgery, Oral
Medicine, Oral Pathology, Oral Radiology, and En-
dodontology, 79(3):321–329.
Lumini, A. and Nanni, L. (2018). Convolutional neural net-
works for atc classification. Current pharmaceutical
design, 24(34):4007–4012.
Martins, A. S., Neves, L. A., de Faria, P. R., Tosta, T. A.,
Longo, L. C., Silva, A. B., Roberto, G. F., and
do Nascimento, M. Z. (2021). A hermite polynomial
algorithm for detection of lesions in lymphoma im-
ages. Pattern Analysis and Applications, 24:523–535.
Morrison, P. (1975). Les objets fractals: Forme, hasard et
dimension.
M
¨
uller, S. (2018). Oral epithelial dysplasia, atypical verru-
cous lesions and oral potentially malignant disorders:
focus on histopathology. Oral surgery, oral medicine,
oral pathology and oral radiology, 125(6):591–602.
Pires, F. R., Ramos, A. B., Oliveira, J. B. C. d., Tavares,
A. S., Luz, P. S. R. d., and Santos, T. C. R. B. d.
(2013). Oral squamous cell carcinoma: clinicopatho-
logical features from 346 cases from a single oral
pathology service during an 8-year period. Journal
of Applied Oral Science, 21:460–467.
Ribeiro, M. G., Neves, L. A., do Nascimento, M. Z.,
Roberto, G. F., Martins, A. S., and Tosta, T. A. A.
(2019). Classification of colorectal cancer based on
the association of multidimensional and multireso-
lution features. Expert Systems with Applications,
120:262–278.
Ribeiro, M. G., Neves, L. A., Roberto, G. F., Tosta, T. A.,
Martins, A. S., and Do Nascimento, M. Z. (2018).
Analysis of the influence of color normalization in the
classification of non-hodgkin lymphoma images. In
2018 31st SIBGRAPI Conference on Graphics, Pat-
terns and Images (SIBGRAPI), pages 369–376. IEEE.
Roberto, G. F. et al. (2021a). Associac¸
˜
ao entre atributos
manuais e aprendizado profundo baseada em geome-
tria fractal para classificac¸
˜
ao de imagens histol
´
ogicas.
Roberto, G. F., Lumini, A., Neves, L. A., and do Nasci-
mento, M. Z. (2021b). Fractal neural network: A new
ensemble of fractal geometry and convolutional neu-
ral networks for the classification of histology images.
Expert Systems with Applications, 166:114103.
Roberto, G. F., Neves, L. A., Nascimento, M. Z., Tosta,
T. A., Longo, L. C., Martins, A. S., and Faria, P. R.
(2017). Features based on the percolation theory for
quantification of non-hodgkin lymphomas. Comput-
ers in biology and medicine, 91:135–147.
Sagheer, S. H., Whitaker-Menezes, D., Han, J. Y., Curry,
J. M., Martinez-Outschoorn, U., and Philp, N. J.
(2021). Chapter 6 - 4nqo induced carcinogenesis:
A mouse model for oral squamous cell carcinoma.
In Galluzzi, L. and Buqu
´
e, A., editors, Carcinogen-
driven mouse models of oncogenesis, volume 163 of
Methods in Cell Biology, pages 93–111. Academic
Press.
Silva, A. B., De Oliveira, C. I., Pereira, D. C., Tosta,
T. A., Martins, A. S., Loyola, A. M., Cardoso, S. V.,
De Faria, P. R., Neves, L. A., and Do Nascimento,
M. Z. (2022a). Assessment of the association of deep
features with a polynomial algorithm for automated
oral epithelial dysplasia grading. In 2022 35th SIB-
GRAPI Conference on Graphics, Patterns and Images
(SIBGRAPI), volume 1, pages 264–269. IEEE.
Silva, A. B., Martins, A. S., Tosta, T. A. A., Neves, L. A.,
Servato, J. P. S., de Ara
´
ujo, M. S., de Faria, P. R.,
and do Nascimento, M. Z. (2022b). Computational
analysis of histological images from hematoxylin and
eosin-stained oral epithelial dysplasia tissue sections.
Expert Systems with Applications, 193:116456.
Smith, J., Rattay, T., McConkey, C., Helliwell, T., and
Mehanna, H. (2009). Biomarkers in dysplasia of
the oral cavity: a systematic review. Oral oncology,
45(8):647–653.
Tan, M. and Le, Q. (2019). Efficientnet: Rethinking model
scaling for convolutional neural networks. In Interna-
tional conference on machine learning, pages 6105–
6114. PMLR.
Tolle, C. R., McJunkin, T. R., and Gorsich, D. J. (2008).
An efficient implementation of the gliding box lacu-
narity algorithm. Physica D: Nonlinear Phenomena,
237(3):306–315.
Tosta, T. A. A., Freitas, A. D., de Faria, P. R., Neves,
L. A., Martins, A. S., and do Nascimento, M. Z.
(2023). A stain color normalization with robust dic-
tionary learning for breast cancer histological images
processing. Biomedical Signal Processing and Con-
trol, 85:104978.
Warnakulasuriya, S., Reibel, J., Bouquot, J., and Dabel-
steen, E. (2008). Oral epithelial dysplasia classifica-
tion systems: predictive value, utility, weaknesses and
scope for improvement. Journal of Oral Pathology &
Medicine, 37(3):127–133.
Zhou, Z.-H. (2012). Ensemble methods: foundations and
algorithms. CRC press.
Oral Dysplasia Classification by Using Fractal Representation Images and Convolutional Neural Networks
531
