
Investigation of Deep Neural Network Compression Based on Tucker
Decomposition for the Classification of Lesions in Cavity Oral
Vitor B. L. Fernandes
1 a
, Adriano B. Silva
1 b
, Danilo C. Pereira
1 c
, S
´
ergio V. Cardoso
2 d
,
Paulo R. de Faria
3 e
, Adriano M. Loyola
2 f
, Tha
´
ına A. A. Tosta
4 g
, Leandro A. Neves
5 h
and Marcelo Z. do Nascimento
1 i
1
Faculty of Computer Science, Federal University of Uberl
ˆ
andia, Brazil
2
Area of Oral Pathology, School of Dentistry, Federal University of Uberl
ˆ
andia, Brazil
3
Department of Histology and Morphology, Institute of Biomedical Science, Federal University of Uberl
ˆ
andia, Brazil
4
Science and Technology Institute, Federal University of S
˜
ao Paulo, Brazil
5
Department of Computer Science and Statistics (DCCE), S
˜
ao Paulo State University, Brazil
Keywords:
Oral Epithelial Dysplasia, Convolutional Neural Network, Tensors, Histological Image, Classifier, Tucker
Decomposition.
Abstract:
Cancer in the oral cavity is one of the most common, making it necessary to investigate lesions that could
develop into cancer. Initial stage lesions, called dysplasia, can develop into more severe stages of the disease
and are characterized by variations in the shape and size of the nucleus of epithelial tissue cells. Due to
advances in the areas of digital image processing and artificial intelligence, diagnostic aid systems (CAD)
have become a tool to help reduce the difficulties of analyzing and classifying lesions. This paper presents
an investigation of the Tucker decomposition in tensors for different CNN models to classify dysplasia in
histological images of the oral cavity. In addition to the Tucker decomposition, this study investigates the
normalization of H&E dyes on the optimized CNN models to evaluate the behavior of the architectures in the
classification stage of dysplasia lesions. The results show that for some of the optimized models, the use of
normalization contributed to the performance of the CNNs for classifying dysplasia lesions. However, when
the features obtained from the final layers of the CNNs associated with the machine learning algorithms were
analyzed, it was noted that the normalization process affected performance during classification.
1 INTRODUCTION
Oral cavity cancer is one type common accounting
for almost 50% of cases in the head and neck re-
gion (Wild et al., 2020). This highlights the impor-
tance of investigating lesions that may develop into
cancer. One of such lesions, known as dysplasia, is
characterized by changes in the shape and size of the
nuclei of epithelial cells (Kumar et al., 2009).
a
https://orcid.org/0009-0007-8230-8779
b
https://orcid.org/0000-0001-8999-1135
c
https://orcid.org/0000-0002-2694-4865
d
https://orcid.org/0000-0003-1809-0617
e
https://orcid.org/0000-0003-2650-3960
f
https://orcid.org/0000-0001-9707-9365
g
https://orcid.org/0000-0002-9291-8892
h
https://orcid.org/0000-0001-8580-7054
i
https://orcid.org/0000-0003-3537-0178
With advances in digital image processing and ar-
tificial intelligence, computer-aided diagnosis (CAD)
systems have become increasingly popular and have
reduced the challenges faced by healthcare profes-
sionals during tissue classification (Belsare, 2012).
CAD systems encompass the stages of image en-
hancement, segmentation, feature extraction, and
classification. In (Ferro et al., 2022), the authors
present the machine learning methods addressed for
the implementation of automated detection of poten-
tially malignant and malignant diseases of the oral
cavity. In recent years, these systems adopted deep
learning-based strategies, such as convolutional neu-
ral networks, to improve these stages. Despite their
relevant contributions, these systems are often im-
pacted by over-parameterization. This high number of
parameters can be optimized using tensor decompo-
sition techniques applied to the convolutional layers
516
Fernandes, V., Silva, A., Pereira, D., Cardoso, S., R. de Faria, P., Loyola, A., Tosta, T., Neves, L. and Z. do Nascimento, M.
Investigation of Deep Neural Network Compression Based on Tucker Decomposition for the Classification of Lesions in Cavity Oral.
DOI: 10.5220/0012388700003660
Paper published under CC license (CC BY-NC-ND 4.0)
In Proceedings of the 19th International Joint Conference on Computer Vision, Imaging and Computer Graphics Theory and Applications (VISIGRAPP 2024) - Volume 3: VISAPP, pages
516-523
ISBN: 978-989-758-679-8; ISSN: 2184-4321
Proceedings Copyright © 2024 by SCITEPRESS – Science and Technology Publications, Lda.

kernels, aiming to reduce the total number of param-
eters in the network (Kim et al., 2016). The authors
in (Liu and Ng, 2022) pointed out that further research
is needed to investigate convolutional neural network
(CNN) model compression, in order to reduce param-
eter amount while maintaining the same accuracy as
the original model.
Another factor that can reduce the performance
of classification methods used in CAD systems is re-
lated to the pre-processing stage (Ribeiro et al., 2018).
During the process of obtaining digital histological
images, slides are stained with hematoxylin–eosin
(H&E), in which the hematoxylin dye stains acid
structures in purple and the eosin dye stains the basic
ones in pink (Celis and Romero, 2015a). This process
can present non-uniformity in the distribution of dyes
along the tissue. The use of different fixatives, digiti-
zation equipment, and differences in the slide storage
are examples of factors that lead to color variations
on these images (Tosta et al., 2019a). Therefore, ex-
ploring the impact of H&E dye normalization on his-
tological dysplasia tissues in the context of dysplasia
classification of optimized CNN models remains an
ongoing challenge.
This paper presents an investigation of Tucker de-
composition in tensors of ResNet-18 and ResNet-50
CNN architectures for the classification of dysplasias
in histological images of the oral cavity. Moreover,
this study investigates the normalization of H&E dyes
on optimized models to evaluate their behavior in the
classification stage. At last, the feature extraction
stage was performed in non-normalized and color-
normalized images obtained from the previous convo-
lutional layer to assess the color-normalization impact
on the classification stage using machine learning al-
gorithms. Thus, the main contributions are:
• Study of the Tucker decomposition technique for
use with ResNet architecture tensors for evalua-
tion in the classification of dysplasia lesions;
• Investigation of the impact of color normalization
in dysplasia classification using ResNet model;
• Analysis of the features from the global average
pooling layer, before the fully connected layer of
the ResNet models for, classifying dysplasia le-
sions using machine learning (ML) algorithms.
2 METHODOLOGY
Figure 1 shows the sequence of steps performed to
classify dysplasia lesions on the models investigated.
All the experiments carried out in this work were con-
ducted on a machine with an AMD Ryzen 5 3600XT
processor, GeForce RTX 2070 SUPER graphics card,
and 64GB of RAM.
2.1 Image Dataset
The dataset consists of 30 H&E-stained mice tongue
tissue sections previously submitted to a carcinogen
during two experiments carried out in 2009 and 2010.
These experiments were approved by the Ethics Com-
mittee on the Use of Animals under protocol num-
ber 038/09 at the Federal University of Uberl
ˆ
andia,
Brazil.
The histological slides were digitized using the
Leica DM500 optical microscope with 400× magnifi-
cation. A total of 66 images were obtained and stored
in the TIFF format using the RGB color model with
a resolution of 2048×1536 pixels. Using the method-
ology described by (Lumerman et al., 1995), the im-
ages were classified between healthy and severe OED
images. From the images, 74 ROIs of size 450 ×
250 pixels were obtained for each class. Examples
of these ROIs can be seen in Figure 2.
2.2 H&E Stain Normalization
Color normalization is a process applied at the stage
of image processing aiming to reduce possible color
variations between samples that may arise during the
digitization and staining stages (Sha et al., 2017). In
literature, several techniques are described for color
normalization, such as those proposed by (Vahadane
et al., 2015) and (Tosta et al., 2019b).
In this work, the technique proposed by (Tosta
et al., 2019b) was employed. This technique was de-
veloped specifically to normalize H&E dyed histolog-
ical images. Hematoxylin stains the nuclei with pur-
ple color and eosin colors the cytoplasm and other
extracellular structures as pink (Celis and Romero,
2015b). However, the color obtained in the images
can undergo variations depending on other factors,
such as the way the image was digitized and how the
preparation was performed (Khan et al., 2014; Sethi
et al., 2016).
The adopted approach normalizes the image col-
ors while maintaining the histological structures and
ensuring that no artifacts are introduced (Tosta et al.,
2019b). The method achieves this result with an unsu-
pervised estimate of the sparsity parameter and stain
representation.
2.3 ResNet Architecture
The CNN architectures used in the experiments were
ResNet models. This architecture was proposed
Investigation of Deep Neural Network Compression Based on Tucker Decomposition for the Classification of Lesions in Cavity Oral
517
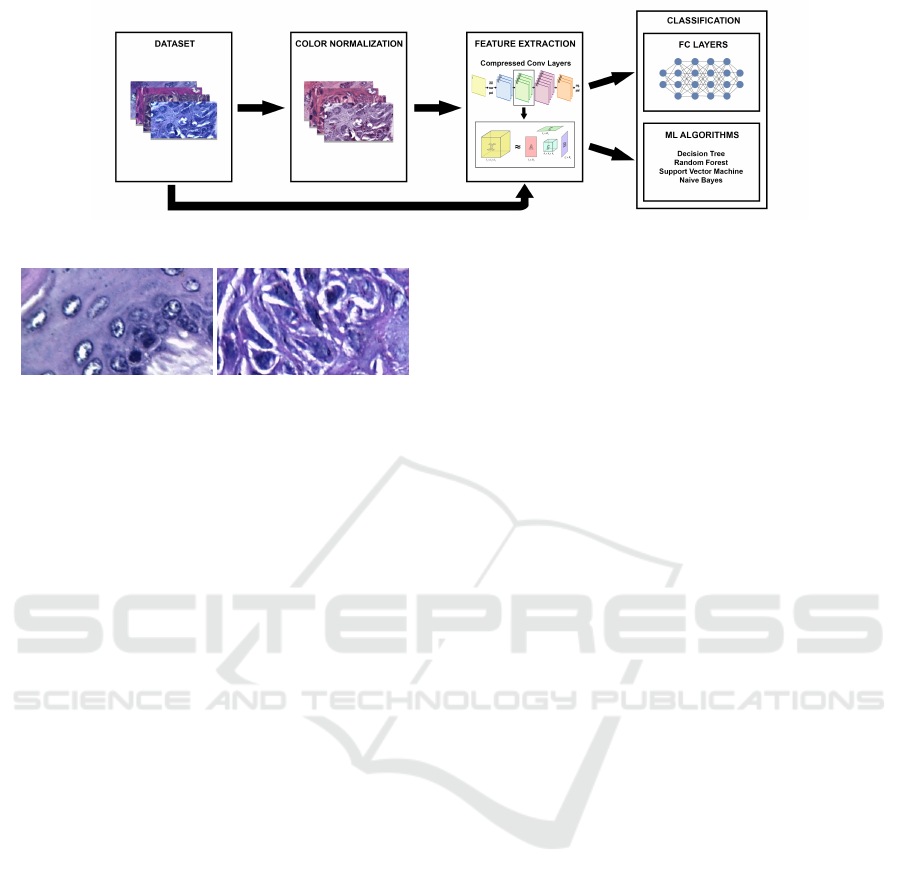
Figure 1: Box diagram of the stages employed for the classification of oral dysplasia tissue images.
(a) (b)
Figure 2: Examples of oral histological tissues: (a) healthy
tissue; (b) severe dysplasia.
in (He et al., 2015) and it is a deep convolutional neu-
ral network model based on the use of the so-called
residual learning. Residual learning consists of skip-
ping one or more layers, keeping the information in-
tact, and then applying it to the output of subsequent
layers. This approach helps to improve the perfor-
mance of the network over many layers by avoiding
the degradation problem that can occur with other ar-
chitectures.
The ResNet architecture is available in different
versions, with different numbers of layers. For this
study’s experiments, ResNet-18 and ResNet-50 mod-
els were chosen, which have 18 and 50 layers, respec-
tively. The choice of this architecture was motivated
by two reasons. The first is that it has been widely
used in other studies of histological images, such
as the classification of images from different body
parts (Talo, 2019), the performance of both ResNet-
18 and ResNet-50 in the classification of colorectal
cancer images (Sarwinda et al., 2021) and research
that proposed the use of ResNet-50 for classification
breast cancer images (Al-Haija and Adebanjo, 2020).
The second reason was due to its structure, which is
mostly composed of convolutional layers. As decom-
position techniques are applied only to convolutional
layer tensors, using a network that has relatively few
parameters in densely connected layers ensures that
the decomposition is more expressive.
2.4 Tucker Decomposition
Tensor is a concept used primarily in computing as a
generalization of a matrix to dimensions greater than
three. A tensor with one dimension is typically called
a vector. A tensor with two dimensions is called a
matrix. From three dimensions, the used term sim-
ply becomes tensor and can refer to an Nth-order ten-
sor, with N being the number of dimensions present
in that tensor (Kolda and Bader, 2009). Tensors play
an important role in several areas of computing, be-
ing mainly used in signal processing techniques, ML,
clustering and dimensionality reduction algorithms,
and data mining (Sidiropoulos et al., 2017).
A tensor of many dimensions can undergo a series
of mathematical transformations to rearrange its for-
mat and result in more than one tensor while main-
taining an approximation of the information con-
tained in the original tensor. This operation is called
low-rank approximation (Kolda and Bader, 2009).
After applying this operation, the resulting tensors
have fewer parameters than the original one, resulting
in a reduction in dimensionality and the total num-
ber of parameters. An approximation of the original
tensor can be obtained from operations applied to the
resulting tensors (Cichocki et al., 2017). The quality
of these approximations is dependent on the rank val-
ues chosen at the decomposition time and, depending
on the situation, lower than ideal values can be used
to achieve greater compression, in which the approx-
imation does not need to be too precise (Kim et al.,
2016).
There are several techniques for tensor de-
composition, with the most popular being CP-
Decomposition and Tucker Decomposition (Kolda
and Bader, 2009). The method chosen for this study
was Tucker Decomposition, which decomposes an n-
dimensional tensor into n+1 matrices, one of which is
a nucleus. The dimensions size of these matrices is
based on the size of the dimensions from the orig-
inal tensor and the value defined as decomposition
rank (Kim et al., 2016).
Equation 1 defines the Tucker decomposition for
a three-dimensional tensor X , whose dimensions have
values I
1
, I
2
and I
3
, therefore X ∈ R
I
1
×I
2
×I
3
, and the
chosen rank values were R
1
, R
2
and R
3
:
X ≈ G ×
1
A ×
2
B ×
3
C (1)
VISAPP 2024 - 19th International Conference on Computer Vision Theory and Applications
518

After the decomposition, three matrices were ob-
tained, A ∈ R
I
1
×R
1
, B ∈ R
I
2
×R
2
, A ∈ R
I
3
×R
3
, and a
three-dimensional nucleus G ∈ R
R
1
×R
2
×R
3
.
In our application, the reconstruction is not ap-
plied, since the goal is to maintain the approxima-
tion using a smaller number of parameters than the
original tensor, and the reconstruction would restore
the original dimensions. Even without reconstruc-
tion, performing convolutions consecutively on the
new tensors resulted in weights similar to that of the
original tensor. The rank values used in the experi-
ments were defined empirically, being proportional to
0.50, 0.40, 0.30, 0.20, and 0.10 of the original values
of the tensor to be decomposed. These intervals allow
the evaluation of different network compression lev-
els and the consequences of using smaller and larger
rank values.
2.5 Machine Learning Algorithms
In these experiments, the data was extracted from the
global average pooling layer before the fully con-
nected layer and stored in feature vectors. Then,
the ML algorithms were used to evaluate the classi-
fication of feature vectors (Wright et al., 2016). At
this stage, the algorithms were implemented using the
scikit-learn machine learning library.
The decision tree (DT) algorithm is a machine
learning method that utilizes classification rules and
analyzes data through a tree-like data structure.
This structure is often represented as a tree dia-
gram, as originally introduced by Quinlan (Quinlan,
1986). The random forest (RF) is an approach that
constructs extensive collections of random decision
trees to make predictions, as originally proposed by
Breiman (Breiman, 2001). This method involves
creating regression trees using bootstrapped samples
from a training dataset, with the additional twist of se-
lecting random features during the tree creation pro-
cess. The support vector machine (SVM) algorithm is
a machine learning model commonly employed in bi-
nary classification tasks. It operates by mapping input
features into a multidimensional space, where it con-
structs a decision surface. Cortes and Vapnik (Cortes
and Vapnik, 1995) presented an implementation in
which it was possible to classify non-linear classes
using a larger dimensional space for data classifica-
tion. Thus, the tests were performed with the SVM
using the polynomial kernel. The Naive Bayes (NB)
method is a machine learning classification method
known for its simplicity and effectiveness. It lever-
ages Bayes’ theorem, which calculates the probability
of an event by considering prior knowledge of rele-
vant conditions (Mitchell, 1997). In the classification
context, NB predicts the likelihood that a data point
belongs to a specific class based on its available fea-
tures and attributes
2.6 Experimental Evaluation
For the execution of the experiments, the image
dataset was classified in a binary way, using only im-
ages of healthy tissues and images of severe dysplasia.
The dataset was evaluated with and without normal-
ization techniques, to verify its impact on the network
accuracy after the decomposition and fine-tuning pro-
cesses. Furthermore, for the classification process,
the k-fold cross-validation was applied with k = 10.
Both the networks were trained for 500 epochs for
the two datasets (normalized and non-normalized).
The stochastic gradient descent (SGD) method was
used as an optimizer and the loss function employed
was the cross-entropy. The learning rate used in the
training stage was 0.001 for both models and datasets.
In this work data augmentation techniques were
used to contribute to the generalization process of the
networks. In the non-normalized image sets, the fol-
lowing were applied: i) random horizontal flip; ii)
random vertical flip; iii) rotation (max. 40º); iv) ran-
dom resized crop (0.80 to 0.90); v) auto contrast; vi)
sharpness; vii) colorjitter: viii) brightness; ix) con-
trast and saturation (0.70 to 1.30). In the normal-
ized dataset, the same operations and settings were
applied, except ColorJitter, which was not applied to
evaluate the colorization process on the images.
After training the original networks, the Tucker
decomposition was employed. The decomposition
operations were applied only to the convolutional lay-
ers. Since each layer has different tensor sizes, the
choice of the rank value was made proportionally,
defining a value between 0 and 1, which was multi-
plied by the original size values of each tensor dimen-
sion. If the result is not an integer, it is rounded up.
To carry out the experiments, the following rank val-
ues were defined: 0.50, 0.40, 0.30, 0.20, and 0.10 to
the original values for each dimension in each tensor.
These values were used in the ResNet-18 and ResNet-
50 models.
In addition to evaluating the performance of image
classification using the fully connected layers investi-
gated models, the image dataset was also classified
using ML algorithms, to evaluate the color normal-
ization and compression of convolutional layer. The
models chosen for both (ResNet-18 and ResNet-50)
were the models with a rank ratio of 0.10 of the value
of the original tensor.
After choosing the models, the histological im-
ages were inputted into the convolutional layers of
Investigation of Deep Neural Network Compression Based on Tucker Decomposition for the Classification of Lesions in Cavity Oral
519

both models, and the features were extracted without
passing them through the fully connected layers and
the Softmax function. After being extracted, these
features were used to train and test the four chosen
ML algorithms: DT, RF, SVM, and NB.
For the analysis of the results for classification,
the value of accuracy was applied to indicate the
global performance of the model (from all classifica-
tions, how much the models got right) (Martinez et al.,
2003).
In the process of evaluating the optimized mod-
els, in addition to the accuracy metric, the network
weights, the total number of parameters, the number
of parameters in the convolutional layers, and the time
spent on decomposing and fine-tuning the network
were also evaluated.
3 RESULTS
3.1 Evaluation of the Classification with
the CNN Models
Tables 1 and 2 present the results obtained with
the dysplasia non-normalized dataset and normalized
dataset. In Table 1, the ResNet-18 model had around
11 million parameters for the original backbone. Af-
ter the decomposition step, using a rank ratio of 0.50,
the number of parameters decreased to approximately
4 million, resulting in a reduction of around 2.66.
With the rank value 0.40 of the original, the number
of parameters was approximately 3 million, equiva-
lent to a reduction of 3.75 times. In the decomposition
using a rank of 0.30, the resulting network had under
2 million parameters, with a compression rate of 5.72.
Using a rank of 0.20, the reduction brings the number
of parameters down to 1.5 million, which is equiva-
lent to a network 9.70 times smaller than the original
network. With a rank of 0.10, the resulting model pro-
vided a number of only 500,000 parameters, which
is 19 times smaller than the size of the original net-
work. The decomposition made with a rank value of
0.50 maintained the accuracy of 100% in the image
set. The original model’s rank of 0.40 resulted in an
accuracy of 85.71%. With rank values of 0.30 and
0.20, the accuracy was 92.85%. Finally, the Turkey
decomposition using a rank value of 0.10 returned an
accuracy of 100%.
For the ResNet-50 model (see Table 1), the initial
number of parameters was approximately 23.5 mil-
lion. After being decomposed with a rank ratio value
of 0.50, the model resulted in an increase in the num-
ber of parameters to 28.5 million. Using rank 0.40,
the number of parameters obtained was around 22.6
million, which means that there was a compression of
parameters. This behavior was also observed at the
other rank levels. The original network achieved an
accuracy of 100% on the set of images without nor-
malization. This value was maintained for the rank
proportions 0.50, 0.40, 0.30 and 0.10. Only for the
model with rank of 0.20 was this value reduced to
85.71%.
Using the dataset of normalized images (see Ta-
ble 2), the decomposition of the CNN models used
the same values for the proportion of ranks, as de-
fined in the Experimental evaluation section, regard-
less of which set of images, the number of optimiza-
tion parameters in each model was similar. In the
case of accuracy, the original ResNet-18 model re-
sulted in 100% for the set of normalized images. A
relevant point is that the normalized images allowed
the models with compression to improve their perfor-
mance for other rank values in relation to the original
images, resulting in an accuracy of 100%. However,
only for ResNet-50 with a rank of 0.40 did this value
degrade in relation to the network’s performance with
the original images (92.85%).
3.2 Investigation of CNN Features with
ML Algorithms
The compressed ResNet-50 and ResNet-18 models
with a rank of 0.10 provided relevant results with the
sets of images investigated with the smallest number
of parameters and the shortest processing time. Thus,
the features obtained from these models were evalu-
ated with ML algorithms.
Figures 3 (a) and 3 (b) show the accuracy val-
ues with the ML algorithms using the original CNN
and compressed backbone, respectively. Figure 3 (a)
shows that the classification obtained with the DT
algorithm with original ResNet-18 features was not
able to achieve 100% accuracy on the non-normalized
dataset. For the other algorithms investigated on this
model, however, when the images were normalized,
this algorithm achieved an accuracy of 100%. For the
other algorithms, performance was similar between
the normalized data and the original data. Figure 3
(b) shows that some of the approaches reduce the re-
sults when using the features obtained from the com-
pressed model (DT and SVM).
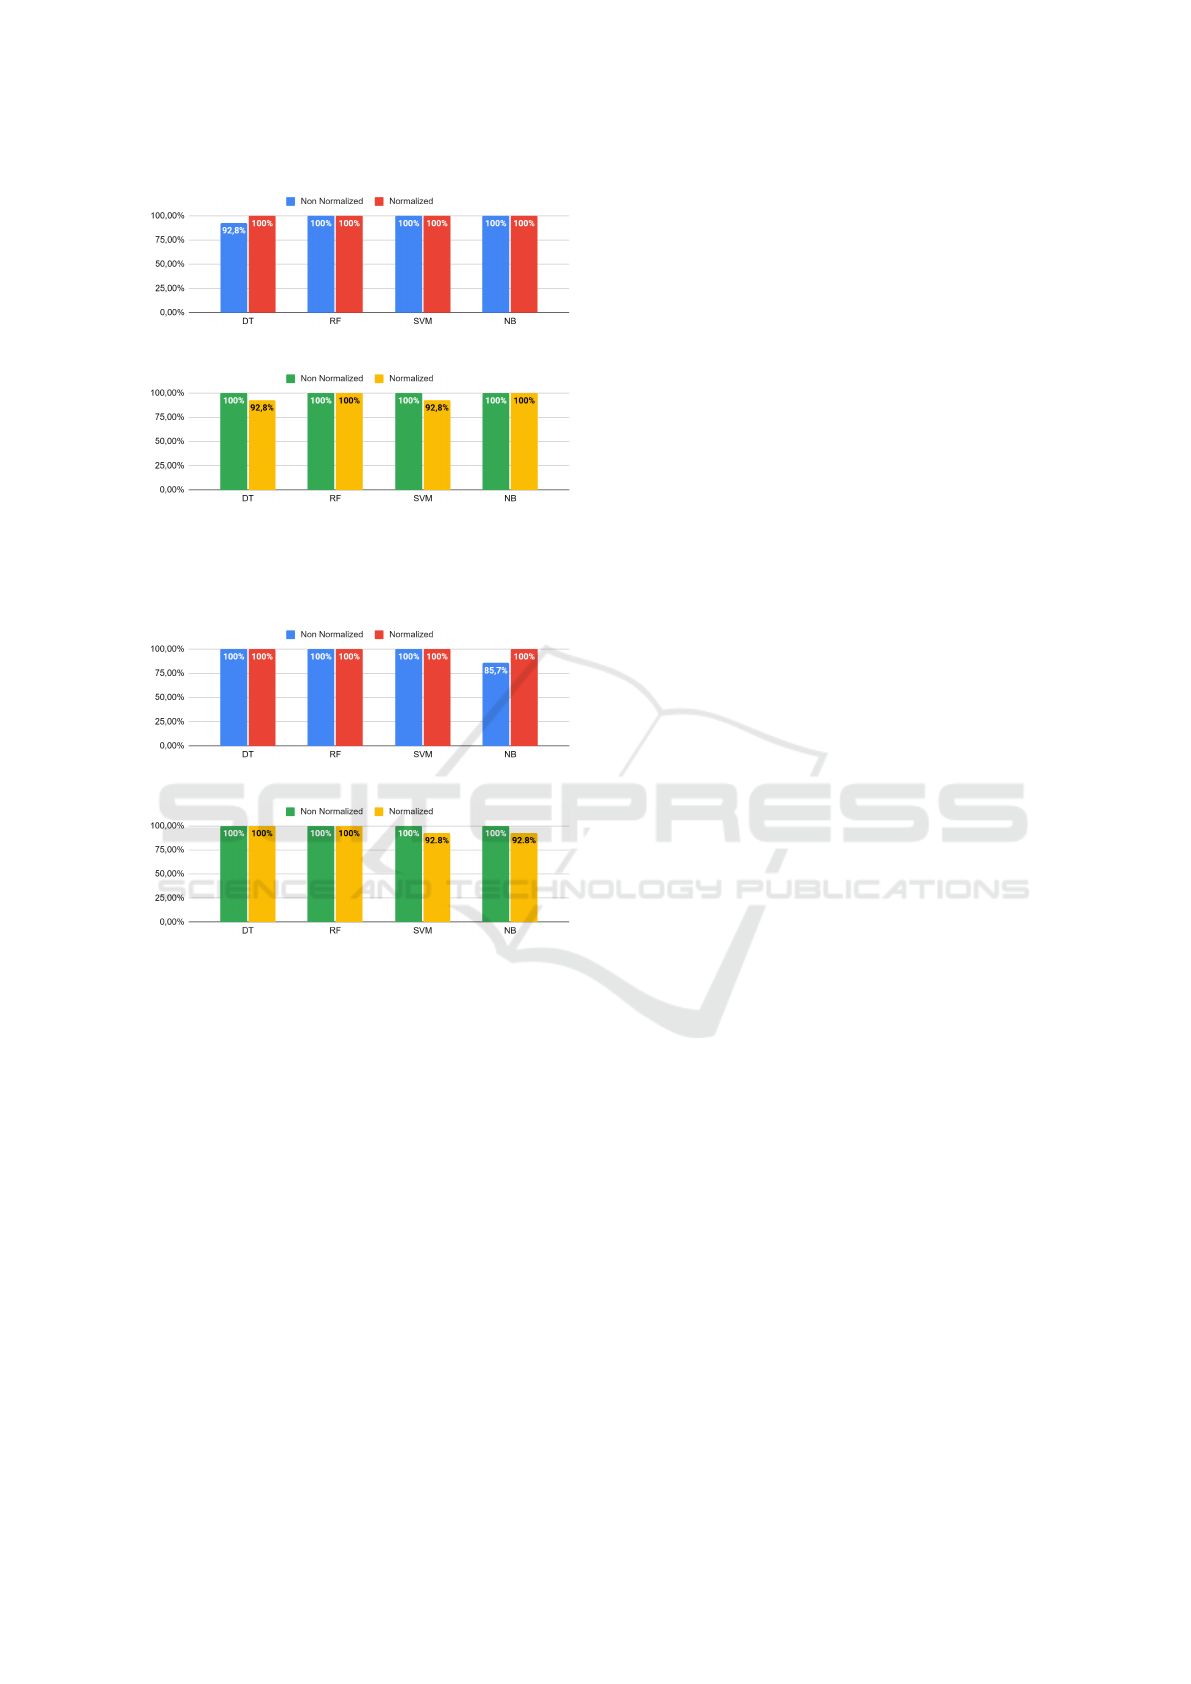
Accuracy values with the ML algorithms using the
original ResNet-50 and compressed ResNet-50 are
presented in Figures 4 (a) and Figures 4 (b), respec-
tively. In the same way, some of the algorithms per-
formed similarly using the original CNN model (see
Figure 4 (a)). However, only the NB algorithm im-
proved performance after the normalization process.
VISAPP 2024 - 19th International Conference on Computer Vision Theory and Applications
520
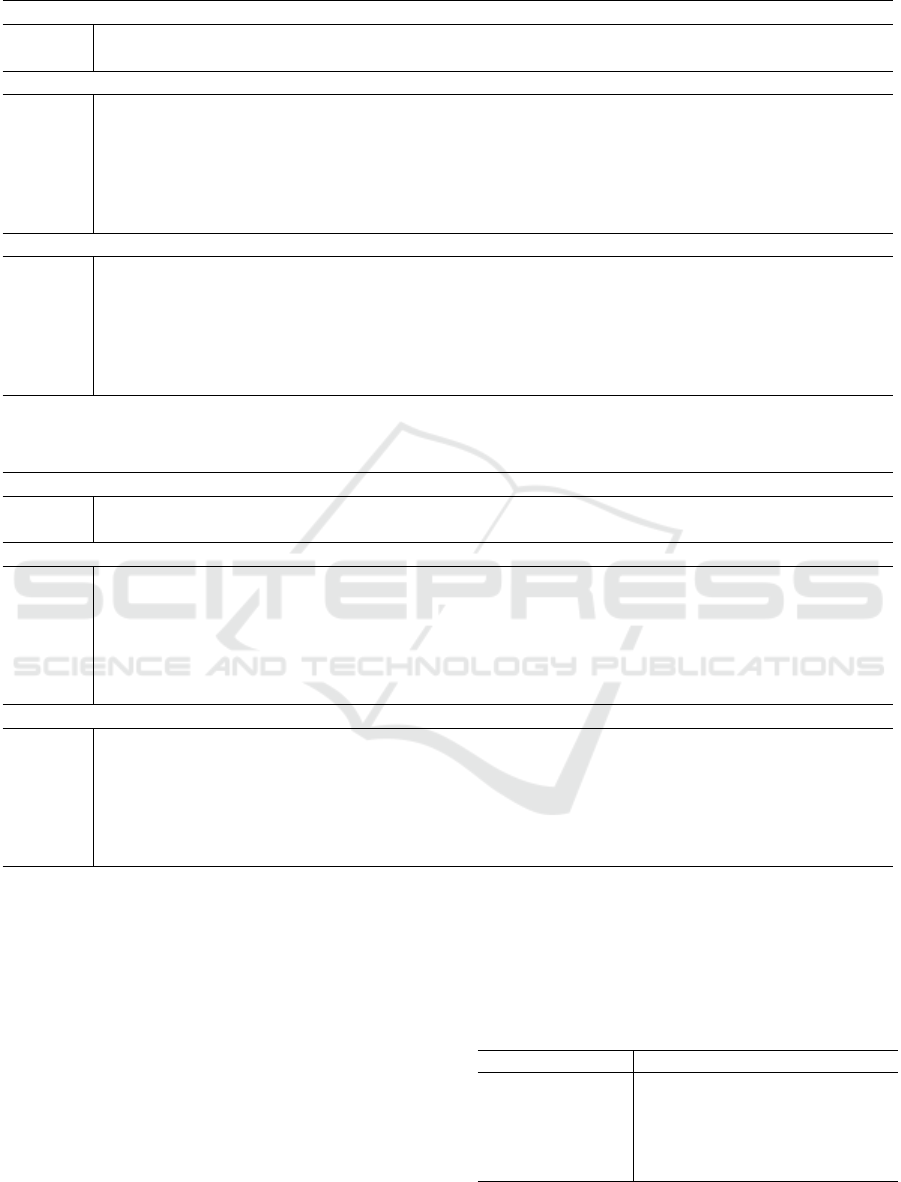
Table 1: Metrics achieved with convolutional neural network models for a dataset of non-normalized histological images.
Original Image Dataset
Rank Accuracy (%) Parameters Compression Rate
Time to
Decompose (seconds)
Time to
Fine-tune (seconds)
ResNet-18
Original 100 11,177,538 1 - -
0.50 100 4,205,890 2.66 7.24 57.11
0.40 85.71 2,978,663 3.75 7.01 46.01
0.30 92.85 1,953,645 5.72 6.86 43.65
0.20 92.85 1,152,867 9.70 5.98 41.91
0.10 100 566,482 19.73 3.87 40.45
ResNet-50
Original 100 23,512,130 1 - -
0.50 100 28,566,722 0.82 13.08 116.71
0.40 100 22,638,820 1.04 12.41 108.04
0.30 100 17,078,229 1.38 11.66 98.55
0.20 85.71 11,933,648 1.97 10.37 87.22
0.10
100 7,200,064 3.27 6.34 76.70
Table 2: Values obtained with the metrics for the convolutional neural network models with the dataset of normalized histo-
logical images.
Normalized Image Dataset
Rank Accuracy (%) Parameters Compression Rate
Time to
Decompose (seconds)
Time to
Fine-tune (seconds)
ResNet-18
Original 100 11,177,538 1 - -
0.50 100 4,205,890 2.66 7.19 57.06
0.40 100 2,978,663 3.75 7.29 49.02
0.30 100 1,953,645 5.72 7.11 46.27
0.20 100 1,152,867 9.70 6.01 44.21
0.10 100 566,482 19.73 3.50 42.87
ResNet-50
Original 100 23,512,130 1 - -
0.50 100 28,566,722 0.82 13.18 126.61
0.40 92.85 22,638,820 1.04 12.69 113.54
0.30 100 17,078,229 1.38 11.64 103.14
0.20
100 11,933,648 1.97 10.29 93.52
0.10 100 7,200,064 3.27 6.52 80.03
In Figures 4 (b), the features obtained from the com-
pressed network model showed lower results when
the normalization process was applied to the images
for part of the classification algorithms. The results
show that, although the use of stain normalization im-
proves classification when applied only to CNN ar-
chitectures, the approach of associating features and
ML algorithms with data from compressed networks
degraded the performance of the dataset.
Table 3 presents a comprehensive summary of the
results obtained in contrast to the outcomes achieved
by relevant image processing techniques developed
for the examination of histopathological images of
dysplasia of the oral cavity. The results show that the
approach investigated contributes to the classification
of histological lesions of the oral cavity to present a
reduced CNN model to assist in the diagnostic pro-
cess for specialists.
Table 3: Evaluation between proposed systems and classifi-
cation methods in the literature with oral tissue dataset.
Study Feature Extraction Classifier A
CC
(Adel et al., 2018) ORB SVM 92.6
(Silva et al., 2022) CNN features HOP 98.0
(Deif et al., 2022) Learning feature XGBoost 96.3
(Neves et al., 2023) Learning feature CNN 97.9
Proposed Approach CNN feature Softmax 100
Investigation of Deep Neural Network Compression Based on Tucker Decomposition for the Classification of Lesions in Cavity Oral
521
(a) Features obtained with original ResNet-18 model.
(b) Features extracted from the compressed ResNet-18
model.
Figure 3: Accuracy obtained with CNN features and ML
algorithms: (a) original model; (b) compressed model.
(a) Feature obtained with original ResNet-50 backbone.
(b) Feature obtained with compressed ResNet-50 model.
Figure 4: Comparison of accuracy between the ML algo-
rithms: (a) original model; (b) compressed model.
4 CONCLUSIONS
This work evaluated compressed ResNet architectures
obtained by using Tucker decomposition on convo-
lutional layer kernels. Furthermore, this work eval-
uated the impact on the accuracy of the networks
when using the color normalization method proposed
by (Tosta et al., 2019b) on the investigated dataset.
As shown in Tables 1 and 2, the networks that were
trained using our dataset achieved good accuracy,
even when decomposed using very small values for
the rank proportion, which resulted in significant
compression of the networks, drastically reducing the
total number of the parameters. These results were es-
pecially positive when combined with color normal-
ization.
In this study, the classification also was evalu-
ated with classic ML algorithms using the features
extracted from the compressed networks. The re-
sults, shown in Figures 3 and 4, indicate that the algo-
rithms maintain good performance in both networks
when used to classify non-normalized images. How-
ever, when color normalization was applied, the al-
gorithms demonstrated an accuracy drop, regardless
of the architecture used for feature extraction. Future
work will investigate other compression approaches
and CNN model architectures to evaluate the classifi-
cation of histological lesions
ACKNOWLEDGMENT
This study was financed in part by the Coordenac¸
˜
ao
de Aperfeic¸oamento de Pessoal de N
´
ıvel Supe-
rior - Brasil (CAPES) - Finance Code 001. The
authors gratefully acknowledge the financial sup-
port of National Council for Scientific and Techno-
logical Development CNPq (Grants #313643/2021-
0, #311404/2021-9 and #307318/2022-2), the State
of Minas Gerais Research Foundation - FAPEMIG
(Grant #APQ-00578-18 and Grant #APQ-01129-21)
and S
˜
ao Paulo Research Foundation - FAPESP (Grant
#2022/03020-1).
REFERENCES
Adel, D., Mounir, J., El-Shafey, M., Eldin, Y. A., El Masry,
N., AbdelRaouf, A., and Abd Elhamid, I. S. (2018).
Oral epithelial dysplasia computer aided diagnostic
approach. In 2018 13th International Conference on
Computer Engineering and Systems (ICCES), pages
313–318. IEEE.
Al-Haija, Q. A. and Adebanjo, A. (2020). Breast cancer
diagnosis in histopathological images using resnet-50
convolutional neural network. In 2020 IEEE Interna-
tional IOT, Electronics and Mechatronics Conference
(IEMTRONICS), pages 1–7.
Belsare, A. (2012). Histopathological image analysis using
image processing techniques: An overview. Signal &
Image Processing : An International Journal, 3:23–
36.
Breiman, L. (2001). Random forests. Machine Learning,
45(1):5–32.
Celis, R. and Romero, E. (2015a). Unsupervised color nor-
malisation for h and e stained histopathology image
analysis. In 11th International Symposium on Medical
Information Processing and Analysis, volume 9681,
pages 16–22. SPIE.
Celis, R. and Romero, E. (2015b). Unsupervised color nor-
malisation for h and e stained histopathology image
analysis. volume 9681. Cited by: 8.
VISAPP 2024 - 19th International Conference on Computer Vision Theory and Applications
522

Cichocki, A., Phan, A.-H., Zhao, Q., Lee, N., Oseledets,
I., Sugiyama, M., and Mandic, D. P. (2017). Tensor
networks for dimensionality reduction and large-scale
optimization: Part 2 applications and future perspec-
tives. Foundations and Trends® in Machine Learning,
9(6):431–673.
Cortes, C. and Vapnik, V. (1995). Support-vector networks.
Machine Learning, 20(3):273–297.
Deif, M. A., Attar, H., Amer, A., Elhaty, I. A., Khosravi,
M. R., Solyman, A. A., et al. (2022). Diagnosis of oral
squamous cell carcinoma using deep neural networks
and binary particle swarm optimization on histopatho-
logical images: an aiomt approach. Computational
Intelligence and Neuroscience, 2022.
Ferro, A., Kotecha, S., and Fan, K. (2022). Machine learn-
ing in point-of-care automated classification of oral
potentially malignant and malignant disorders: a sys-
tematic review and meta-analysis. Scientific Reports,
12(1):13797.
He, K., Zhang, X., Ren, S., and Sun, J. (2015). Deep resid-
ual learning for image recognition.
Khan, A. M., Rajpoot, N., Treanor, D., and Magee, D.
(2014). A nonlinear mapping approach to stain
normalization in digital histopathology images using
image-specific color deconvolution. IEEE Transac-
tions on Biomedical Engineering, 61(6):1729 – 1738.
Cited by: 391; All Open Access, Bronze Open Ac-
cess.
Kim, Y.-D., Park, E., Yoo, S., Choi, T., Yang, L., and Shin,
D. (2016). Compression of deep convolutional neural
networks for fast and low power mobile applications.
Kolda, T. G. and Bader, B. W. (2009). Tensor decomposi-
tions and applications. SIAM Review, 51(3):455–500.
Kumar, V., Abbas, A., Fausto, N., and Aster, J. (2009). Rob-
bins & Cotran Pathologic Basis of Disease E-Book.
Robbins Pathology. Elsevier Health Sciences.
Liu, Y. and Ng, M. K. (2022). Deep neural network com-
pression by tucker decomposition with nonlinear re-
sponse. Knowledge-Based Systems, 241:108171.
Lumerman, H., Freedman, P., and Kerpel, S. (1995). Oral
epithelial dysplasia and the development of inva-
sive squamous cell carcinoma. Oral Surgery, Oral
Medicine, Oral Pathology, Oral Radiology, and En-
dodontology, 79(3):321–329.
Martinez, E. Z., Neto, F. L., and de Braganc¸a Pereira, B.
(2003). A curva roc para testes diagn
´
osticos.
Mitchell, T. M. (1997). Machine learning.
Neves, L. A., Martinez, J. M. C., Longo, L. H. d. C.,
Roberto, G. F., Tosta, T. A. A., Faria, P. R. d., Loy-
ola, A. M., Cardoso, S. V., Silva, A. B., Nascimento,
M. Z. d., et al. (2023). Classification of h&e images
via cnn models with xai approaches, deepdream rep-
resentations and multiple classifiers. In Proceedings.
Quinlan, J. R. (1986). Induction of decision trees. Machine
Learning, 1(1):81–106.
Ribeiro, M. G., Neves, L. A., Roberto, G. F., Tosta, T. A.,
Martins, A. S., and Do Nascimento, M. Z. (2018).
Analysis of the influence of color normalization in the
classification of non-hodgkin lymphoma images. In
2018 31st SIBGRAPI Conference on Graphics, Pat-
terns and Images (SIBGRAPI), pages 369–376. IEEE.
Sarwinda, D., Paradisa, R. H., Bustamam, A., and Anggia,
P. (2021). Deep learning in image classification using
residual network (resnet) variants for detection of col-
orectal cancer. Procedia Computer Science, 179:423–
431. 5th International Conference on Computer Sci-
ence and Computational Intelligence 2020.
Sethi, A., Sha, L., Vahadane, A. R., Deaton, R. J., Ku-
mar, N., Macias, V., and Gann, P. H. (2016). Em-
pirical comparison of color normalization methods
for epithelial-stromal classification in h and e images.
Journal of Pathology Informatics, 7(1):17.
Sha, L., Schonfeld, D., and Sethi, A. (2017). Color nor-
malization of histology slides using graph regularized
sparse NMF. In Gurcan, M. N. and Tomaszewski,
J. E., editors, Society of Photo-Optical Instrumen-
tation Engineers (SPIE) Conference Series, volume
10140 of Society of Photo-Optical Instrumentation
Engineers (SPIE) Conference Series, page 1014010.
Sidiropoulos, N. D., De Lathauwer, L., Fu, X., Huang, K.,
Papalexakis, E. E., and Faloutsos, C. (2017). Ten-
sor decomposition for signal processing and machine
learning. IEEE Transactions on Signal Processing,
65(13):3551–3582.
Silva, A. B., De Oliveira, C. I., Pereira, D. C., Tosta,
T. A., Martins, A. S., Loyola, A. M., Cardoso, S. V.,
De Faria, P. R., Neves, L. A., and Do Nascimento,
M. Z. (2022). Assessment of the association of deep
features with a polynomial algorithm for automated
oral epithelial dysplasia grading. In 2022 35th SIB-
GRAPI Conference on Graphics, Patterns and Images
(SIBGRAPI), volume 1, pages 264–269. IEEE.
Talo, M. (2019). Convolutional neural networks for multi-
class histopathology image classification. ArXiv,
abs/1903.10035.
Tosta, T. A. A., de Faria, P. R., Neves, L. A., and do Nasci-
mento, M. Z. (2019a). Computational normalization
of h&e-stained histological images: Progress, chal-
lenges and future potential. Artificial intelligence in
medicine, 95:118–132.
Tosta, T. A. A., de Faria, P. R., Servato, J. P. S., Neves,
L. A., Roberto, G. F., Martins, A. S., and do Nasci-
mento, M. Z. (2019b). Unsupervised method for nor-
malization of hematoxylin-eosin stain in histological
images. Comput Med Imaging Graph, 77:101646.
Vahadane, A., Peng, T., Albarqouni, S., Baust, M., Steiger,
K., Schlitter, A. M., Sethi, A., Esposito, I., and Navab,
N. (2015). Structure-preserved color normalization
for histological images. In 2015 IEEE 12th Inter-
national Symposium on Biomedical Imaging (ISBI),
pages 1012–1015.
Wild, C., Stewart, B., Weiderpass, E., for Research on Can-
cer, I. A., and Weltgesundheitsorganisation (2020).
World Cancer Report: Cancer Research for Cancer
Prevention. International Agency for Research on
Cancer.
Wright, M. N., Ziegler, A., and K
¨
onig, I. R. (2016). Do little
interactions get lost in dark random forests? BMC
bioinformatics, 17(1):145.
Investigation of Deep Neural Network Compression Based on Tucker Decomposition for the Classification of Lesions in Cavity Oral
523
