
Linux Configuration Tuning: Is Having a Large Dataset Enough?
Hifza Khalid
1 a
, Peter Portante
2
and Alva Couch
1 b
1
Department of Computer Science, Tufts University, MA, U.S.A.
2
Red Hat Inc., 100 East Davie Street, Raleigh, NC, U.S.A.
Keywords:
Linux, Configuration Tuning, Network Performance, Feature Selection, Data Diversity.
Abstract:
While it would seem that enough data can solve any problem, data quality determines the appropriateness
of data to solve specific problems. We intended to use a large dataset of performance data for the Linux
operating system to suggest optimal tuning for network applications. We conducted a series of experiments
to select hardware and Linux configuration options that are significant to network performance. Our results
showed that network performance was mainly a function of workload and hardware. Investigating these results
showed that our dataset did not contain enough diversity in configuration settings to infer the best tuning and
was only useful for making hardware recommendations. Others with similar problems can use our tests to
save time in concluding that a particular dataset is not suitable for machine learning.
1 INTRODUCTION
Red Hat, a provider of enterprise open source solu-
tions, provided us with a large database of benchmark
runs covering different hardware and Linux configu-
rations, with different workload characteristics. Most
of the dataset was generated on private servers in-
side Red Hat and a part of it was generated on public
cloud systems, all by Red Hat employees. Our goal
was to use this data to automate the process of Linux
configuration tuning, a process that typically involves
running a benchmark application, monitoring the re-
sults and using educated guesses coupled with years
of experience to tune the parameter values, until the
performance of the application is as expected or the
hardware components causing its sub-optimal perfor-
mance are determined.
Although there were many benchmarks included
with the data, we decided to initially work with the
network benchmark because most large information
systems are structured as distributed systems and their
performance is generally characterized by their net-
work throughput and response time (Saboori et al.,
2008). On the fastest networks, the performance of
distributed systems is limited by the host’s ability to
generate, transmit, process, and receive data (Chase
et al., 2001). Since a large chunk of our dataset was
a
https://orcid.org/0000-0003-2929-0454
b
https://orcid.org/0000-0002-4169-1077
generated inside Red Hat where the network is stable
and homogeneous, this gave us the added advantage
to isolate and study the impact of host configuration
on network performance.
One of the most difficult problems in configura-
tion tuning is to predict how different configurations
behave with different applications and workloads. It
is even more challenging with Linux, a complex sys-
tem with more than 15, 000 unique configuration op-
tions (Acher et al., 2019b), (Acher et al., 2019a). If
each option is independent and has a binary value, this
leads to a total number of 2
15,000
unique variants of
system configuration (Acher et al., 2019b). With such
a large search space, gauging the effect of all the pos-
sible settings can be extremely expensive and time-
consuming.
We began working toward our goal of configu-
ration tuning by selecting an initial set of hardware
and Linux configuration parameters. Since these pa-
rameters were not necessarily the most effective in
changing network performance, we used various fea-
ture selection methods to eliminate the redundant pa-
rameters and find a smaller set of parameters directly
impacting network performance. Our results showed
that network performance was mainly a function of
hardware parameters and workload. This was an un-
expected result and we became curious to investigate
it. Analyzing the dataset exposed that users who ran
these network benchmarks did not typically change
the operating system configuration substantively and
Khalid, H., Portante, P. and Couch, A.
Linux Configuration Tuning: Is Having a Large Dataset Enough?.
DOI: 10.5220/0012387200003654
Paper published under CC license (CC BY-NC-ND 4.0)
In Proceedings of the 13th International Conference on Pattern Recognition Applications and Methods (ICPRAM 2024), pages 771-778
ISBN: 978-989-758-684-2; ISSN: 2184-4313
Proceedings Copyright © 2024 by SCITEPRESS – Science and Technology Publications, Lda.
771

therefore, we did not have a sufficiently diverse sam-
ple of data. Our research also revealed other limita-
tions of the dataset that were only apparent after visu-
alizing the data. Based on our work, we recommend
a set of preliminary experiments for researchers look-
ing to determine the worthiness of a dataset for per-
formance tuning and share some of our findings from
the dataset analysis.
The rest of the paper is organized as follows: Sec-
tion 2 describes data collection; Section 3 gives an
overview of the dataset; Section 4 discusses our fea-
ture selection approach and results; Section 5 de-
scribes experiments to determine diversity in the data;
Section 6 discusses patterns and trends in the dataset;
Section 7 reviews the related work, and Section 8 con-
cludes the paper.
2 DATA COLLECTION
The dataset used in this work was collected using
Pbench (Theurer et al., 2015), an open source bench-
marking and performance analysis framework devel-
oped by Red Hat. While Red Hat has been actively
generating and collecting benchmark data for more
than six years now, for the purpose of our work, we
used recent data for eight months that were unpacked
and prepared for our use. The older data did not con-
cern sufficiently modern kernel versions.
Figure 1: Inputs and outputs for Pbench.
Pbench has built-in benchmark scripts that it can
run alongside a variety of performance tools on mul-
tiple hosts within a distributed system while also col-
lecting configuration information from all the systems
involved. Pbench uses the sosreport utility (Reeves
et al., 2014) to collect configuration details, system
and diagnostic information from hosts. The tool col-
lects around 6, 000 configuration files and the output
of more than 200 commands from each specified host
during the benchmark run. Pbench also provides users
the flexibility to run their own benchmarks and record
results in Pbench format.
The Pbench architecture consists of three major
components: the Agent, Server, and Dashboard. The
Pbench Agent provides convenience interfaces for
users to run benchmark workloads to facilitate the
collection of benchmark data, tools data (iostat, vm-
Figure 2: Workflow of a benchmark script in Pbench.
stat, etc.) and, system configuration information from
all the hosts involved. The Pbench Server provides
archival storage of data collected by the Agent and
indexes data into Elasticsearch (B.V, a). The Dash-
board provides data curation and visualization of the
collected data.
Pbench takes as input a benchmark type, desired
workload, performance tools e.g. sar, iostat, etc. to
run and hosts on which to execute the benchmark as
shown in Figure 1. It outputs the benchmark results,
tool results and the system configuration for all the
hosts. The workflow of a Pbench run is shown in
Figure 2. Given the input, Pbench creates a results
directory on the same system, starts collection tools
on all hosts, runs the workload generator and starts
the benchmark. Once the benchmark run finishes, it
stops the collection tools on all the hosts, and runs a
postprocessing step that gathers results from all the
remote hosts and executes postprocesssing tools on
all of the data. This could include calculating aver-
ages, throughput and response time for various sys-
tem operations. Pbench runs a test multiple times and
returns the average performance results if all the runs
are successful. A test fails when the standard devia-
tion for the results of the repeated runs is more than a
specified threshold.
Out of the several benchmark scripts that Pbench
runs, we chose to study data collected using the uperf
(Nadgir et al., 2009) benchmark for network perfor-
mance. Other than uperf, Pbench also runs disk, CPU
and user-created benchmarks.
2.1 Uperf
uperf is a network performance tool that can run in
multiple settings: with single client and single server,
with multiple clients and single server and, with mul-
tiple clients and multiple servers with one-to-one cor-
respondence between them. The tool takes the de-
scription of the workload as input and generates the
load accordingly to measure system performance.
uperf has seven inputs as shown in Table 1. The
parameters –clients and –servers are used to specify
the client and the server systems to run the test. –
test-type is used to specify if the workload generated
should be transactional (where response time is im-
ICPRAM 2024 - 13th International Conference on Pattern Recognition Applications and Methods
772
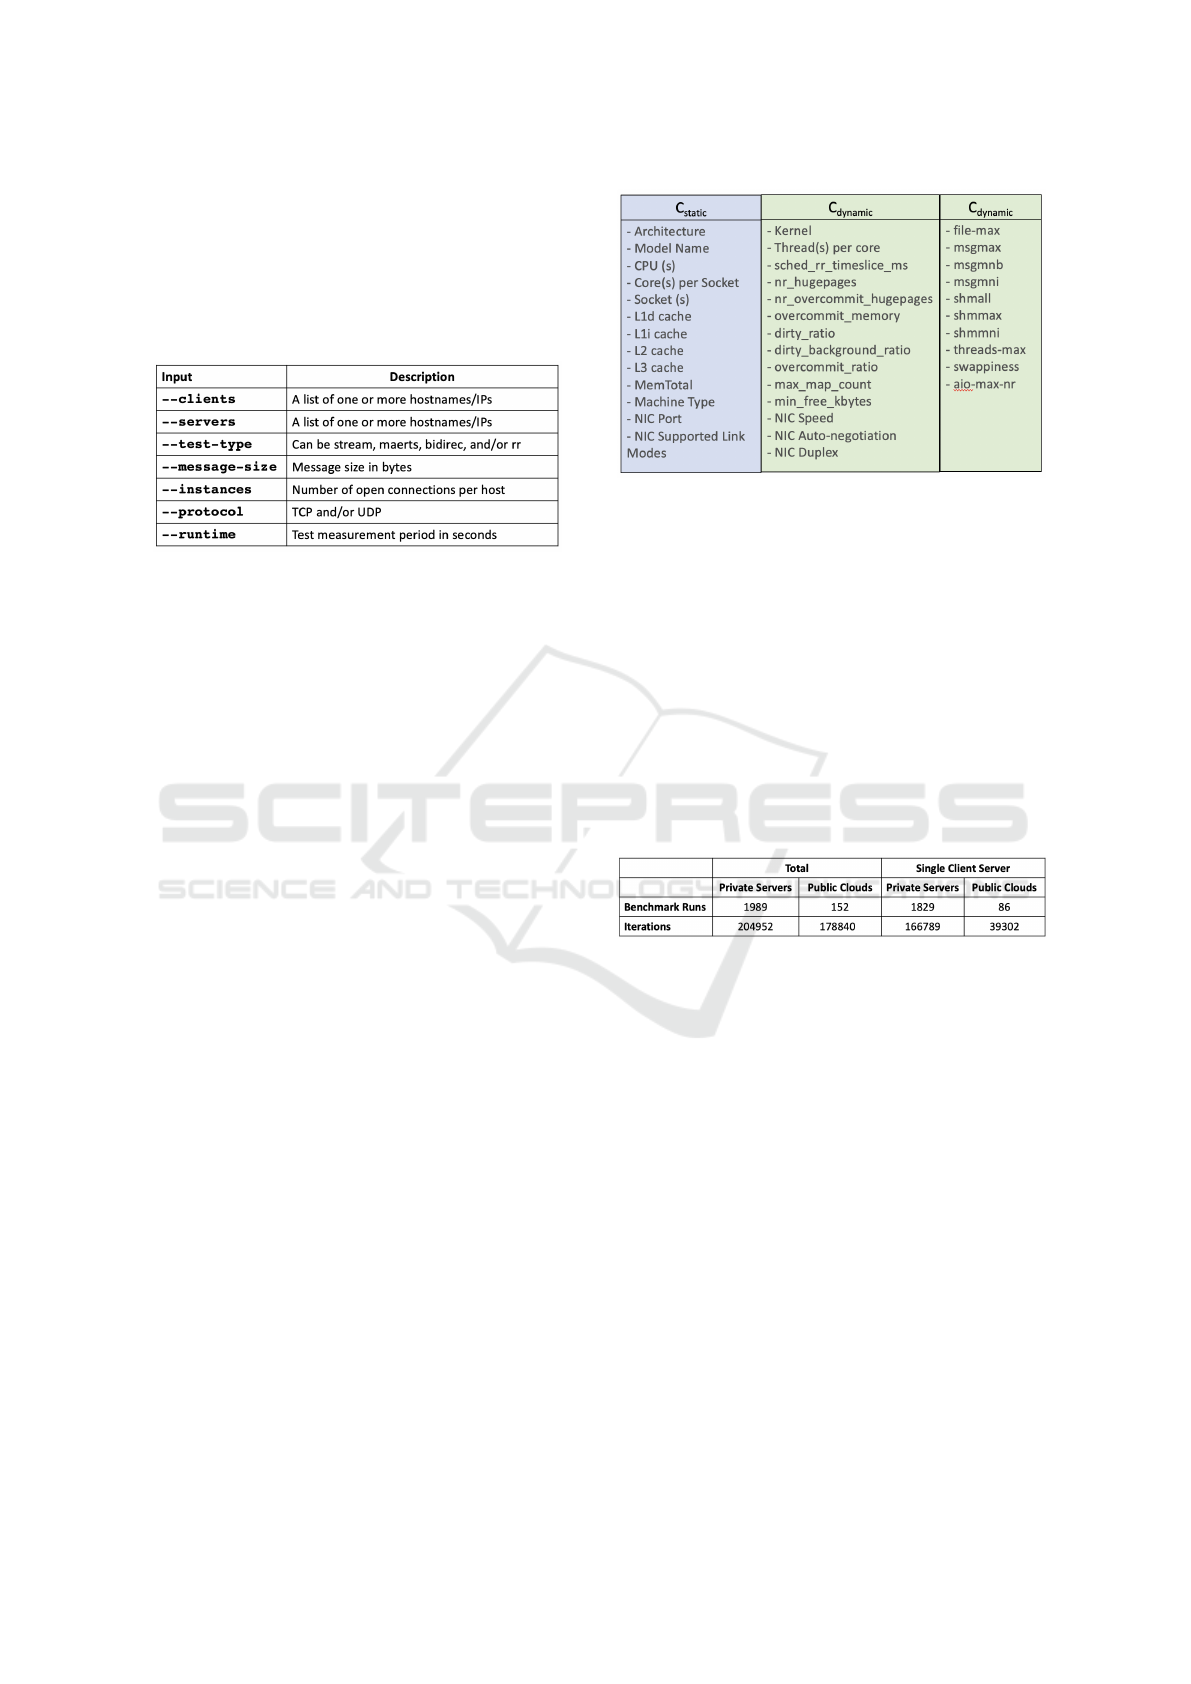
portant) or streaming (where completion time for all
tasks is important). –message-size tells the size of
the messages in bytes, instances shows the number
of open connections per host and protocol represents
the network protocol used for communication.
Table 1: uperf workload parameters and their description.
2.2 Data Storage
Our prepared data was stored in two locations: the
configuration data from the systems was stored on
Red Hat servers while performance results and work-
load information was indexed in Elasticsearch. The
mapping between Pbench runs and the corresponding
configuration information was also stored in Elastic-
search. To interact with the data in Elasticsearch, we
used Kibana (B.V, b).
3 DATASET OVERVIEW
Since the Linux configuration space is huge, we be-
gan with a smaller representative set of hardware and
system configuration. We divided all the parameters
of interest in the following three categories: C
static
,
C
dynamic
and P.
1. Immutable: invariants of the machine chosen.
C
static
2. Mutable by the user. C
dynamic
3. Performance indicators. P
4. Not practically mutable by the user. “Buy a new
machine.” We think of these as part of C
static
.
Based on these categories, we chose the initial
set of C
static
and C
dynamic
parameters shown in Fig-
ure 3. The hardware parameters were chosen based
on feedback from experts at Red Hat and the SPEC
benchmark (Corporation, ). Tuning parameters were
chosen based on the performance tuning guide writ-
ten by Red Hat (RedHat, 2018) for RHEL. These in-
cluded parameters from all major sub-components of
a system including memory, disk, network, kernel and
CPU that could impact network performance.
Figure 3: Hardware and Linux configuration parameters
chosen for analysis.
We considered both transactional and streaming
workloads for our work. In a transactional workload
(which is sometimes called “interactive”), latency be-
tween request and response is important, while in
a streaming workload (which is sometimes called
“batch processing”), only throughput is important.
For transactional workload, the performance metrics
in the dataset are throughput in trans/sec and latency
in usec. For streaming workloads, the benchmark
only measured throughput in Gb/sec.
Table 2: Statistics for tests conducted in different environ-
ments.
3.1 Testing Environments
The dataset used in this work contains benchmark
runs executed in two different environments, either on
private servers inside Red Hat or in public clouds like
Amazon EC2, Microsoft Azure, and the IBM public
cloud. Table 2 shows the total number of network
benchmark runs in out dataset executed internally at
Red Hat and externally in public clouds. As the statis-
tics show, more than 90% of the benchmark data was
generated on Red Hat systems. Based on these results,
we chose to work only with the data collected inside
Red Hat as the public cloud data was not necessarily
commensurate or comparable. Co-location of bench-
marks with other unknown tenants in public clouds
made that data difficult to compare with the Red Hat
data.
Since the goal of our work is to tune Linux config-
uration, and distributed systems can have a complex
mesh of hosts including multiple clients and multiple
servers, we scoped down our problem to focus only
Linux Configuration Tuning: Is Having a Large Dataset Enough?
773
on systems with a single client and server to avoid
exploding the configuration space. Table 2 shows
the counts of network benchmark runs with the sim-
plest scenario of single client and server and the cor-
responding testing environment. As the results shows,
92% of the data generated internally used the single-
client-server setting while runs outside Red Hat used
this setup for only 56.6% of the cases. The table
also shows the count for the number of iterations in
each scenario. An iteration is a Pbench run with a
given workload configuration. A single Pbench run
can have multiple iterations depending upon the num-
ber of unique workloads that the run is tasked with
testing.
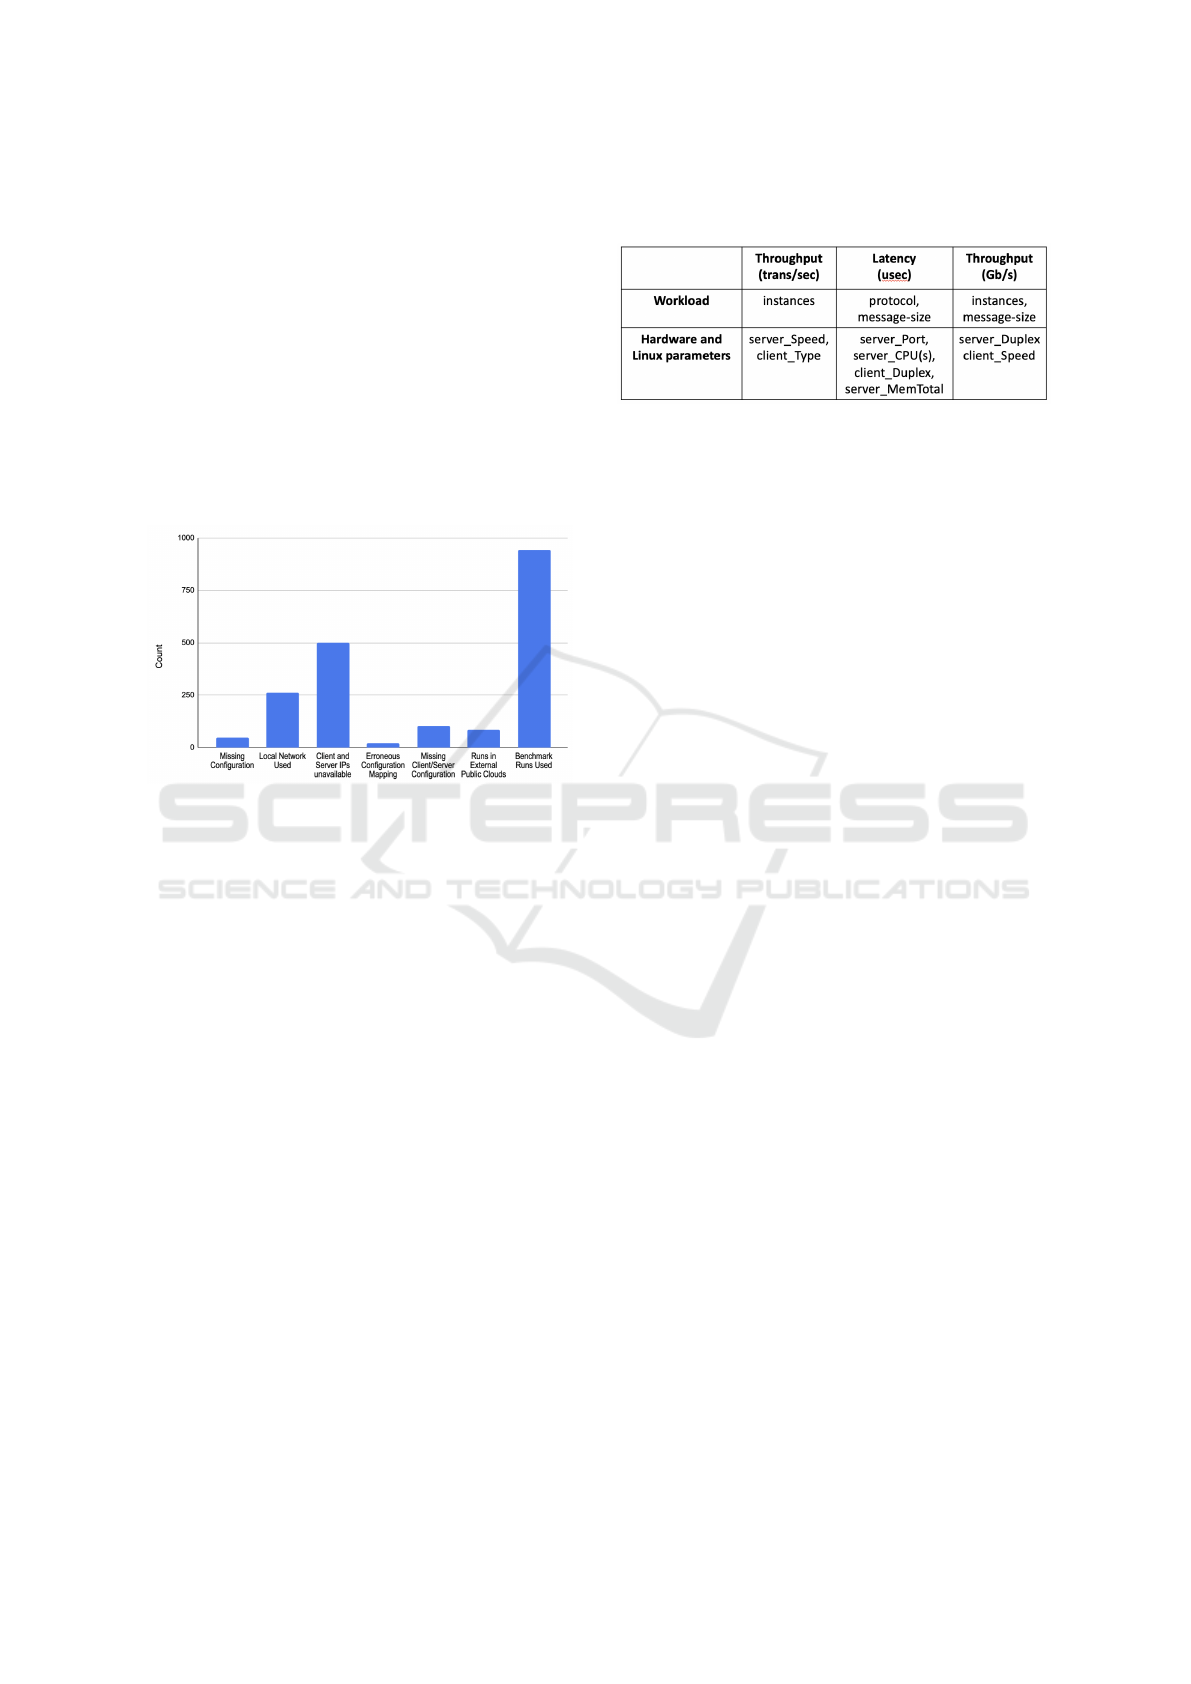
Figure 4: Distribution of missing and erraneous data.
3.2 Missing and Erroneous Data
We found 1, 964 total uperf runs with a single-client-
server setup in our dataset. As we continued working
with these runs and began collecting their configura-
tion and performance information, we came across
several cases where the data we required was miss-
ing, erroneous, or outside the scope of our work. The
distribution of all these cases is shown in Fig. 4. We
eliminated 49 runs from our dataset because config-
uration information was missing (Table 2 does not
show these runs) and 261 runs were eliminated be-
cause they used the same host for client and server,
thus not using the network at all. 500 runs did not
specify client and server IP addresses used for com-
munication. This information was necessary for us to
determine the physical network interface card (NIC)
used by the hosts, but was missing for almost 25%
of the runs. 21 runs had erroneous mapping of runs
to configuration information, 104 runs had missing
client or server configuration and 85 of the remaining
runs were on external public clouds. After eliminat-
ing all these runs, our dataset contained 944 runs that
we used for the rest of our work.
Table 3: Significant workload, hardware and configuration
features.
4 CHOOSING SIGNIFICANT
FEATURES
Since all the parameters that we selected for our work
may not have been relevant to network performance,
after selecting the preliminary set of static and dy-
namic features, we used common dimensionality re-
duction techniques to eliminate the redundant param-
eters. First we removed parameters with constant
values. We then calculated the correlation between
configuration parameters and the target variables and
eliminated all the parameters with value less than
|0.1|, a commonly used threshold to identify the un-
correlated pairs.
At the end of the above dimension reduction, we
still had too many parameters, and considered fur-
ther feature selection via embedded methods such
as Lasso and Tree based methods (Agarwal, ). We
chose to work with tree-based embedded methods for
their simplicity, flexibility and low computational cost
compared to other methods. Within the tree based
methods, we had three options: CART (Mesnier et al.,
2007), Random Forest (Yiu, ) and XGBoost (Team, ).
Using these three feature selection decision tree
methods, the final set of significant features for the
client and server systems for all three types of target
variables is shown in Table 3. The results show that
most of the features that are significant in determining
network performance are hardware parameters except
a few configuration options for the network interface
card that also obey a hardware constraint i.e. NIC Du-
plex and NIC Speed. The network speed can be con-
figured up to the maximum capacity of the network
card.
Table 3 also shows workload parameters that
are the most effective in changing network perfor-
mance. The results suggest that the benchmark in-
put instances is mainly responsible for throughput
performance of transactional workload. For stream-
ing workloads, message-size is also significant. For
latency performance of transactional workload, both
protocol and message-size impact the results.
ICPRAM 2024 - 13th International Conference on Pattern Recognition Applications and Methods
774
These results were surprising for us since we ex-
pected at least a few linux parameters to play an im-
portant role in network performance. For example,
(RedHat, 2018) describes a tuning deamon that RHEL
users can use to adapt system configuration for better
performance under certain workloads. For improved
network performance, the tool sets vm.dirty ratio to
40%. Since we did not find any of the dynamic pa-
rameters to be significant, we decided to analyse the
dataset to investigate the causes of this.
5 TESTING THE DATASET FOR
DIVERSITY
The hidden problem in our dataset was the lack of di-
versity of hardware, Linux configurations, and work-
loads. After eliminating missing and incorrect data,
our dataset consisted of 944 unique network bench-
mark runs and 133555 total iterations within these
runs. It contained separate iterations based on the re-
sult type, for example, we found two iterations for the
same configuration and workload but different perfor-
mance results i.e. throughput and latency.
5.1 Distribution of Hardware
Specifications
The parameters that we considered static for the pur-
pose of our experiments are shown in Figure 3. One
of these parameters is “Machine Type” that can have
two possible values, physical or virtual. Some of
the static parameters in our set are mutable in vir-
tual machines but not in physical machines. For the
purpose of simplicity, we did not create further cate-
gories for virtual and physical systems that could have
been used for a more accurate distinction between im-
mutable and dynamic parameters.
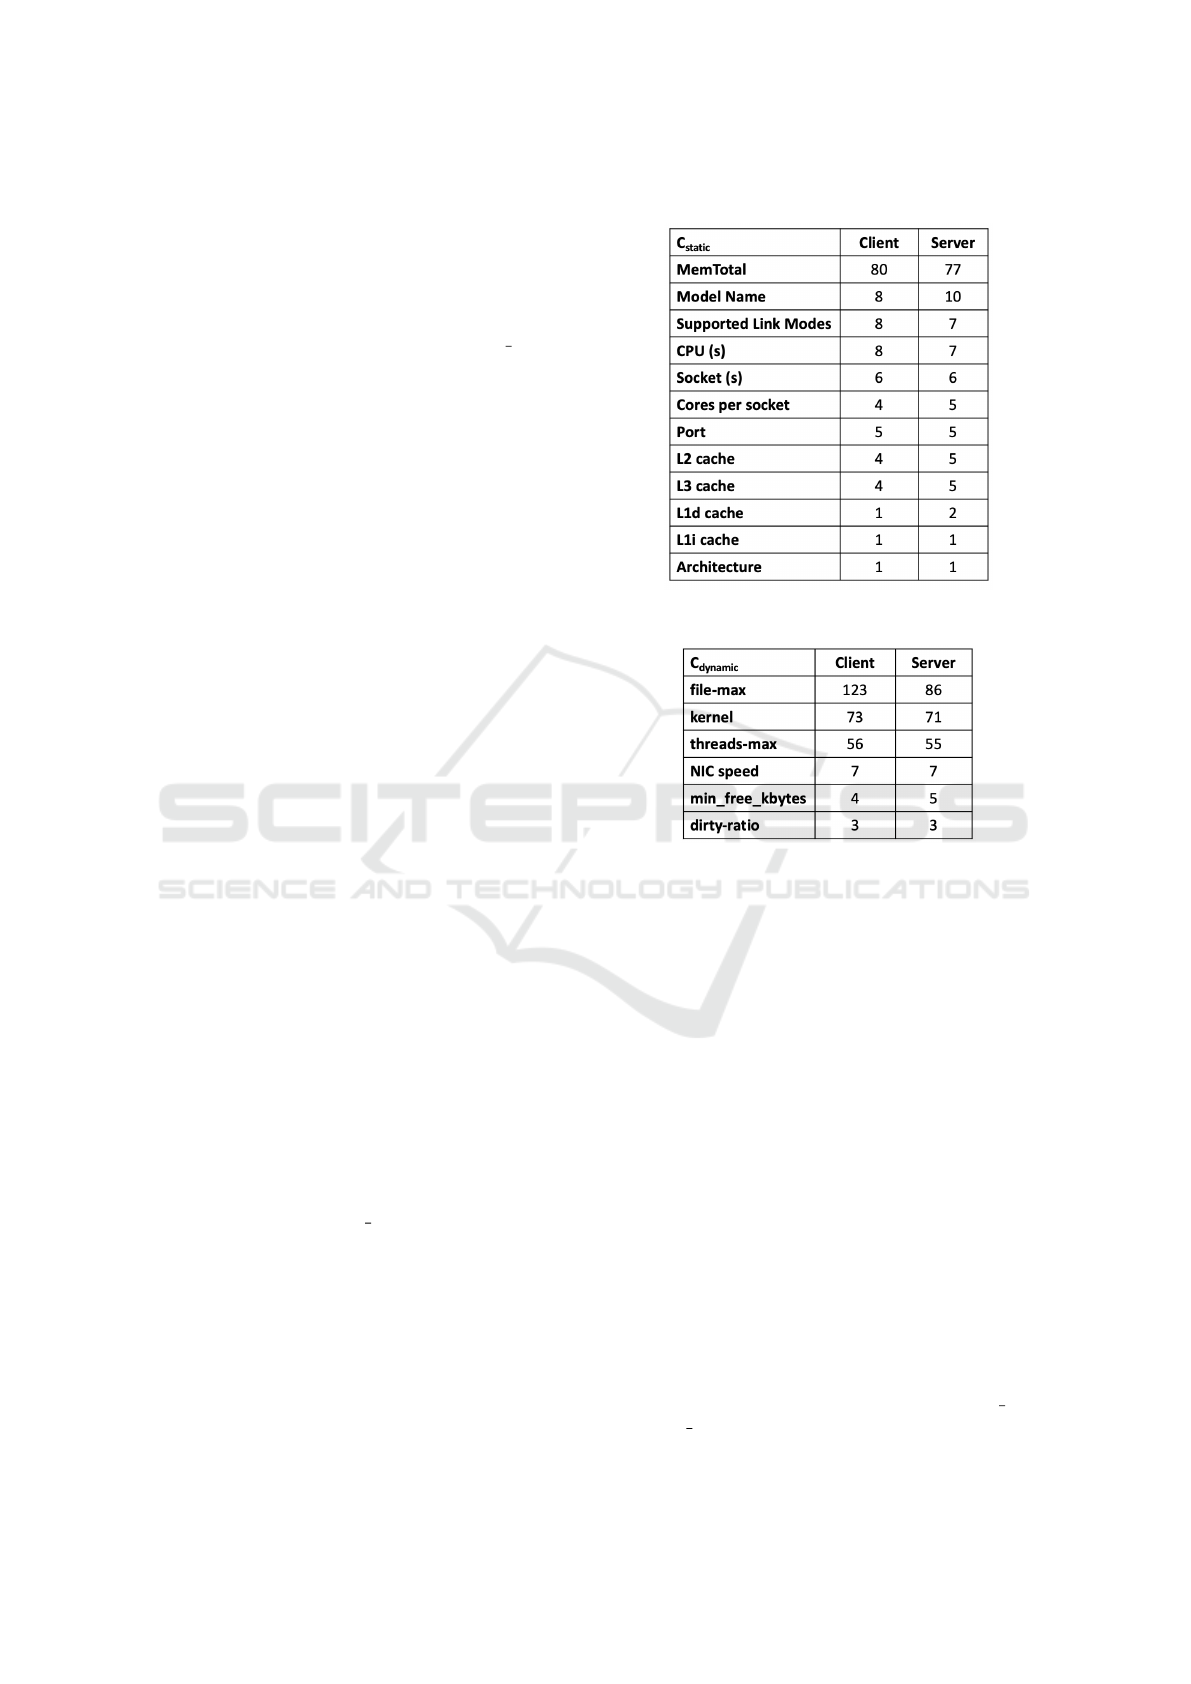
Table 4 shows the number of unique values for
each of the static parameters in our dataset. As shown,
the only static parameter with more than 10 unique
values is MemTotal. Some parameters have miss-
ing values in the dataset. NIC parameters have 7.1%
missing values whereas L3 cache has only 3% miss-
ing values. The values for all other parameters in-
cluding sizes for all other caches in the system are
available.
5.2 Linux Configurations
To make useful configuration recommendations, we
required a rich dataset comprising of several com-
binations of configuration values. To quantify the
Table 4: Counts of unique values for static parameters.
Table 5: Counts of unique values for dynamic parameters.
diversity of Linux configurations in our dataset, we
counted the number of unique values for each of the
configuration parameters that we shortlisted for our
tuning recommendations. As the results show in Ta-
ble 5, there are only three configuration parameters
for the client and the server with more than 10 unique
values. These are file-max, kernel and threads-max.
For brevity, we did not include counts in the table for
all the parameters with 1 or 2 unique values. None
of the dynamic parameters have any missing values
in the dataset except parameters associated with the
network interface card i.e. NIC speed, NIC Duplex
and NIC Auto-negotiation. For client, each one of
them has 7.1% missing values while for the server,
they only have 6.5% missing values.
5.3 Workload
While uperf takes in seven fields as input as shown
in Table 1, some of these parameters like client or
server are only there to identify the end hosts for com-
munication. Similarly, the runtime field specifies for
how long the workload should run. The workload
is mainly generated based on four fields: test type,
message size, instances (open connections per host)
Linux Configuration Tuning: Is Having a Large Dataset Enough?
775
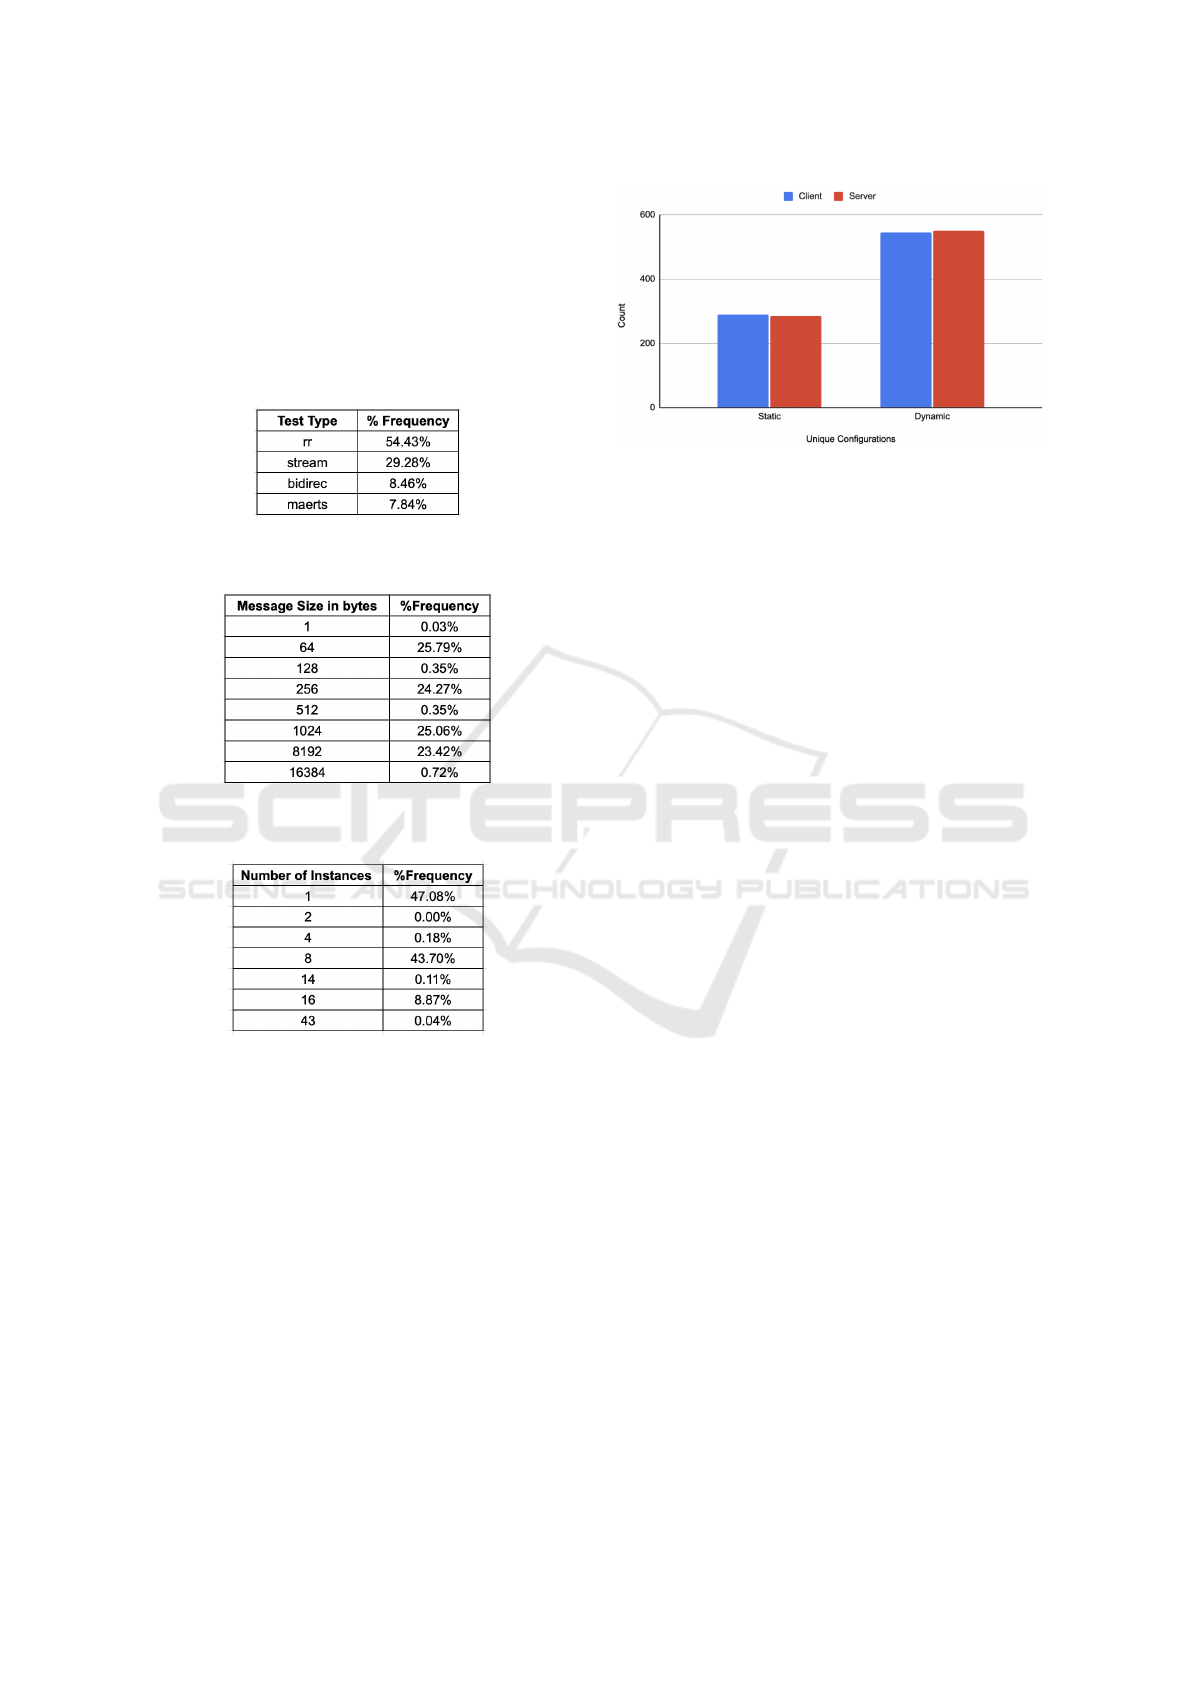
and the type of network protocol. The unique values
for these fields and their percentage frequency in the
dataset is shown in Tables 6, 7 and 8. As shown
in Table 6, rr (request-response traffic) is the most
frequently occurring test type. For this particular test
type, we have separate records for throughput and la-
tency performance measurements.
Table 6: Distribution of different test types in the dataset.
Table 7: Distribution of different message sizes in the
dataset.
Table 8: Distribution of different number of instances in the
dataset.
For message size, there are only four values in
bytes that have been tested frequently in the dataset,
64, 256, 1024 and 8192. The message size of 1 byte
was only tested once and may have been used for a
sanity check. Our results for instances show that a
large number of tests only used 1, 8 or 16 open con-
nections for communication with 1 being the most
frequently occurring value. All the remaining val-
ues other than these three have been used < 1% in
the dataset. For the network protocol, UDP was only
used in 2% of the tests. In all the remaining tests, TCP
was used for communication.
5.4 Diversity in Complete Dataset
It may seem based on the diversity results that we may
have a large number of unique static and dynamic
Figure 5: Count of unique static and dynamic configura-
tions in the dataset.
configurations in our dataset. Fig 5 shows the total
number of unique static and dynamic configurations
for the clients and the servers included in our dataset.
We found only about 300 unqiue static configurations
for the client and the server in our dataset of 133, 555
records. The number of dynamic configurations are
almost double the number of static configurations, but
they are still not diverse enough to make meaningful
recommendations.
For further analysis, we also looked into workload
diversity. We found 131 different workload combi-
nations part of the dataset. These were tested with
a total of 126 unique client and server pairs. When
we looked at the unique machine IDs in our dataset,
they came out to be 23 for both client and server.
This indicated that a large number of these tests were
conducted on the same physical hosts but with a few
changes in static and dynamic configurations. Our re-
sults also showed that the dataset contained 63 and 65
unique NICs for client and server respectively. Since
a large number of the machines in our dataset have
more than one NIC, our results show that the users
used different NICs for different tests.
Based on this analysis, we can conclude that there
is insufficient diversity of hardware and Linux pa-
rameters in our dataset that might affect workload re-
sponse, as well as insufficient variety of workloads
that could judge the values of those parameters. We
wondered if this was only true for the network bench-
mark data, and our preliminary results showed that the
filesystem benchmark similarly lacked diversity.
6 VISUALIZATION AND TRENDS
IN THE DATASET
Pbench measures both throughput and latency for a
transactional workload. In this section, we discuss
some of the visualizations created by combining dis-
ICPRAM 2024 - 13th International Conference on Pattern Recognition Applications and Methods
776
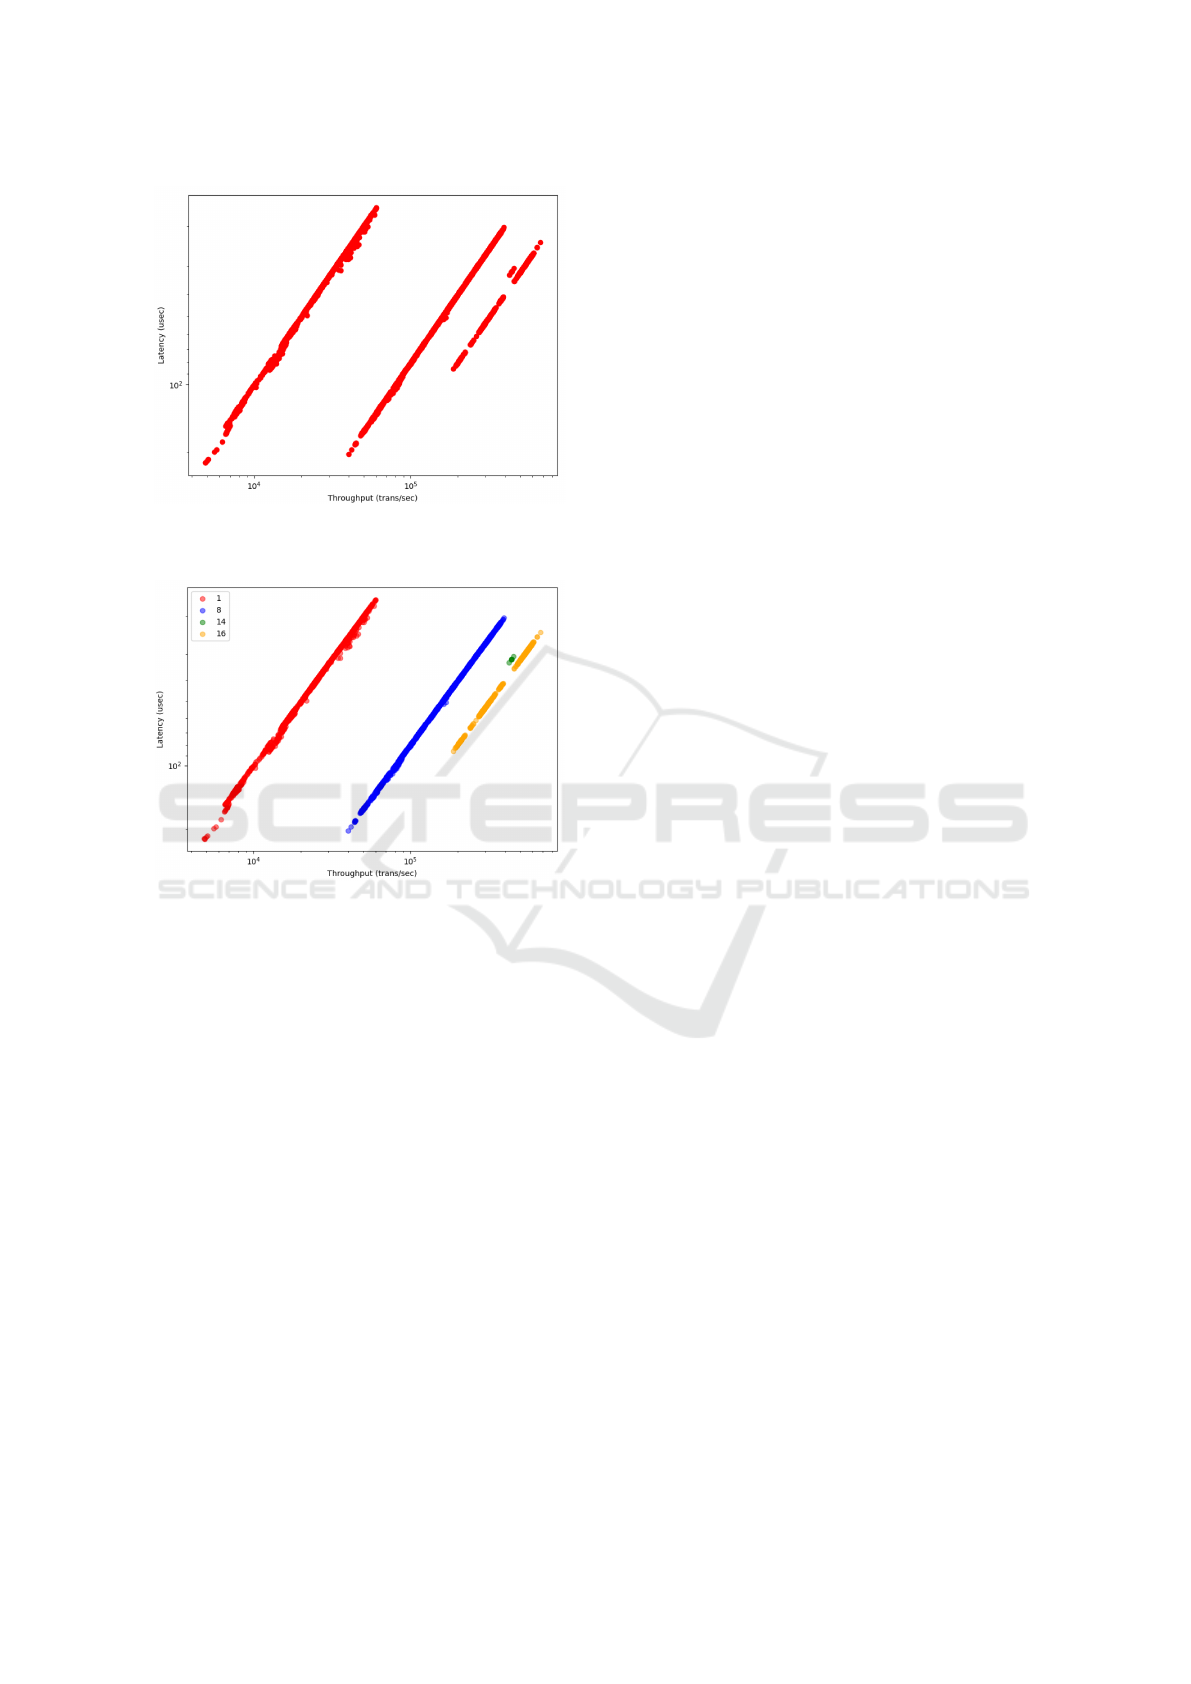
Figure 6: Throughput vs Latency for transactional work-
load.
Figure 7: Number of instances causes clusters.
tinct records of throughput and latency results for the
same hardware, configuration and workload. The pur-
pose of creating these visualizations is to study the
space of results for various configurations because
most of the users are interested in a balance between
latency and throughput. Figure 6 shows the log scale
distribution of throughput and latency results in our
dataset for the transactional workload. We were sur-
prised by the multiple populations in these plots. Fur-
ther investigation showed that one of the workload pa-
rameters, instances per host, was responsible for clus-
ters in the results as shown in Figure 7.
The different clusters formed due to change in
number of instances in Figure 6 have a linear cor-
respondence in log space. If a user uses the same
hardware and dynamic configuration with the same
workload, only changing the number of instances will
move the results from one cluster to another. This
information could in principle be used to extrapolate
predictions for workload combinations with varying
numbers of instances that are not already measured.
7 RELATED WORK
To achieve optimal performance for distributed appli-
cations, it is necessary to use suitable hardware and
settings for different configuration parameters of the
systems involved. It is an extremely challenging task
to tune these settings because of the large parameter
space (Acher et al., 2019b) and the complex interac-
tions between them. While there has been much work
done in the area of tuning configurations (Chase et al.,
2001), (Xi et al., 2004), (Acher et al., 2019a), (Chen
et al., 2009), (Zhu et al., 2017), the efforts have gen-
erally been focused on the application or the transport
layer of the system. Reference (Ozisikyilmaz et al.,
2008) uses a set of hardware parameters to predict
performance for system design alternatives of single
and multi-processor systems, but it does not take sys-
tem configuration parameters into account or recom-
mend hardware based on performance requirements.
Reference (Cao et al., 2020) did some work in identi-
fying important tuning parameters for the storage sys-
tem and (Cao et al., 2018) applied several optimiza-
tion algorithms to tune the storage system. However,
we have not come across any work that focuses on
tuning Linux system configuration to improve net-
work performance and that uses a large previously
collected dataset to do so instead of traditional opti-
mization methods.
8 CONCLUSION AND FUTURE
WORK
We began this work with the goal of tuning system
configuration for improved network performance. We
began with a large dataset of network benchmark runs
provided by Red Hat. To recommend settings for
Linux configuration, we selected a subset of hardware
and Linux parameters based on feedback from experts
and performance tuning guide by Red Hat. We used
various tree-based feature selection methods to iden-
tify the parameters that impact network performance
significantly. Our results showed that all significant
parameters are part of the hardware configuration, and
none of them concern Linux configuration. Investi-
gating these results, we found that our dataset lacked
in diversity for Linux configurations. Visualizing the
data revealed a few other trends and limitations of our
dataset. Based on these experiments and their out-
comes, we concluded that the users of Pbench did
not alter the system configurations substantively and
that one should not take data diversity, even of huge
datasets, for granted. If we had attempted machine
learning with this dataset, it would have failed.
Linux Configuration Tuning: Is Having a Large Dataset Enough?
777

One limitation of our work is that we only looked
at Pbench data, available to us through Red Hat.
There might be other datasets out there that might be
a better fit for Linux configuration tuning, but these
are not easily available due to privacy concerns. If
a sufficiently diverse dataset becomes available, we
would like to attempt tuning with that data as future
work. Also, our analysis of the dataset filters features
by correlation and thus might ignore non-linear re-
lationships. These could be studied in the future as
well.
REFERENCES
Acher, M., Martin, H., Alves Pereira, J., Blouin, A., Ed-
dine Khelladi, D., and J
´
ez
´
equel, J.-M. (2019a). Learn-
ing From Thousands of Build Failures of Linux Kernel
Configurations. Technical report, Inria ; IRISA.
Acher, M., Martin, H., Pereira, J. A., Blouin, A., J
´
ez
´
equel,
J.-M., Khelladi, D. E., Lesoil, L., and Barais, O.
(2019b). Learning Very Large Configuration Spaces:
What Matters for Linux Kernel Sizes. Research re-
port, Inria Rennes - Bretagne Atlantique.
Agarwal, R. The 5 feature selection algorithms every data
scientist should know. https://towardsdatascience.c
om/the-5- feature-selection-algorithms- every-dat
a-scientist-need-to-know-3a6b566efd2. [Accessed
12-11-2021].
B.V, E. The heart of the free and open elastic stack. https:
//www.elastic.co/elasticsearch/. [Accessed 03-08-
2020].
B.V, E. Your window into the elastic stack. https://www.el
astic.co/kibana. [Accessed 05-01-2020].
Cao, Z., Kuenning, G., and Zadok, E. (2020). Carver: Find-
ing important parameters for storage system tuning. In
18th USENIX Conference on File and Storage Tech-
nologies (FAST 20), pages 43–57, Santa Clara, CA.
USENIX Association.
Cao, Z., Tarasov, V., Tiwari, S., and Zadok, E. (2018).
Towards better understanding of black-box Auto-
Tuning: A comparative analysis for storage sys-
tems. In 2018 USENIX Annual Technical Confer-
ence (USENIX ATC 18), pages 893–907, Boston, MA.
USENIX Association.
Chase, J., Gallatin, A., and Yocum, K. (2001). End system
optimizations for high-speed tcp. IEEE Communica-
tions Magazine, 39(4):68–74.
Chen, H., Jiang, G., Zhang, H., and Yoshihira, K.
(2009). Boosting the performance of computing sys-
tems through adaptive configuration tuning. In Pro-
ceedings of the 2009 ACM Symposium on Applied
Computing, SAC ’09, page 1045–1049, New York,
NY, USA. Association for Computing Machinery.
Corporation, S. P. E. Spec’s benchmarks and tools. https:
//www.spec.org/benchmarks.html. [Accessed 03-10-
2021].
Mesnier, M. P., Wachs, M., Sambasivan, R. R., Zheng,
A. X., and Ganger, G. R. (2007). Modeling the rela-
tive fitness of storage. In Measurement and Modeling
of Computer Systems.
Nadgir, N., Tuxen, M., and Kononenko, V. (2009). uperf.
https://github.com/uperf/uperf. [Accessed 08-25-
2019].
Ozisikyilmaz, B., Memik, G., and Choudhary, A. (2008).
Machine learning models to predict performance of
computer system design alternatives. In 2008 37th In-
ternational Conference on Parallel Processing, pages
495–502.
RedHat (2018). Performance tuning guide for rhel 7. https:
//access.redhat.com/documentation/en-us/red\ hat
\ enterprise\ linux/7/html/performance\ tuning\ g
uide/index. [Accessed 07-16-2019].
Reeves, B. M., Hunsaker, J., Moravec, P., and Castillo, J.
(2014). Sos. https://github.com/sosreport/sos. [Ac-
cessed 04-02-2020].
Saboori, A., Jiang, G., and Chen, H. (2008). Autotun-
ing configurations in distributed systems for perfor-
mance improvements using evolutionary strategies.
In 2008 The 28th International Conference on Dis-
tributed Computing Systems, pages 769–776.
Team, G. L. Understanding xgboost algorithm — what is
xgboost algorithm? https://www.mygreatlearning.co
m/blog/xgboost-algorithm/. [Accessed 06-15-2019].
Theurer, A., Portante, P., Dokos, N., and Rister, K. (2015).
pbench. https://github.com/distributed-system-analy
sis/pbench. [Accessed 06-09-2019].
Xi, B., Liu, Z., Raghavachari, M., Xia, C. H., and Zhang, L.
(2004). A smart hill-climbing algorithm for applica-
tion server configuration. In Proceedings of the 13th
International Conference on World Wide Web, WWW
’04, page 287–296, New York, NY, USA. Association
for Computing Machinery.
Yiu, T. Understanding random forest: how the algorithm
works and why it is so effective. https://towardsdatas
cience.com/understanding-random-forest-58381e060
2d2. [Accessed 08-10-2019].
Zhu, Y., Liu, J., Guo, M., Ma, W., and Bao, Y. (2017). Acts
in need: Automatic configuration tuning with scal-
ability guarantees. In Proceedings of the 8th Asia-
Pacific Workshop on Systems, APSys ’17, New York,
NY, USA. Association for Computing Machinery.
ICPRAM 2024 - 13th International Conference on Pattern Recognition Applications and Methods
778
