
Comparison of Different Data Augmentation Techniques for Improving
Epileptic Seizure Detection Based on 3D Acceleration, Heart Rate and
Temperature Data
Maleyka Seyidova
1,2
, Jasmin Henze
1 a
, Arne Pelzer
3 b
and Beate Rhein
2
1
Department of Healthcare, Fraunhofer Institute for Software and Systems Engineering (ISST), Speicherstraße 6,
44147 Dortmund, Germany
2
Institute of Computer and Communication Technology (ICCT), Faculty of Information, Media and Electrical Engineering,
TH K
¨
oln - Cologne University of Applied Sciences, Betzdorfer Straße 2, 50679 Cologne, Germany
3
Branch for Hearing, Speech and Audio Technology HSA, Fraunhofer Institute for Digital Media Technology (IDMT),
Marie-Curie-Straße 2, 26129, Oldenburg, Germany
Keywords:
Data Augmentation, Epileptic Seizure Detection, Imbalanced Data, Convolutional Neural Networks.
Abstract:
Epilepsy, characterized by recurrent seizures, poses a significant risk to an individual’s safety. To mitigate
these risks, one approach is to use automated seizure detection systems based on Convolutional Neural Net-
works (CNN), which rely on large amounts of data to train effectively. However, real-world seizure data
acquisition is challenging due to the short and infrequent nature of seizures, resulting in a data imbalance
which complicates accurate seizure detection. In this paper, various data augmentation techniques were uti-
lized to increase the amount of training data for CNN, aiming to investigate the potential of these techniques to
enhance the performance of the seizure detection algorithm by providing more seizure data. For this purpose,
two datasets, a unimodal (3D acceleration) and a multimodal dataset (3D acceleration, heart rate and tem-
perature), were used. To evaluate the effect of the different augmentation techniques, a CNN trained without
augmented data was used as a baseline. Experiments showed that data augmentation techniques improved the
seizure detection by lowering the baseline’s false alarm rate while maintaining its high sensitivity. The best
results were achieved with a combination of Rotation and Permutation in the multimodal dataset and Rotation,
as well as Magnitude Warping, in the unimodal dataset.
1 INTRODUCTION
Epilepsy is one of the most common neurologi-
cal disorders, affecting 50 million people worldwide
(McGeehan, 2018). One of the disease’s symptoms
are recurrent seizures. Epileptic seizures that involve
involuntary body movements can sometimes be ac-
companied by a loss of consciousness, have the poten-
tial to cause severe injuries and create life-threatening
situations. (Ahmad et al., 2022; Sazgar and Young,
2019; Beniczky et al., 2021; Schulze-Bonhage et al.,
2010)
Diagnosis and treatment of epilepsy highly de-
pend on accurate information about the seizures that
occur. Since patients regularly do not notice or for-
get that a seizure happened, automatic seizure detec-
a
https://orcid.org/0000-0001-7180-2578
b
https://orcid.org/0009-0006-4834-2618
tion could improve seizure documentation and by that
also diagnosis and treatment. (Ramgopal et al., 2014;
Bidwell et al., 2015)
To develop automated seizure detection systems,
an algorithm needs to be trained on the seizure data.
However, collecting real seizure data presents chal-
lenges. Acquiring real epileptic seizure data is costly
and time-consuming for medical experts and patients
(Siddiqui et al., 2020). Moreover, the unpredictable
and brief nature of seizures, often lasting mere sec-
onds to minutes, results in highly imbalanced datasets
with a skewed seizure and non-seizure distribution
(Siddiqui et al., 2020). This poses a significant
challenge for accurate seizure detection, as the algo-
rithm may be biased towards the majority class (non-
seizure), leading to suboptimal performance in detect-
ing the minority class instances (seizure) (Siddiqui
et al., 2020). Additionally, neural networks need large
numbers of training data to perform well. A promis-
142
Seyidova, M., Henze, J., Pelzer, A. and Rhein, B.
Comparison of Different Data Augmentation Techniques for Improving Epileptic Seizure Detection Based on 3D Acceleration, Heart Rate and Temperature Data.
DOI: 10.5220/0012386800003657
Paper published under CC license (CC BY-NC-ND 4.0)
In Proceedings of the 17th International Joint Conference on Biomedical Engineering Systems and Technologies (BIOSTEC 2024) - Volume 2, pages 142-153
ISBN: 978-989-758-688-0; ISSN: 2184-4305
Proceedings Copyright © 2024 by SCITEPRESS – Science and Technology Publications, Lda.

ing strategy to address these issues is to increase the
number of seizure samples by generating seizure data
synthetically by utilizing time series data augmenta-
tion techniques to achieve a better classification per-
formance. (Wen et al., 2021)
The MOND project, building on the results of
the EPItect project, works on developing an auto-
mated mobile method for detecting epileptic seizures
that is suitable for everyday use (Fraunhofer, 2023).
It employs an In-Ear sensor by cosinuss°, which is
equipped to measure 3D acceleration, photoplethys-
mography (PPG) and temperature. A previous uni-
modal approach achieved a sensitivity of 65.1% for
the detection of tonic-clonic seizures based on 3D ac-
celeration data (Houta et al., 2019). A multimodal
approach using 3D acceleration and heart rate data
achieved a sensitivity of 100% with a false alarm rate
of 138FA/24h using conventional machine learning
techniques (Henze et al., 2021). In another study,
seizures with motor components were detected us-
ing a multimodal approach, leveraging 3D acceler-
ation, heart rate and temperature data. Deep learn-
ing techniques were applied and the best CNN model
achieved 86.66% sensitivity with a false alarm rate of
1,804FA/24h (B
¨
oring, 2021).
This work aimed to investigate the potential of dif-
ferent standard augmentation techniques to improve
the performance of seizure detection by increasing
the amount of data available for the MOND project.
It builds upon the best-performing CNN architecture
obtained in the previous work by B
¨
oring (2021). For
this purpose, real seizure samples are augmented via
standard augmentation techniques, such as Permuta-
tion, Rotation, Jittering, Time Warping, Magnitude
Warping and Window Slicing using a unimodal and
a multimodal dataset.
To avoid testing methodology that might result in
overly optimistic results, it is necessary to include dif-
ferent seizure types in the dataset (Shoeb and Gut-
tag, 2010). Therefore, this work focused on motor
epileptic seizures that include various seizure types.
This approach enabled the utilization of the majority
of data and different seizure types from the MOND
dataset before employing augmentation techniques.
2 RELATED WORK
In recent years, data augmentation has emerged as a
promising approach to tackle the challenges of insuf-
ficient seizure data and imbalanced seizure datasets.
(Lashgari et al., 2020)
In a survey conducted by Wen et al. (2021), data
augmentation was regarded as an effective method to
enhance both the quantity and quality of training data,
enabling the efficient use of deep learning models.
The study also demonstrated the effectiveness of data
augmentation in many time series classification prob-
lems where class imbalance is often observed.
Iwana and Uchida (2021) noted that many time se-
ries data augmentation techniques, like those for im-
ages, are based on random transformations. The sur-
vey presented Jittering as a frequently used method
and Permutation and Rotation as effective techniques
to be combined with other methods for sensor data
augmentation. The study emphasized that data aug-
mentation methods are task-dependent. The inher-
ent temporal dependency of time series data further
complicates the identification of effective methods for
specific tasks, such that different time series datasets
may have unique properties and not every transfor-
mation technique is applicable to every type of time
series dataset. For instance, the Jittering technique,
which involves adding noise, assumes that the time
series data patterns are naturally noisy, which may
be true for sensor data. On the other hand, Rotation
was mentioned to have a potentially detrimental effect
on some time series classification tasks where it can
cause a change in the label of the data.
In a paper on Parkinson’s disease monitoring via
the wearable sensor by Um et al. (2017), differ-
ent standard data augmentation methods were utilized
to augment the acceleration data. Combining vari-
ous data augmentation methods outperformed a sin-
gle data augmentation technique. The combination of
two techniques (Rotation and Permutation, Rotation
and Time Warping) achieved performance improve-
ment by 7.5-9.2% compared to the baseline. The best
performance among the combination of three tech-
niques was obtained using Rotation, Permutation and
Time Warping with an 86.88% accuracy. This was a
significant improvement over the baseline accuracy of
77.54%. (Um et al., 2017)
Despite efforts to use data augmentation tech-
niques in seizure detection, to our best knowledge,
data augmentation has not been used specifically for
acceleration data, heart rate and temperature in the
context of seizure detection. This work investigated
the potential of various standard augmentation tech-
niques to improve seizure detection using the same
data prepossessing pipeline and the best-performing
CNN model from previous work (B
¨
oring, 2021).
Comparison of Different Data Augmentation Techniques for Improving Epileptic Seizure Detection Based on 3D Acceleration, Heart Rate
and Temperature Data
143
3 MATERIALS AND METHODS
3.1 Dataset
The dataset used in this work consisted of five fea-
tures: 3D acceleration (acceleration along the x-axis,
y-axis and z-axis), temperature and heart rate. These
measurements were collected from epilepsy patients
at the Department of Epileptology at University Hos-
pital Bonn (Germany) through an In-Ear sensor from
cosinuss°. The sensor captured 3D acceleration at 50
Hz sampling frequency. Temperature is given in the
unit degree Celsius °C and was measured at a sam-
pling frequency of 1 Hz. Additionally, the heart rate,
computed from the prior 6 seconds of the PPG sig-
nal, was sampled at 1 Hz frequency. Heart rate data
is given in units of bpm (beats per minute) or min
−1
at a sampling frequency of 1 Hz with corresponding
quality indexes available in the dataset. Information
regarding the quality index is provided by the man-
ufacturer of the sensor. The measurements with a
quality index below 40 were considered inaccurate,
while those with a quality index above 65 were re-
garded as correct with a high degree of certainty. It
was not possible to draw any conclusions about the
accuracy of the heart rate measurements when they
fell within the range of 40 to 65. All data was avail-
able in the form of time series. Moreover, the records
of seizure events were separately available and anno-
tated via video-EEG by the clinicians. These records
provided information such as seizure starting time,
ending time, seizure types and additional event de-
tails. The dataset contained both the motor and non-
motor seizure types. However, this study aimed to
enhance the detection of motor seizures.
After excluding non-motor seizures, the dataset
retained four distinct types of motor seizure events:
• Tonic-clonic seizure (TCS): 11
• Focal impaired awareness seizure (FIAS): 70
• Focal aware seizure (FAS): 27
• Generalized motor seizure (GMS): 2
A total of 110 seizures from 45 patients remained.
The total duration of seizures is 2.675 hours with a
mean seizure length of 1.47minutes = 87seconds.
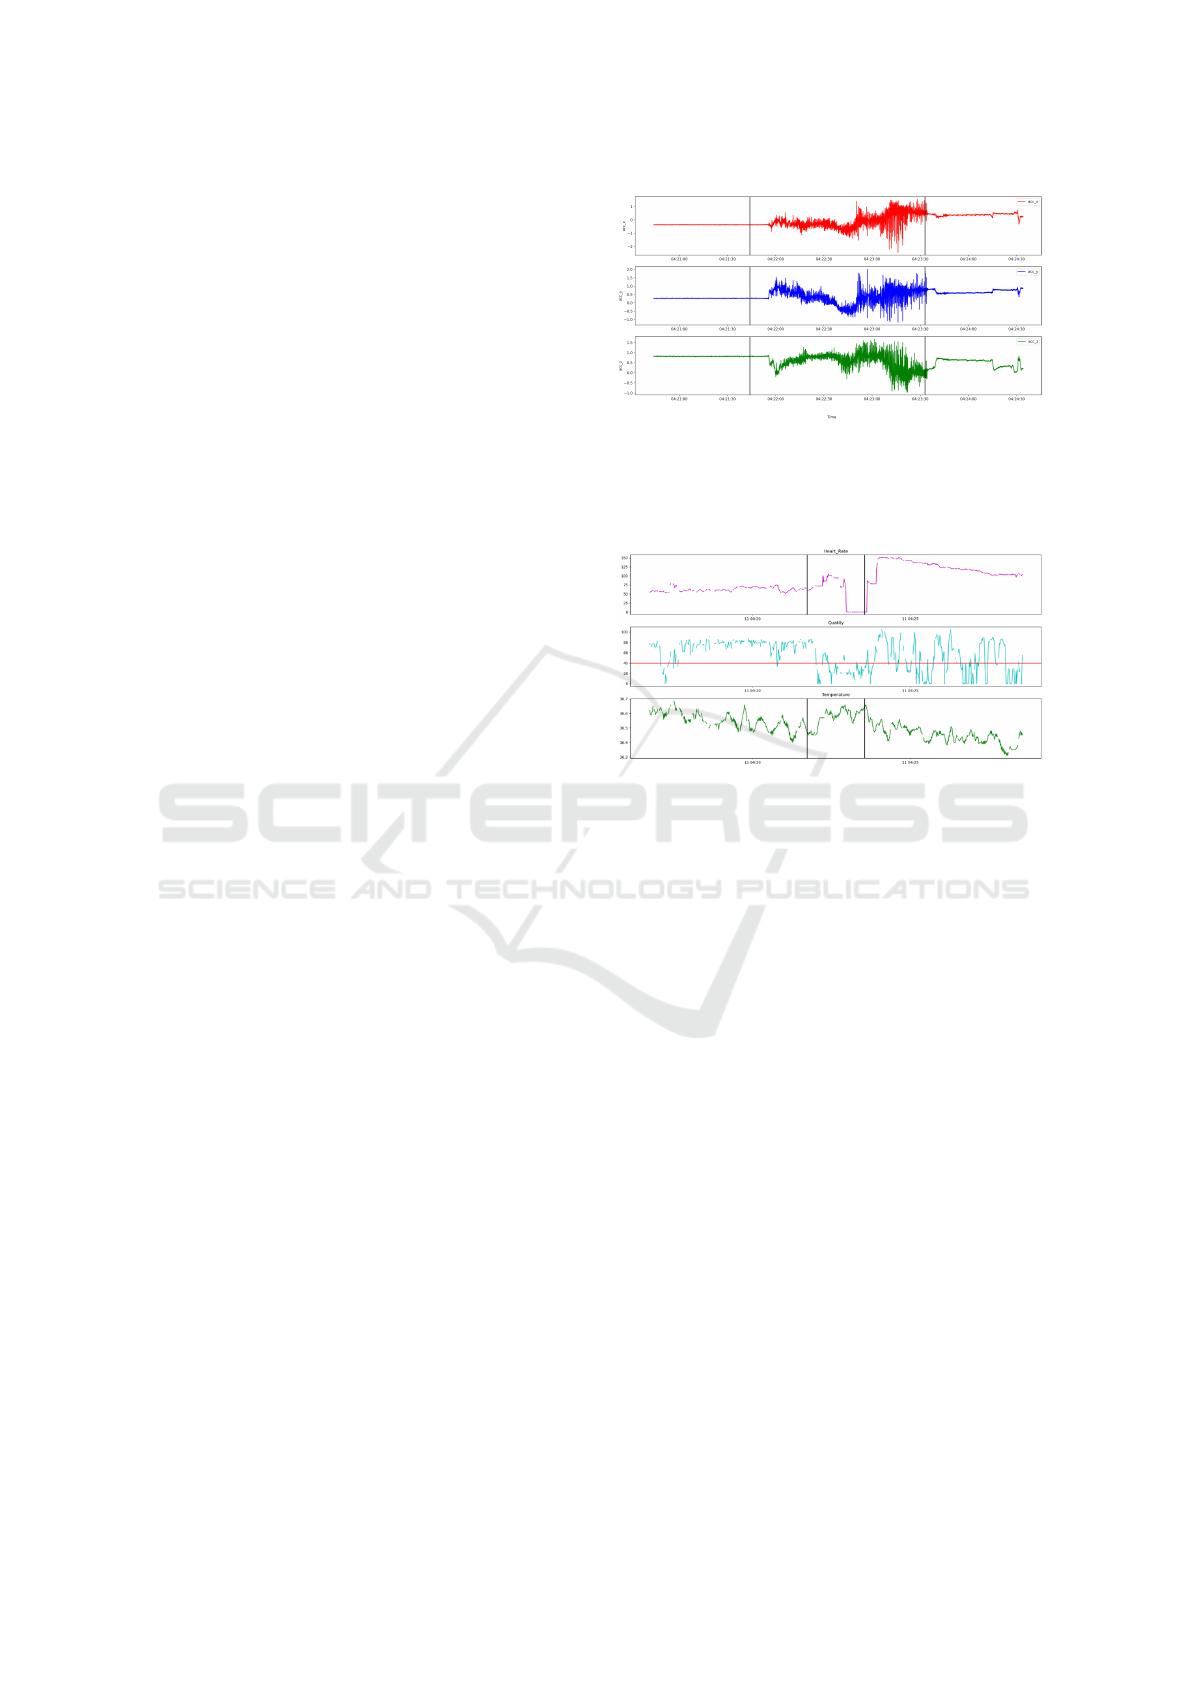
Figure 1 and Figure 2 show the stereotypical pat-
tern of a TCS seizure event for a patient from the
dataset, encompassing acceleration measurement in
x, y, z axis, heart rate and temperature. Acceleration
data for a TCS episode is depicted in Figure 1, begin-
ning with the tonic phase, indicating muscle stiffening
and progressing to the clonic phase, which is charac-
terized by rhythmic muscle jerking that increases in
intensity and magnitude. Figure 2 shows a segment
Figure 1: Section of raw 3D acceleration data of a pa-
tient.The acceleration along the x−, y−, and z− axes are
represented on the y-axis in gravity units, while the x-axis
shows the recording time. The region within two black ver-
tical lines is the TCS event experienced by the patient.
Figure 2: Section of heart rate, quality and temperature for
patient during the TCS event. The y-axis for the top (ma-
genta) plot represents heart rate in beats per minute (bpm).
The quality is given in the middle (cyan) plot. The red line
in the quality plot represents the minimum accepted qual-
ity=40. The y-axis of the third (green) plot represents tem-
perature in degrees Celsius °C.
of heart rate data plotted over time with corresponding
quality values during the same seizure. The quality of
heart rate readings was diminished during the seizure
event, falling below the quality index. Since the heart
rate data was collected based on the PPG signals,
movement during the seizure could cause the photodi-
ode to shift, likely contributing to the data’s low qual-
ity (Henze et al., 2021). Additionally, the body tem-
perature rose during the seizure and decreased after
the event.
3.2 Data Preparation
The data preparation strategy used in this work was
like that in previous work (B
¨
oring, 2021). The raw
data was cleaned to remove duplicate sensor record-
ings, followed by a windowing process. In this work,
each patient’s recording was divided into 10-second
windows without overlap.
An important aspect to consider when dividing the
data into windows was the presence of missing time
steps. These missing values could be caused by sen-
HEALTHINF 2024 - 17th International Conference on Health Informatics
144

sor errors during the observation time of the patient.
Consequently, the windowing process led to some
windows containing incomplete or missing data. To
ensure the integrity of the data used in the analysis,
we addressed the issue of missing time steps. This
included considering the sampling frequency of the
sensor and calculating the expected number of values
within each window. For example, with a 50 Hz sam-
pling frequency for acceleration, a 10-second window
should contain 500 values. Likewise, for heart rate
and temperature with a 1 Hz sampling frequency, the
expected number of values was 10. To further ensure
that the windows used in the analysis represent the pa-
tient’s condition, a threshold was set at 15% (B
¨
oring,
2021). Windows with more than 15% missing values
within a window were discarded. If a window had
less than 15% missing values, linear interpolation was
used. This ensured that the CNN received windows of
consistent size.
This 15% threshold determined whether a window
should be discarded or interpolated. A smaller thresh-
old resulted in more windows being discarded, while
a larger threshold resulted in more interpolated val-
ues, potentially skewing the analysis and misrepre-
senting the patient’s biodata. If a window was rejected
due to excessive missing data, the window continued
to slide along the time series until a section was found
that met the threshold criteria. This approach helped
to ensure that as much data as possible was utilized in
the analysis while also maintaining the integrity of the
data by discarding windows with many missing val-
ues. In the multimodal case, the whole window was
discarded if data from at least one of the modalities
(3D acceleration, heart rate or temperature) was miss-
ing. Due to that, the unimodal dataset consisted of
more samples than the multimodal dataset since there
were more missing values within the heart rate and
temperature data than in the 3D acceleration data. In
the window generation process described above, each
window was assigned a class label (0: non-Seizure,
1: Seizure). The window was labelled as seizure if
any part of the window fell within the seizure inter-
val (B
¨
oring, 2021). The window was labelled as a
non-seizure if there was no overlap between it and a
seizure interval.
3.2.1 Multimodal Dataset
For the multimodal approach (3D acceleration, heart
rate and temperature), the data preparation process
resulted in a total of 785 seizure and 584,737 non-
seizure windows. In total, there were 1626.45 hours
of measurements, of which approximately 2.18 hours
belonged to motor seizures. A total of 88 seizure
events remained inside the data after data preparation
steps with the following distribution:
• FIAS: 54
• FAS: 21
• TCS: 11
• GMS: 2
3.2.2 Unimodal Dataset
For the unimodal dataset consisting only of 3D ac-
celeration, data preparation gave 941 seizure and
648,399 non-seizure windows. Out of 1803.72 hours
of total measurements, approximately 2.61 hours be-
longed to motor seizures. A total of 94 seizure events
were identified in the data, with the following distri-
bution:
• FIAS: 60
• FAS: 21
• TCS: 11
• GMS: 2
3.3 Data Augmentation Methods
Data augmentation is a technique used to artificially
increase the size of a dataset by creating modified
versions of existing data. In the context of imbal-
anced dataset distributions, data augmentation allows
additional data to be generated for underrepresented
classes, creating a more balanced dataset. Several
studies have shown that data augmentation techniques
can improve the generalizability of deep learning net-
works, thereby reducing overfitting and enabling the
networks to handle imbalanced datasets more effec-
tively. (Blagus and Lusa, 2013; Hasibi et al., 2019;
Shorten and Khoshgoftaar, 2019)
While the choice of data augmentation techniques
for time series data depends on the dataset’s proper-
ties and the task at hand, several basic techniques have
been identified in this area.(Iglesias et al., 2023; Um
et al., 2017).
Jittering is a type of magnitude domain trans-
formation that creates novel time series by introduc-
ing noise at every time step of the initial time series
(Iwana and Uchida, 2021). Rotation is a magnitude
domain transformation achieved by applying a Rota-
tion matrix with a defined angle to multivariate time
series data (Um et al., 2017). In Permutation, the
time series segments are rearranged to produce a new
pattern (Um et al., 2017). The segments can be of
equal or variable size. To create a new time series
using the Permutation technique, the original time se-
ries is divided into N segments and then randomly re-
arranged. However, this random rearrangement does
Comparison of Different Data Augmentation Techniques for Improving Epileptic Seizure Detection Based on 3D Acceleration, Heart Rate
and Temperature Data
145

not maintain the temporal dependencies in the origi-
nal time series (Iglesias et al., 2023).
Time Warping is perturbing the pattern in the
temporal dimension. The timesteps are either
stretched or contracted to generate a new pattern.
Magnitude Warping is a type of magnitude domain
transformation that warps the magnitude of each time
series by convolving with smooth curves. Lastly, the
Window Slicing augmentation technique involves the
removal of a portion of a data sample to create an en-
tirely new sample.
Multiple techniques can be applied sequentially to
the original time series to create transformed time se-
ries data.
For augmentation, the entire seizure intervals were
used instead of the segmented windows. One rea-
son for this is that the windows were obtained af-
ter interpolation and only represent a portion of the
seizure interval. Applying the transformation on each
portion separately might not have resulted in a good
quality synthetic seizure sample. To ensure the max-
imum quality of the generated sample, the augmen-
tation techniques were applied directly to the whole
seizure interval before windowing.
3.4 Evaluation Procedure
This study used a Convolutional Neural Network
(CNN) as a binary classifier to determine whether a
given window belonged to a seizure or a non-seizure
event. To assess the effectiveness of the augmen-
tation techniques, the CNN was trained with aug-
mented data and the performance was compared with
the baseline results (CNN trained only with the origi-
nal data).
Some metrics are commonly used in seizure de-
tection (Sun et al., 2009; Henze et al., 2021):
• Sensitivity
seizure
: Number of all detected seizures
/ Number of all seizures
• FA/24h: Number of false alarms per 24 hours
• Sensitivity: Number of all detected seizure win-
dows / Number of all seizure windows
• Specificity: Number of all correctly classified
non-seizure windows / Number of all non-seizure
windows
In seizure detection, the main objective is to deter-
mine if a seizure is detected as a whole event rather
than assessing the performance on individual sam-
ples (windows). In this research, a seizure was con-
sidered as detected if at least one sample (window)
within the entire seizure interval was correctly clas-
sified. Based on this, a metric referred to as seizure
sensitivity (Sensitivity
seizure
) was calculated. This in-
forms about the proportion of seizures that are cor-
rectly classified. The metric Sensitivity refers to win-
dow sensitivity, which is the proportion of seizure
windows that are correctly classified. Specificity is
the proportion of non-seizure windows that are cor-
rectly classified.
Another metric of particular importance in the
case of seizure detection is the false alarm rate, which
is the number of false alarms (non-seizure predicted
as a seizure) within a 24-hour interval. In this re-
search, the false alarm rate for 24 hours was based on
the average length of the seizure interval (90s). In this
context, if any non-seizure window was misclassified
within each non-overlapping 90-second interval, the
entire interval was counted as a single false alarm.
Following this, the total count of false alarms was di-
vided by the total measurement duration in days to get
a False Alarm Rate per 24 hours (FA/24h). Sensitivity
and false alarm rate are the metrics that are often used
in reporting seizure detection systems (Beniczky and
Ryvlin, 2018).
4 EXPERIMENTS
4.1 Augmentation of Seizures
Each seizure event was augmented to create a syn-
thetic seizure. Different random parameter values
were used for each data augmentation technique.
For Jittering, the noise was generated from a nor-
mal distribution of chosen mean and standard devia-
tion. The mean was set at 0. The study by Um et
al. (2017) used a standard deviation value of 0.03,
whereas, in this work, standard deviation values of
0.02 and 0.05 were used to evaluate the impact of dif-
ferent noise levels in the data. By using different val-
ues of standard deviation, we were able to examine
the effect of low and high noise levels on the mod-
els’ performance. The generated noise was added to
each channel at every time step of the original seizure
sample.
Rotation was performed using a Rotation matrix
formed through angles and axes. The angle was
drawn uniformly from the interval [-π, π] while the
axis was chosen within a uniform distribution be-
tween [-1,1].
In the implementation of Permutation, the original
seizure sample was rearranged into a new time series
by dividing it into a specified number of segments and
randomly rearranging the order of the segments. The
minimum length of each segment was set to a speci-
fied value. The minimum length of each segment was
HEALTHINF 2024 - 17th International Conference on Health Informatics
146
fixed at 10 while the number of segments N was tested
at values of 2, 3, and 5
Random sinusoidal curves were generated using
arbitrary amplitude, frequency and phase values for
Magnitude- and Time-Warping.
Window Slicing croped the time series data to
90% of its original length. The starting point of the
Window Slicing was selected randomly and the re-
maining 10% of data was removed from either end.
To facilitate a direct comparison with other data aug-
mentation methods, the cropped time series was then
linearly interpolated back to its original length.
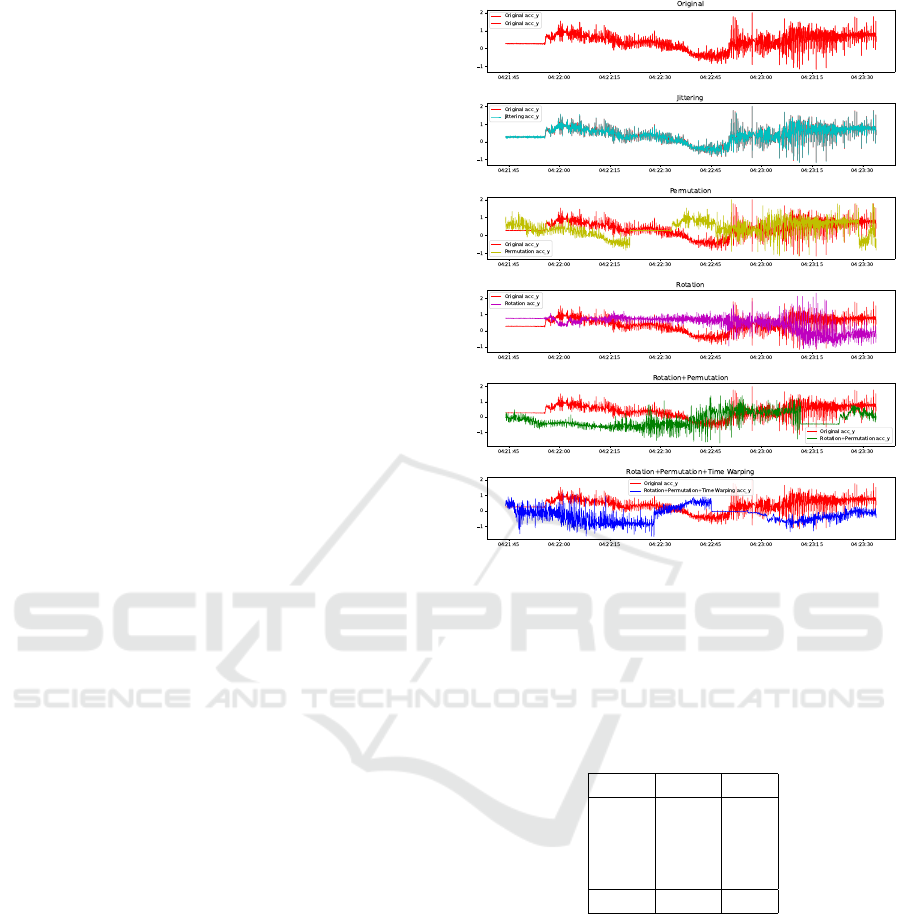
Figure 3 depicts the application of some single and
combined data augmentation techniques on the accel-
eration data in the y-axis, showing how those tech-
niques transform the original seizure data.
Some augmentation techniques, like Magnitude
and Time Warping, were applied only to the unimodal
dataset since the library from Um et al. (2017) that
was used for implementation did not support those
operations in our multimodal case. Additionally, Ro-
tation was not applied to heart rate and temperature
data to avoid unrealistic values like a decreasing heart
rate at the start of a seizure while it usually goes up.
1x, 2x, 4x and 8x proportion of augmented seizure
samples (1x, 2x, 4x and 8x as many augmented
seizure samples as real seizure samples) were gen-
erated from each technique for unimodal and multi-
modal datasets. For techniques only applicable to 3D
acceleration data, to create the augmented samples for
the multimodal dataset, the heart rate and temperature
were kept the same as the original and the transfor-
mation was only applied to the 3D acceleration data.
These samples then underwent the windowing pro-
cess and resulting windows were added to the original
data before training.
4.2 Train-Test Split
Both unimodal and multimodal dataset were divided
into two parts: a train set and a hard-coded test set.
Within the training set, 20% was reserved as a vali-
dation set to optimize model performance. The train-
ing data was used to train the model, while the test
data was used to evaluate the model’s performance
on previously unseen data. Training and evaluating
the model with data from the same patients existing
both in the train and test set can give over-optimistic
results. This is because values measured from an in-
dividual patient can be highly correlated due to their
unique characteristics. To address this, train-test split
was done based on distinct patients, not individual
data windows.
Figure 3: Example of a single and combined standard time
series data augmentation techniques applied to the y-axis
of 3D acceleration data. The techniques were implemented
using code from Um et al. (2017). Original (red), Jittering
(cyan), Permutation (yellow), Rotation (magenta), Rotation
+ Permutation (green), Rotation + Permutation and Time
Warping (blue).
Table 1: Distribution of seizure types in train and test sets
with the multimodal dataset.
Type Train Test
FIAS 42 12
FAS 18 3
TCS 7 4
GMS 1 1
Total 68 20
4.2.1 Train-Test Split with Multimodal Dataset
20 out of 88 seizures were included in the test set,
corresponding to 9 out of 45 patients. This proportion
of train-test split led to 125 seizure and 59,370 non-
seizure windows in the test set (16% of the dataset),
whereas 660 seizure and 525,367 non-seizure win-
dows (84% of the dataset) in the train set. Table 1
gives the distribution of seizure types in the train and
test set in the multimodal dataset.
Comparison of Different Data Augmentation Techniques for Improving Epileptic Seizure Detection Based on 3D Acceleration, Heart Rate
and Temperature Data
147

Table 2: Distribution of seizure types in train and test sets
with the unimodal dataset.
Type Train Test
FIAS 48 12
FAS 18 3
TCS 7 4
GMS 1 1
Total 74 20
4.2.2 Train-Test Split with Unimodal Dataset
20 out of 94 seizures were included in the test set cor-
responding to 9 out of 45 patients. This proportion
of train-test split led to 150 seizure and 67,104 non-
seizure windows in the test set (16% of the data set),
whereas 791 seizure and 581,295 non-seizure win-
dows (84% of the data set) in the train set. Table 2
gives the distribution of seizure types in the train and
test set in the unimodal dataset.
The same train-test split was used for all ex-
periments to ensure comparability. All generated
synthetic data were used in addition to the original
seizure samples in the train set while keeping the test
set unchanged.
4.3 CNN Architecture and Training
To develop a CNN network for seizure detection,
the model architecture from previous work (B
¨
oring,
2021) was used. This model was an adaptation of
the architecture originally proposed by Meisel et al.
(2020). CNN were chosen because of their higher ro-
bustness and time invariance in comparison to other
network architectures when used on time-series data
(Ismail Fawaz et al., 2021). Additionally, they are
easy to implement and highly efficient (Shoeibi et al.,
2021). B
¨
oring (2021) employed stratified k-fold
cross-validation to assess the performance of vari-
ous CNN architectures in seizure detection and the
adapted architecture from Meisel et al. (2020) was
found to be the most effective in leveraging wear-
able sensor data for the detection of epileptic seizures.
The original architecture includes a 1D convolutional
layer with 64 filters of size 2, followed by a ReLU
activation function and a max pooling layer with a fil-
ter size of 2. A dense layer with 50 neurons, with
a dropout layer (rate 0.7) present before and after it.
The final layer is a dense layer with two output neu-
rons activated by the SoftMax function (Meisel et al.,
2020).
Since the different sampling frequencies of the
sensor data caused issues with the input dimensions,
the original architecture was modified by B
¨
oring
(2021) to have multiple inputs, with each input layer
receiving a single feature window and processing it
separately through the same layer structure until the
last dropout layer. Then, a global average pooling
layer was applied to have the same size output from
each model. The outputs of these separate individual
models were then added together using a concatena-
tion layer. Finally, the dense layer with SoftMax was
applied to output the probabilities of the respective
class. The shape of the input layer was set to 500
for acceleration and 10 for heart rate and temperature
since the dataset had shapes (500,1) and (10,1), re-
spectively.
In this work, two models were trained: a three-
input model for three features (unimodal - only 3D
acceleration data) and a five-input model for five fea-
tures (multimodal - 3D acceleration data, heart rate
and temperature) given in Figure 4.
The ADAM optimizer was used during training,
and the batch size was set to 2048 (Kingma and Ba,
2014). The number of training iterations, also known
as epochs, was set to 2000. Binary cross entropy was
used as a loss function. An early stopping method was
used to monitor the validation loss so that the train-
ing stopped as soon as the model stopped improving.
The initial learning rate was set to 0.001, and a Keras
function called ReduceLROnPlateau was used to ad-
just the learning rate during training. The minimum
learning rate was set to 0.0001 (B
¨
oring, 2021).
To reduce the training time, undersampling was
applied to balance the classes before the training.
Consequently, the non-seizure data was randomly un-
dersampled to match the size of the seizure data. Fur-
thermore, the dataset was standardized to ensure that
all features have a consistent scale. (B
¨
oring, 2021)
4.4 Results
Experiments were conducted by training a CNN with
augmented data in various proportions. The evalua-
tion metrics were obtained for both the multimodal
and unimodal datasets. For comparison, baseline re-
sults were derived by training the CNN without any
augmented data. For choosing the best-performing
setting (data proportions and parameter settings) for
each data augmentation technique or combination of
techniques, the two metrics, seizure sensitivity and
false alarm rate per 24 hours were considered. If
there was one setting with both the highest seizure
sensitivity and the lowest false alarm rate, this setting
was chosen. If not, of those settings with the high-
est seizure sensitivity, the one with the lowest false
alarm rate was chosen, even if there was another set-
ting with a lower false alarm rate that lead to a reduced
seizure sensitivity. The description for the abbrevia-
HEALTHINF 2024 - 17th International Conference on Health Informatics
148
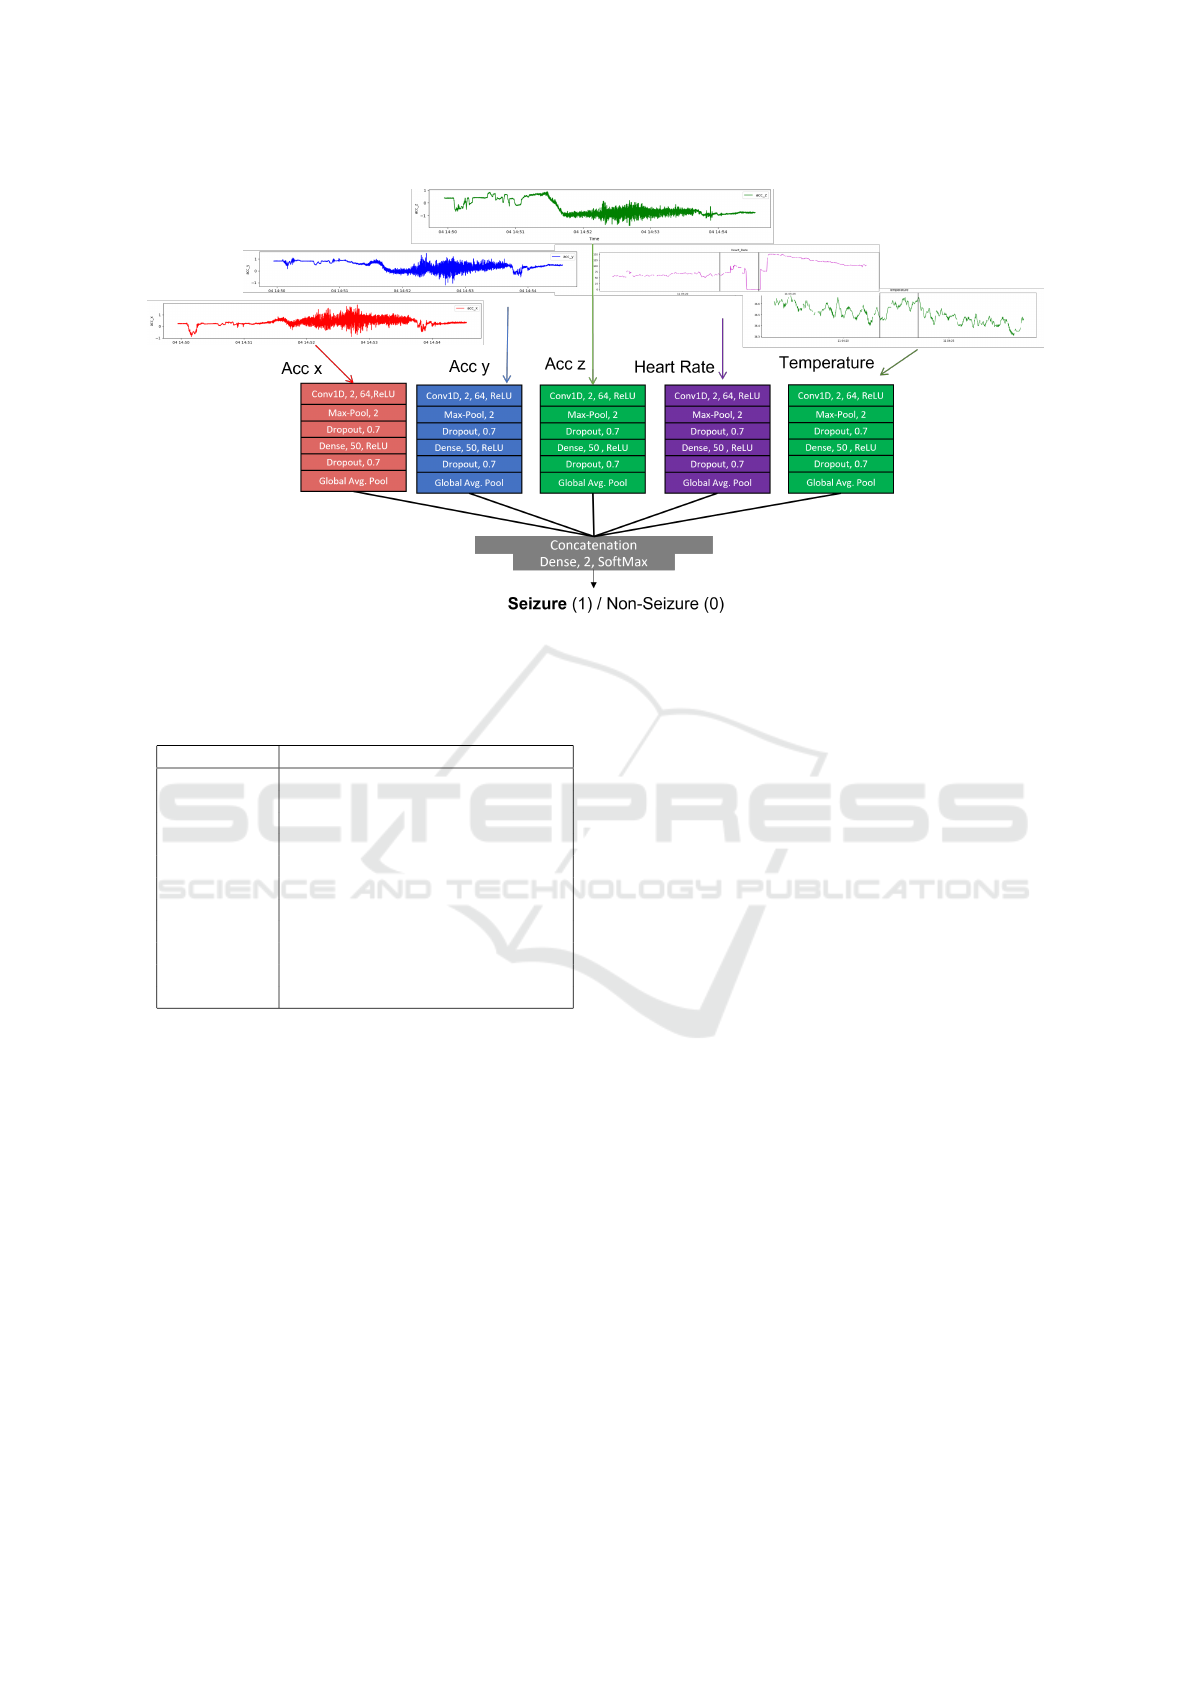
Figure 4: CNN model architecture with five inputs for 3D-acceleration, heart rate and temperature time series. Based on CNN
architecture in (B
¨
oring, 2021). CNN model with three inputs has the same architecture with three inputs - 3D acceleration.
Table 3: Description of the abbreviations for data augmen-
tation techniques.
Abbreviation Description
Baseline Without augmentation
J Jittering
R Rotation
P Permutation
T Time Warping
M Magnitude Warping
W Window Slicing
PT Permutation + Time Warping
RT Rotation + Time Warping
RP Rotation + Permutation
RPT Rotation + Permutation + Time Wa.
tion corresponding to each augmentation technique is
provided in Table 3. Results are reported for all the
single techniques. Because of the limited space avail-
able, only results for combinations with good results
are reported.
Table 4 summarizes the best-case results of CNN
model performance trained with augmented data from
different data augmentation techniques on the multi-
modal scenario. It presents the seizure and window
sensitivity, false alarm rate per 24 hours and speci-
ficity values for the best cases. The proportion of aug-
mented data used during the training is also shown.
Additionally, the ”Base” column provides the base-
line (without data augmentation) results for compar-
ison. 7 out of 10 techniques achieved the highest
value of 0.9 seizure sensitivity and detected 18 out
of 20 seizures, as in the baseline. The false alarm rate
ranges from 181 FA/24h (J, std=0.05) to 363 FA/24h
(W), with a mean value of 304 FA/24h, a significant
reduction from the baseline (382 FA/24h). Window
sensitivity varies between 0.57 (J) and 0.73 (T), with
a mean value of 0.686, which is close to the base-
line result of 0.69. Conversely, specificity varies from
0.82 (T) to 0.92 (J), with a mean value of 0.87, repre-
senting a significant improvement over the baseline of
0.80. Comparing the results of different proportions,
the 2x proportion was the most effective for six tech-
niques: J, T, W, PT, RT, and RPT. The 4x proportion
performed best for P (n=3), M and RP. The 1x propor-
tion was the most effective for only R. The 8x propor-
tion, which was not used for combined augmentation
techniques, did not produce a best-case outcome for
any of the single augmentation techniques in the mul-
timodal dataset.
Figure 5 visualizes the relationship between
seizure sensitivity and false alarm rate FA/24h for all
augmentation techniques in the multimodal scenario.
Seizure sensitivity is represented on the x-axis, while
FA/24h is shown on the y-axis. Each dot represents a
technique and the color corresponds to the technique’s
label. It can be seen that W, T, R, PT, RT, P and RP
achieved the same high seizure sensitivity as the base-
line with a lower false alarm rate than the baseline. J,
M, and RPT yielded a lower FA/24h at the expense
of a seizure sensitivity that was lower than the base-
line. The black arrow on the plot points to the RP
combination, which showed the best performance by
achieving the lowest false alarm rate (259 FA/24h) at
a high seizure sensitivity of 0.9.
The twin axes plot of specificity and window sen-
Comparison of Different Data Augmentation Techniques for Improving Epileptic Seizure Detection Based on 3D Acceleration, Heart Rate
and Temperature Data
149
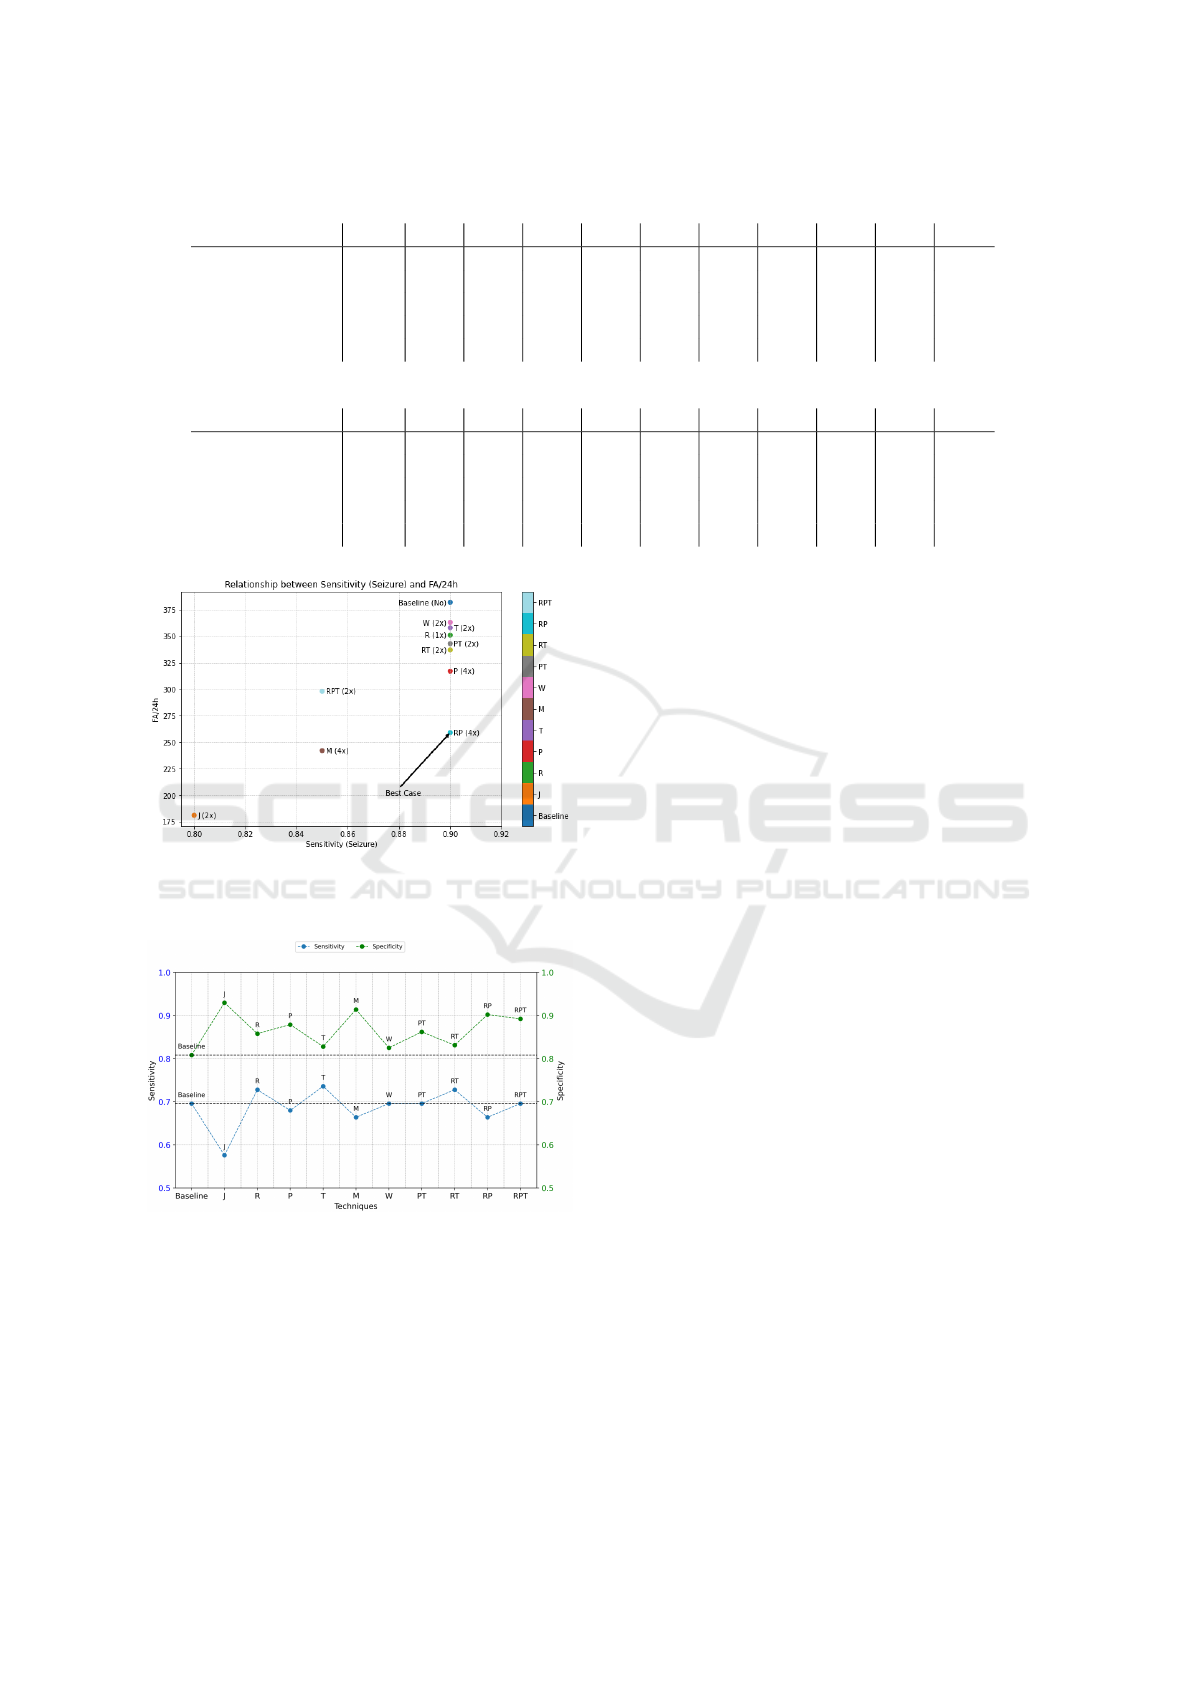
Table 4: Best results of the experiments for each data augmentation technique in the multimodal dataset.
Metrics Base J R P T M W PT RT RP RPT
Sensitivity
seizure
0.9 0.8 0.9 0.9 0.9 0.85 0.9 0.9 0.9 0.9 0.85
FA/24h 382 181 351 317 358 242 363 343 337 259 298
Sensitivity 0.69 0.57 0.72 0.68 0.73 0.66 0.69 0.69 0.72 0.66 0.69
Specificity 0.80 0.92 0.85 0.87 0.82 0.91 0.82 0.86 0.83 0.90 0.89
Proportion No 2x 1x 4x 2x 4x 2x 2x 2x 4x 2x
Table 5: Best results of the experiments for each data augmentation technique in the unimodal dataset.
Metrics Base J R P T M W PT RT RP RPT
Sensitivity
seizure
0.8 0.7 0.85 0.85 0.95 0.8 0.85 0.85 0.85 0.85 0.8
FA/24h 453 228 293 422 551 213 540 553 297 337 345
Sensitivity 0.6 0.42 0.56 0.58 0.58 0.46 0.66 0.57 0.6 0.64 0.64
Specificity 0.80 0.90 0.90 0.83 0.62 0.94 0.64 0.66 0.85 0.88 0.82
Proportion No 1x 4x 8x 1x 8x 1x 4x 4x 4x 4x
Figure 5: Comparison based on seizure sensitivity and
FA/24h of data augmentation techniques in the multimodal
dataset.
Figure 6: Comparison based on sensitivity and specificity
of data augmentation techniques in the multimodal dataset
based on Table 4.
sitivity for the multimodal case is given in Figure 6.
The specificity is higher than the baseline with all the
augmentation techniques. Using R, T and RT, the
window sensitivity increased, while with J, P, M and
RP techniques, it decreased below the baseline. W,
PT and RPT achieved the same window sensitivity as
the baseline.
Table 5 summarizes the best results from the uni-
modal dataset. The seizure sensitivity values ranged
from 0.8 (Base, M, RPT) to 0.95 (T) with a mean
of 0.835. The highest value (0.95, 19 of 20 seizures
detected) was achieved with Time Warping (T). The
false alarm rate had values between 213 FA/24h (J)
and 553 FA/24h (T), with a mean value of 377
FA/24h. While the window sensitivity varied between
0.42 (J, std=0.05) and 0.66 (W), with a mean value
of 0.573, the specificity varied between 0.62 (T) and
0.94 (M) with a mean value of 0.80. Among all the
different proportions, using the 4x proportion per-
formed well for five techniques: R, RT, RP, PT and
RPT. While the 1x proportion performed best for J, T
and W, the 8x proportion was most successful in two
techniques: P(n=3) and M. Conversely, the 2x pro-
portion did not give any better overall performance in
any augmentation techniques.
For the unimodal scenario, Figure 7 displays
the relationship between seizure sensitivity and false
alarm rate per 24 hours. T, PT, W, P, RP, RT and R
achieved a higher seizure sensitivity than the baseline.
However, the false alarm rate was very high (greater
than the baseline) for W, PT, and T, while it is lower
than the baseline for P, RP, RT and R. Using RPT and
M augmentation techniques yields the same seizure
sensitivity as the baseline at a lower false alarm rate
than the baseline. Moreover, the technique J yielded
a low seizure sensitivity at a lower false alarm rate.
The technique T gave the highest seizure sensitivity
of 0.95 with an increased false alarm rate compared
to the baseline. The M performed the best in terms of
the lowest false alarm rate among all other techniques
at the same seizure sensitivity as the baseline. On the
other hand, the R achieved the best result with higher
seizure sensitivity at a lower false alarm rate than the
HEALTHINF 2024 - 17th International Conference on Health Informatics
150
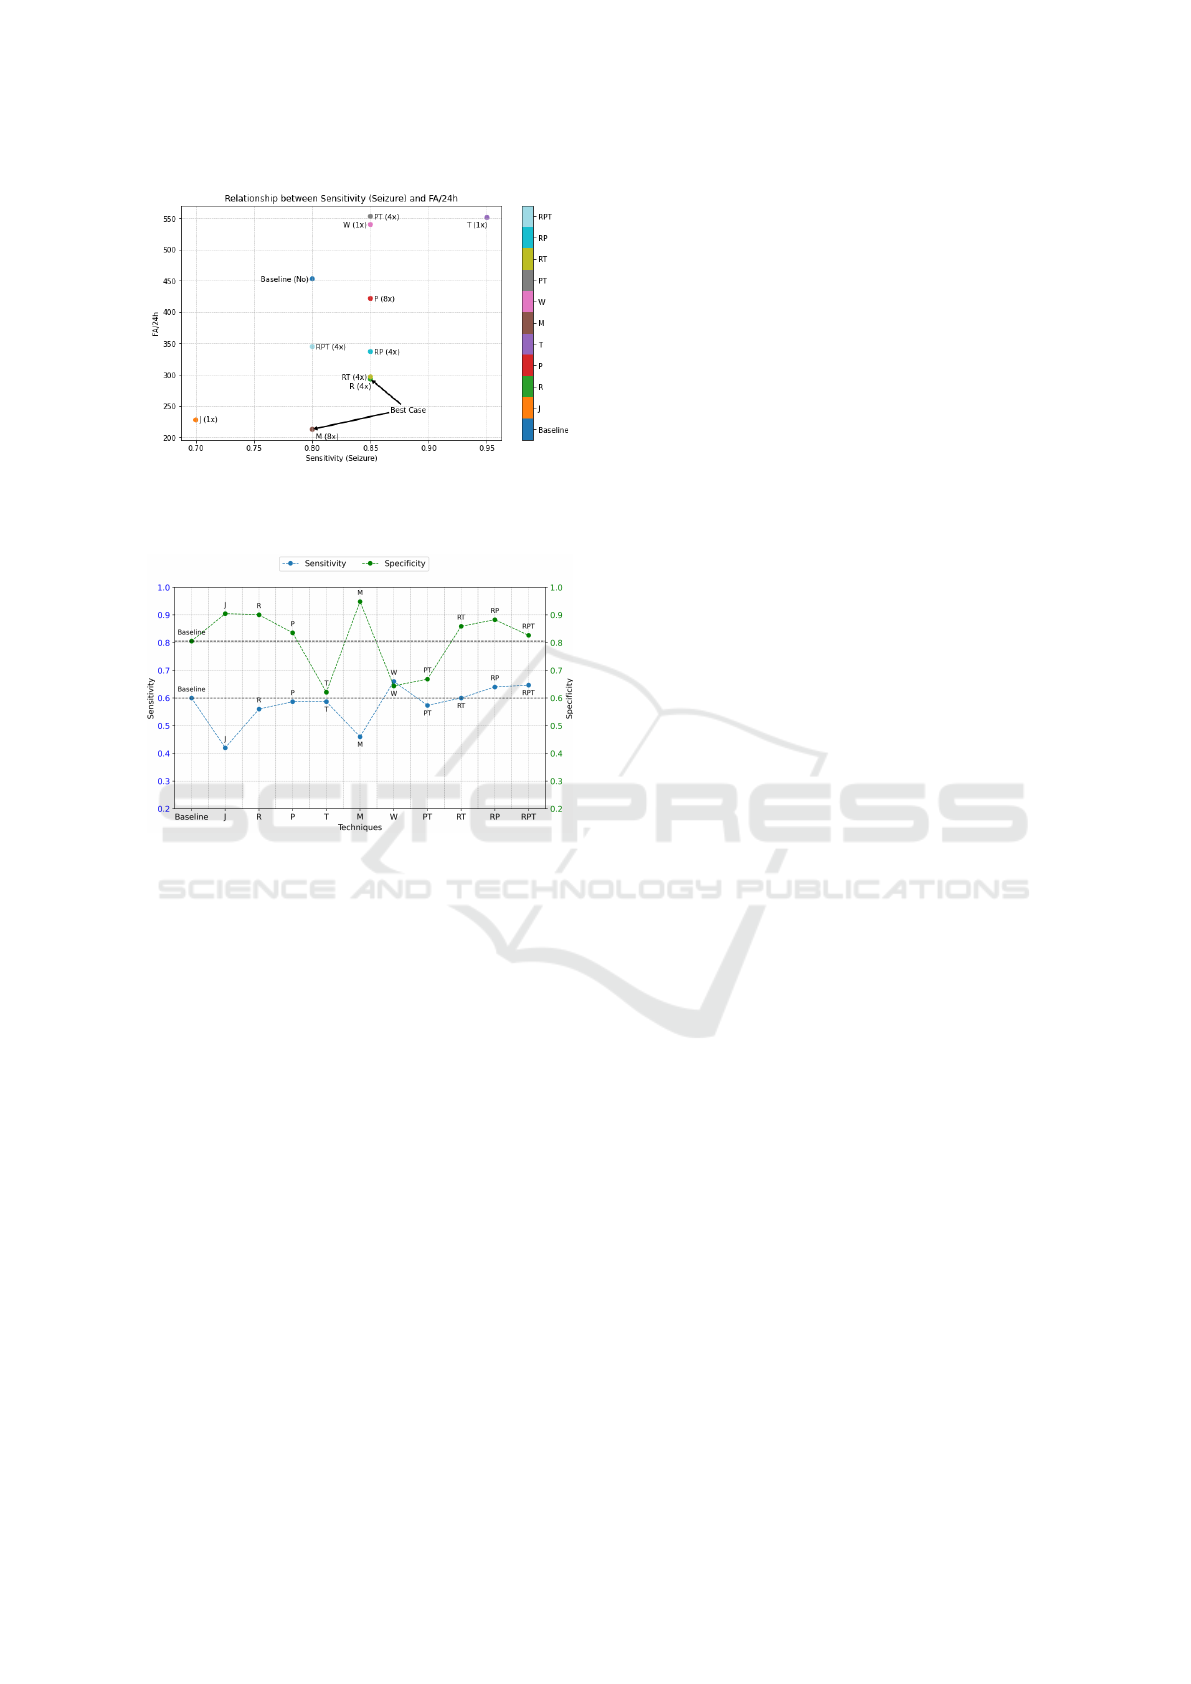
Figure 7: Comparison based on seizure sensitivity and
FA/24h of data augmentation techniques in the unimodal
dataset.
Figure 8: Comparison based on sensitivity and specificity of
data augmentation techniques in the unimodal dataset based
on Table 5.
baseline.
Figure 8 provides the twin axes plot of specificity
and window sensitivity in the unimodal case. J, R, P,
M, RT, RP and RPT had a higher specificity than the
baseline, indicating a low false alarm rate for these
techniques. T, W, and PT yielded lower specificity.
The window sensitivity is lower in J, R, P, T, M, and
PT, while it was the same as the baseline for RT. RP
and RPT techniques improved both the window sen-
sitivity and the specificity. RT achieved the same win-
dow sensitivity as the baseline at higher specificity.
5 DISCUSSION
In the multimodal case, all data augmentation tech-
niques resulted in a reduction of the false alarm rate
per 24 hours, which was also accompanied by an in-
crease in specificity. With the exceptions of J, M,
RPT, which achieved a lower seizure sensitivity, all
other techniques achieved the baseline seizure sensi-
tivity. Among the techniques that achieved the same
seizure sensitivity as the baseline, T, R and RT also
increased the window sensitivity. In contrast, the
techniques P and RP reduced the window sensitiv-
ity while with the techniques W and PT, the win-
dow sensitivity remained the same as the baseline.
At the same seizure sensitivity as the baseline, RP
yielded fewer false alarms (259 FA/24h) than RT (337
FA/24h). However, RT detected a larger proportion
of seizure windows overall, with a window sensitivity
of 0.72 compared to the RP’s 0.66. Considering the
same high seizure sensitivity (0.9) and lowest false
alarm rate, the RP combination was the most promis-
ing technique for the multimodal case.
In the unimodal case, all data augmentation tech-
niques except J yielded a high seizure sensitivity
equal to or greater than the baseline. The use of
M and RPT methods achieved a seizure sensitivity
as the baseline with a lower false alarm rate. With
the same seizure sensitivity, the false alarm rate was
much lower with M (213 FA/24h) than with RPT
(345 FA/24h), while M detected fewer seizure win-
dows (window sensitivity of 0.46) than RPT (win-
dow sensitivity of 0.64). Using R, P, W, PT, RT, and
RP techniques improved the seizure sensitivity. How-
ever, among these techniques, the false alarm rate was
much higher for W and PT. This increase in false
alarms is associated with a reduction in specificity
(below 0.7), compared to the baseline (0.8). At a
seizure sensitivity of 0.85, R achieved the lowest false
alarm rate of 293 FA/24h but with a slightly lower
window sensitivity of 0.56 compared to the baseline
of 0.6. On the other hand, RT and RP result in a
high window sensitivity of 0.6 and 0.64, with slightly
higher false alarm rates of 297 FA/24h for RT and 337
FA/24h for RP. However, these false alarm rates were
still lower than the baseline (453 FA/24h). T is the
only technique that yielded the highest seizure sensi-
tivity of 0.95, with 19 of 20 seizures detected at the
expense of an increased false alarm rate. Thus, it can
be concluded that R, RT and RP were the most suit-
able techniques for the unimodal case. Moreover, it
was possible to achieve a much lower false alarm rate
(213 FA/24h) while maintaining the same seizure sen-
sitivity as the baseline (0.8) by utilizing the M data
augmentation technique. Comparing the R and M
techniques, the R technique detected one seizure more
than the M technique. In contrast, M yields 80 false
alarms per 24 hours less than R. Detecting seizures
accurately is critical in reducing the risk for epilepsy
patients, while having a low false alarm rate is desir-
able for practical use. Given this tradeoff, a clinician’s
view might be needed to determine the preferred ap-
proach.
Using data generated via all time series data
Comparison of Different Data Augmentation Techniques for Improving Epileptic Seizure Detection Based on 3D Acceleration, Heart Rate
and Temperature Data
151

augmentation techniques (except T) resulted in a
higher seizure sensitivity in the multimodal case as
compared to when they were used in the unimodal
case. However, considering the detection improve-
ment from their baseline version, no technique in the
multimodal case has produced more seizure sensitiv-
ity than its baseline. In contrast, all the techniques
(except J, M, and RPT) in the unimodal case have
given higher seizure sensitivity than its baseline. Us-
ing T in a unimodal case, a seizure sensitivity of 0.95
was achieved, which was overall the highest among
all the techniques in both unimodal and multimodal
cases.
The difference in the results achieved by unimodal
and multimodal datasets can be due to the difference
in the amount of data available for the multimodal and
unimodal datasets. This difference originated from
the lack of temperature and heart rate data for some
seizure events in the multimodal dataset (see 3.2.2).
As a result, different train and test set sizes in the
unimodal and multimodal case potentially impacted
the prediction outcomes. Using data augmentation
techniques, the average false alarm rate over all tech-
niques for the multimodal case was approximately
304 FA/24h. This is notably lower than the average
false alarm rate of 377 FA/24h observed in the uni-
modal case. Since the lower false alarm means that
more non-seizure windows were classified accurately,
it was observed that, as a result, the average specificity
with all techniques in the multimodal case was 0.87,
which is higher than the average specificity of 0.8 ob-
served in the unimodal scenarios. The window sen-
sitivity for all the techniques in the multimodal case,
averaging 0.686, was also higher than those of the uni-
modal case, which had an average window sensitivity
of 0.573.
Summarizing the above, using standard time se-
ries data augmentation techniques in the multimodal
case reduced false alarm rates while maintaining
the same high seizure sensitivity. In the unimodal
case, various data augmentation techniques improved
seizure sensitivity from the baseline while lowering
false alarm rates. Therefore, it was shown that the use
of data augmentation techniques can be a way to im-
prove the performance of CNN in seizure detection.
6 CONCLUSION
This work investigated the potential of data augmen-
tation techniques to improve a seizure detection sys-
tem. For this purpose, standard time series data aug-
mentation techniques were utilized to increase the
amount of available motor seizure data. The exper-
iments demonstrated that training the CNN with a
combination of synthetic data generated through the
aforementioned augmentation techniques and original
seizure data can result in an increased seizure sensi-
tivity and a reduced false alarm rate.
In the multimodal dataset, the most effective
augmentation approach was achieved by utilizing a
combination of Rotation and Permutation techniques
(RP), whereas in the unimodal dataset, the best results
were obtained by employing Rotation (R) or Mag-
nitude Warping (M) techniques. In the multimodal
case, the combination of Rotation and Permutation
(RP) achieved the same seizure sensitivity as the base-
line (0.9) while reducing the false alarm rate by 123
FA/24h. In the unimodal case, Rotation (R) increased
the seizure sensitivity by 0.05 (from 0.8 to 0.85) while
reducing the false alarm rate by 160 FA/24h (from
453FA/24h to 293FA/24h). Both improvements of the
false alarm rate are statistically highly significant ap-
plying the binomial test. The aforementioned results
were observed when the synthetic data obtained from
the most effective techniques was combined with the
original dataset, which was used for CNN training.
Evaluating the impact of data augmentation across
diverse test sets, coupled with experimentation with
different Machine Learning algorithms, may enhance
the performance of seizure detection systems. Addi-
tionally, the influence of augmentation on detecting
different seizure types could also be explored with
larger test sets.
ACKNOWLEDGEMENTS
The authors acknowledge the financial support by the
Federal Ministry of Health in the framework of the
MOND (project number G512F11007).
REFERENCES
Ahmad, I., Wang, X., Zhu, M., Wang, C., Pi, Y., Khan,
J. A., Khan, S., Samuel, O. W., Chen, S., and Li, G.
(2022). Eeg-based epileptic seizure detection via ma-
chine/deep learning approaches: A systematic review.
Computational Intelligence and Neuroscience, 2022.
Beniczky, S. and Ryvlin, P. (2018). Standards for testing
and clinical validation of seizure detection devices.
Epilepsia, 59:9–13.
Beniczky, S., Wiebe, S., Jeppesen, J., Tatum, W. O.,
Brazdil, M., Wang, Y., Herman, S. T., and Ryvlin,
P. (2021). Automated seizure detection using wear-
able devices: A clinical practice guideline of the inter-
national league against epilepsy and the international
HEALTHINF 2024 - 17th International Conference on Health Informatics
152

federation of clinical neurophysiology. Clinical Neu-
rophysiology, 132(5):1173–1184.
Bidwell, J., Khuwatsamrit, T., Askew, B., Ehrenberg, J. A.,
and Helmers, S. (2015). Seizure reporting technolo-
gies for epilepsy treatment: A review of clinical infor-
mation needs and supporting technologies. Seizure,
32:109–117.
Blagus, R. and Lusa, L. (2013). Smote for high-dimensional
class-imbalanced data. BMC bioinformatics, 14:1–16.
B
¨
oring, Y. (2021). Implementierung eines convolutional
neural networks zur detektion motorischer epileptis-
cher anf
¨
alle mittels biosignalen eines in-ohr-sensors.
Unpublished master’s project.
Fraunhofer (2023). Mobile, smart neurosensor system for
the detection and documentation of epileptic seizures
in everyday life.
Hasibi, R., Shokri, M., and Dehghan, M. (2019). Aug-
mentation scheme for dealing with imbalanced net-
work traffic classification using deep learning. arXiv
preprint arXiv:1901.00204.
Henze, J., Houta, S., Surges, R., Kreuzer, J., and Bis-
gin, P. (2021). Multimodal detection of tonic–clonic
seizures based on 3d acceleration and heart rate data
from an in-ear sensor. In Del Bimbo, A., Cucchiara,
R., Sclaroff, S., Farinella, G. M., Mei, T., Bertini,
M., Escalante, H. J., and Vezzani, R., editors, Pat-
tern Recognition. ICPR International Workshops and
Challenges, pages 490–502, Cham. Springer Interna-
tional Publishing.
Houta, S., Bisgin, P., and Dulich, P. (2019). Machine
learning methods for detection of epileptic seizures
with long-term wearable devices. In Eleventh Interna-
tional Conference on eHealth, Telemedicine, and So-
cial Medicine.
Iglesias, G., Talavera, E., Gonz
´
alez-Prieto,
´
A., Mozo,
A., and G
´
omez-Canaval, S. (2023). Data augmen-
tation techniques in time series domain: a survey
and taxonomy. Neural Computing and Applications,
35(14):10123–10145.
Ismail Fawaz, H., Forestier, G., Weber, J., Idoumghar, L.,
and Muller, P.-A. (2021). Deep learning for time series
classification: a review. Data Mining and Knowledge
Discovery, 33(4):917–963.
Iwana, B. K. and Uchida, S. (2021). An empirical survey of
data augmentation for time series classification with
neural networks. Plos one, 16(7):e0254841.
Kingma, D. P. and Ba, J. (2014). Adam: A
method for stochastic optimization. arXiv preprint
arXiv:1412.6980.
Lashgari, E., Liang, D., and Maoz, U. (2020). Data aug-
mentation for deep-learning-based electroencephalog-
raphy. Journal of Neuroscience Methods, 346:108885.
McGeehan, B. (2018). Supporting students with epilepsy in
the school setting. Communique, 47(3):8–10.
Meisel, C., El Atrache, R., Jackson, M., Schubach, S.,
Ufongene, C., and Loddenkemper, T. (2020). Ma-
chine learning from wristband sensor data for wear-
able, noninvasive seizure forecasting. Epilepsia,
61(12):2653–2666.
Ramgopal, S., Thome-Souza, S., Jackson, M., Kadish,
N. E., S
´
anchez Fern
´
andez, I., Klehm, J., Bosl, W.,
Reinsberger, C., Schachter, S., and Loddenkemper,
T. (2014). Seizure detection, seizure prediction, and
closed-loop warning sstems in epilepsy. Epilepsy and
Behavior, 37:291–307.
Sazgar, M. and Young, M. (2019). Absolute Epilepsy
and EEG Rotation Review: Essentials for Trainees.
Springer International Publishing.
Schulze-Bonhage, A., Sales, F., Wagner, K., Teotonio, R.,
Carius, A., Schelle, A., and Ihle, M. (2010). Views of
patients with epilepsy on seizure prediction devices.
Epilepsy & behavior, 18(4):388–396.
Shoeb, A. H. and Guttag, J. V. (2010). Application of ma-
chine learning to epileptic seizure detection. In Pro-
ceedings of the 27th international conference on ma-
chine learning (ICML-10), pages 975–982.
Shoeibi, A., Khodatars, M., Ghassemi, N., Jafari, M.,
Moridian, P., Alizadehsani, R., Panahiazar, M.,
Khozeimeh, F., Zare, A., Hosseini-Nejad, H., Khos-
ravi, A., Atiya, A. F., Aminshahidi, D., Hussain,
S., Rouhani, M., Nahavandi, S., and Acharya, U. R.
(2021). Epileptic seizures detection using deep
learning techniques: A review. International Jour-
nal of Environmental Research and Public Health,
18(11):5780.
Shorten, C. and Khoshgoftaar, T. M. (2019). A survey on
image data augmentation for deep learning. Journal
of big data, 6(1):1–48.
Siddiqui, M. K., Huang, X., Morales-Menendez, R., Hus-
sain, N., and Khatoon, K. (2020). Machine learning
based novel cost-sensitive seizure detection classifier
for imbalanced eeg data sets. International Journal
on Interactive Design and Manufacturing (IJIDeM),
14:1491–1509.
Sun, Y., Wong, A. K., and Kamel, M. S. (2009). Classifica-
tion of imbalanced data: A review. International jour-
nal of pattern recognition and artificial intelligence,
23(04):687–719.
Um, T. T., Pfister, F. M., Pichler, D., Endo, S., Lang,
M., Hirche, S., Fietzek, U., and Kuli
´
c, D. (2017).
Data augmentation of wearable sensor data for parkin-
son’s disease monitoring using convolutional neural
networks. In Proceedings of the 19th ACM inter-
national conference on multimodal interaction, pages
216–220.
Wen, Q., Sun, L., Yang, F., Song, X., Gao, J., Wang, X.,
and Xu, H. (2021). Time series data augmentation for
deep learning: A survey. In Proceedings of the Thirti-
eth International Joint Conference on Artificial Intel-
ligence. International Joint Conferences on Artificial
Intelligence Organization.
Comparison of Different Data Augmentation Techniques for Improving Epileptic Seizure Detection Based on 3D Acceleration, Heart Rate
and Temperature Data
153
