
Assessment of the Relationship Between Attribute Coding and the
Interpretability of Machine Learning Models: An Analysis in the
Context of Children and Adolescents with Depression
Ludmila B. S. Nascimento
1 a
, Marcelo de S. Balbino
1,2 b
, Maycoln L. M. Teodoro
3 c
and Cristiane N. Nobre
1 d
1
Institute of Exact Sciences and Informatics, Pontifical Catholic University of Minas Gerais,
Dom Jos
´
e Gaspar, Belo Horizonte, Brazil
2
Department of Computing and Civil Construction, Federal Center for Technological Education of Minas Gerais,
Belo Horizonte, Brazil
3
Department of Psychology, Federal University of Minas Gerais, Belo Horizonte, Brazil
Keywords:
Children and Adolescents, Depression, Encoding, Interpretability.
Abstract:
Depression is a global public health challenge that affects approximately 300 million people. Artificial Intel-
ligence and Machine Learning have revolutionized the healthcare sector, allowing the development of models
to diagnose depression. Tabular data, shared in healthcare, requires preprocessing, including encoding cat-
egorical attributes into numeric values, as many Machine Learning algorithms only support numeric data.
This study aims to investigate different coding methods for non-ordinal nominal categorical attributes in a
dataset related to depression in children and adolescents suffering from Major Depressive Disorder (MDD).
The comparison results revealed that the XGBoost algorithm with the Hash Encoding, Customized One Hot,
Frequency, and Dummy coding techniques were more effective for the analyzed data set. However, not all
of these encodings are interpretable. These results provide significant insights, highlighting the importance
of choosing appropriate coding methods to improve the accuracy of Machine Learning models and the inter-
pretability of these models in healthcare.
1 INTRODUCTION
Depressive disorder, called depression, represents a
significant public health challenge on a global scale
(Herrman et al., 2019). Around 300 million individu-
als worldwide face depression (PAHO, 2022).
The World Health Organization (WHO) states that
depressive disorders, such as mental illness, are dif-
ferent from usual variations in mood or routine feel-
ings. Major Depressive Disorder (MDD) is the most
common type of depression in adolescents. It is char-
acterized by sadness, loss of interest, tiredness, exces-
sive guilt, sleep and appetite disturbances, moderate
or sluggishness, and suicidal thoughts. In this article,
the term depression refers to this form of MDD.
Depression in children and adolescents is a se-
a
https://orcid.org/0009-0004-9133-9671
b
https://orcid.org/0000-0003-4154-8518
c
https://orcid.org/0000-0002-3021-8567
d
https://orcid.org/0000-0001-8517-9852
vere problem, with estimates of approximately 1.1%
among adolescents aged 10 to 14 and 2.8% among
adolescents aged 15 to 19 (WHO, 2021). In Brazil,
the prevalence of depression in children over 14 years
old varies from 0.2% to 7.5% (Coutinho et al., 2014).
Depression has several symptoms that affect so-
matic and psycho-emotional processes. This can be
complicated during adolescence, as symptoms can be
confused with age-typical behaviors, such as irritabil-
ity, family conflicts, school problems, substance use,
and problematic behavior (Bernaras et al., 2019).
Early diagnosis of depression is crucial to pre-
vent the condition from worsening and to improve
the effectiveness of treatment (Bal
´
azs et al., 2013). In
Brazil, only 19.2% of children and adolescents treated
in the Unified Health System (SUS) and diagnosed
with depression sought or received any (Coutinho
et al., 2014) treatment.
In an attempt to obtain a more accurate and early
diagnosis as possible, many studies have focused
on finding additional evidence, whether verbal, non-
482
Nascimento, L., Balbino, M., Teodoro, M. and Nobre, C.
Assessment of the Relationship Between Attribute Coding and the Interpretability of Machine Learning Models: An Analysis in the Context of Children and Adolescents with Depression.
DOI: 10.5220/0012386200003657
Paper published under CC license (CC BY-NC-ND 4.0)
In Proceedings of the 17th International Joint Conference on Biomedical Engineering Systems and Technologies (BIOSTEC 2024) - Volume 2, pages 482-489
ISBN: 978-989-758-688-0; ISSN: 2184-4305
Proceedings Copyright © 2024 by SCITEPRESS – Science and Technology Publications, Lda.

verbal, behavioral, linguistic, gestural, or social, that
can help diagnose or alert to the future development
of the depression in adolescence (Bal
´
azs et al., 2013).
On the other hand, the application of Artificial In-
telligence (AI) has achieved significant advances in
different areas of health (Yu et al., 2018). In the area
of depression, we have several studies classifying pa-
tients with depression (Chu et al., 2018; Kim et al.,
2019). Therefore, computational methods can pro-
vide valuable help in diagnosing and classifying peo-
ple with depression.
Using Machine Learning (ML) algorithms is pos-
sible to assist in the prediction and decision-making
processes related to depression, using data such as im-
age, text, audio, and tabular data(Yu et al., 2018).
Tabular data, most common in healthcare, in-
cludes measurements and counts of clinical, labora-
tory, and historical values and must be represented
appropriately so that results are consistent, organized,
and can be used to create efficient ML models (Yu
et al., 2018). In this case, the databases are composed
of instances (observations) and attributes (character-
istics), these can be numeric or nominal.
Data quality is essential for the excellent perfor-
mance of ML algorithms, so data preprocessing is
crucial due to common imperfections in raw data such
as missing values outliers, high attribute dimensional-
ity, and data balancing (Kotsiantis et al., 2006). An es-
sential step in this process is encoding, which converts
categorical attributes into numeric values, as most ML
algorithms require this input type.
The distribution of categorical characteristics in
health data plays an essential role in the interpretabil-
ity of results(Vellido, 2020). This is because choos-
ing appropriate coding can directly affect the ability
to understand and extract meaningful insights from
data, and some coding approaches can result in the
loss of important information.
Given the above, this article aims to investigate
different types of coding for nominal categorical at-
tributes in a healthcare database. The aim is to an-
alyze the performance and effectiveness of different
encodings in this data set and investigate whether
there is an encoding that presents more effective re-
sults, in addition to observing whether or not it helps
with the interpretability of the results.
To carry out this analysis, we used a database of
children and adolescents with different symptomatic
presentations of depression and eight different cod-
ings. One Hot (OHE), Dummy, and Customized One
Hot encodings ensure explicit representations of cat-
egories, while Frequency and Count ensure the fre-
quency of attribute options. Ordinal and Rank Hot
maintain the order and relationship between cate-
gories, and Hash reduces dimensionality while pre-
serving part of the information.
The remainder of this text follows the following
structure: Section 2 brings the reference, containing
the techniques usually used to convert nominal at-
tributes. Section 3 reviews some studies related to
coding techniques for categorical attributes and car-
dinality. Section 4 presents the methodology adopted
in this study. Section 5 explores the results achieved
during the experiments. Finally, Section 6 brings final
considerations and points to future work.
2 BACKGROUND
2.1 Depression in Children and
Adolescents
MDD is characterized by sadness much of the day,
almost every day. Symptoms include significant loss
of interest or pleasure in activities, changes in weight,
sleep problems, agitation or psychomotor retardation,
fatigue, feelings of worthlessness or excessive guilt,
difficulty concentrating, thoughts of death, and sui-
cidal ideation. MDD not only affects adults, but also
children and adolescents. Although they may vary de-
pending on age, symptoms are similar to those seen in
adults (Bernaras et al., 2019).
Depression in children leads to adverse effects on
socioemotional skills, resulting in relationship irri-
tability, social isolation, low school attendance, and
self-harm risk. Additionally, it disrupts personality
development, potentially leading to personality disor-
ders (Herrman et al., 2019).
The origin of depression in adolescence is multi-
factorial, involving several processes and risk factors
of a biological, interpersonal, cognitive, emotional
and personality. There is no single necessary and suf-
ficient cause for depression, and therefore, a complete
understanding requires the simultaneous assessment
of multiple elements (Hankin, 2006).
For adequate treatment of depression, an accurate
diagnosis is necessary. Therefore, professionals who
care for children and adolescents and treat depression
should be familiar with the Diagnostic and Statistical
Manual of Mental Disorders V (DSM-V). This man-
ual presents essential criteria for diagnosing depres-
sion. The primary feature for diagnosing MDD is the
presence of 5 of 9 critical symptoms on most days for
two weeks, with at least 1 being depressed mood or
loss of interest/pleasure (Association et al., 2014).
Treating and preventing depression in children
and adolescents is crucial. Many of the treatments
Assessment of the Relationship Between Attribute Coding and the Interpretability of Machine Learning Models: An Analysis in the Context
of Children and Adolescents with Depression
483

for depression in this age group were initially devel-
oped based on treating adults. Essential evidence-
based treatments include pharmacotherapy, cognitive
behavioral therapy, and interpersonal therapy. A com-
bination of therapies and medications may also be
considered (Bal
´
azs et al., 2013).
2.2 Techniques for Encoding
Categorical Attributes
Often, datasets are organized in a tabular or matrix
structure in which rows and columns represent in-
stances and attributes, respectively.
For the encodings described in the following sub-
sections, consider the following notation: Let a
database be B = (I, A, C), where I is a set of instances,
A is a set of attributes, and C is the set of target classes.
The total number of instances is denoted by m.
Furthermore, another term used is the cardinal-
ity of the categorical attribute to evaluate the perfor-
mance of coding methods.
Cardinality in categorical variables indicates how
many unique values an attribute can have (card(a
i
) =
N). High cardinalities, with many different values,
are challenging in ML modeling.
2.2.1 Indicator Encoding
It is a generic concept that refers to two standard
methods of encoding categorical attributes, One Hot
Encoding and Dummy Encoding (Pargent et al.,
2022).
• One Hot Encoding: The method creates a new
column for each N level of a categorical attribute,
representing them as binary values (0 or 1) in
each row. The process generates a binary ma-
trix with columns corresponding to the number
of variations of this attribute (N) (cardinality).
In other words, high attribute cardinality results
in high-dimensional feature vectors in (Pargent
et al., 2022) databases.
Dummy Encoding: Dummy is an improved ver-
sion of OHE. However, unlike OHE, it uses N − 1
columns to represent an attribute with cardinality
N.
2.2.2 Rank Hot Encoding
Rank Hot encoding is a variation of OHE in which
all attributes, including the current and previous cat-
egories, are set to ”hot” (1), and the remaining cat-
egories are set to cold (0). This technique is proper
when there is some ordinal or hierarchical relation-
ship between categories, and the order of the cate-
gories plays a relevant role (Buckman et al., 2018).
2.2.3 Frequency Encoding
This coding assigns a numerical value to each level
(N) of the categorical attribute according to its fre-
quency about the total occurrences (m) to that data set
column. Therefore, the most frequent values receive
higher numerical values, and the less frequent values
receive lower values. However, according to (Roy,
2019), it is possible to lose important information if
two distinct categories have the same occurrence rate.
2.2.4 Count Encoding
Count coding consists of counting the number of oc-
currences of a given categorical feature (N) in a spe-
cific attribute and replacing the names of these fea-
tures with the count performed. As with coding by
frequency, it is possible to lose important information
if two distinct categories have the same value of oc-
currences (Roy, 2019).
2.2.5 Ordinal Encoding
This coding transforms options for a categorical at-
tribute into a column of integers based on knowledge
of the number of existing categories (Pargent et al.,
2022). It is possible to provide a mapping to define a
specific order; otherwise, integer values are assigned
randomly. The result is a column of integers ranging
from 1 to N.
2.2.6 Hashing Encoding
The method transforms categorical data into a numer-
ical value using a hash function. It reduces extensive
data sets into smaller structures of fixed size. How-
ever, hash functions are unidirectional, making it im-
possible to recover the original values after the hash
values are generated. Furthermore, the risk of com-
plications when different keys result in the same hash
value can compromise data interpretability in critical
situations (Kuhn and Johnson, 2019).
3 RELATED WORKS
Kovalerchuk and McCoy (2023) discuss the challenge
of generating accurate and interpretable ML models
for datasets with numeric and categorical attributes.
The authors suggest using numerical coding for non-
numeric attributes and present an algorithm called
HEALTHINF 2024 - 17th International Conference on Health Informatics
484
Sequential Rule Generation (SRG). The SRG algo-
rithm is successfully introduced to generate explain-
able rules in categorical data and is evaluated in sev-
eral computational experiments.
In another study, the authors evaluate the influ-
ence of encoding numeric attributes on two highly
unbalanced fraudulent transaction data sets. Six cod-
ing methods were employed, belonging to Agnostic
Methods and Target-Based Methods. The study high-
lights the importance of choosing the appropriate en-
coding technique for imbalanced datasets, as target-
based encodings can have significant performance in
the (Breskuvien
˙
e and Dzemyda, 2023) model.
Cerda and Varoquaux (2022) investigated statis-
tical coding approaches for categorical attributes for
automated methods suitable for categories with high
cardinality. Two coding approaches, Min-hash En-
coder, and Gamma-Poisson Factorization, were com-
pared with other approaches on different databases.
The results showed that if interpretability is required,
Gamma-Poisson factorization is the most suitable al-
ternative, while if scalability is essential, the Min-
hash encoder is the most efficient option.
4 MATERIALS AND METHODS
4.1 Database Description
To conduct this analysis, we used a database provided
by the Federal University of Minas Gerais related to
depression in children and adolescents aged between
10 and 16 years old, 158 males and 219 females, to-
taling 377 instances. The database comprises 74 at-
tributes that contain essential information for analyz-
ing depression in children and adolescents between
10 and 16 years old. These attributes cover several
aspects, including demographic, social, and mental
health-related data.
Furthermore, we categorized depression into two
groups based on percentile calculation, where 63 in-
dividuals were classified as having high depression,
while the rest were classified as having low depres-
sion. The cutoff point for this classification was de-
fined as the 85th percentile.
During pre-processing, two textual attributes and
27 attributes related to the CDI questionnaire totaled
45 input attributes. The description of the attributes is
detailed in Table 1.
4.2 Description of Methods
To evaluate different coding techniques for categor-
ical attributes, we created a pipeline for ML in the
language Python, employing several libraries widely
used in data science projects, such as Scikit-learn
1
Pandas
2
and Category Encoders.
3
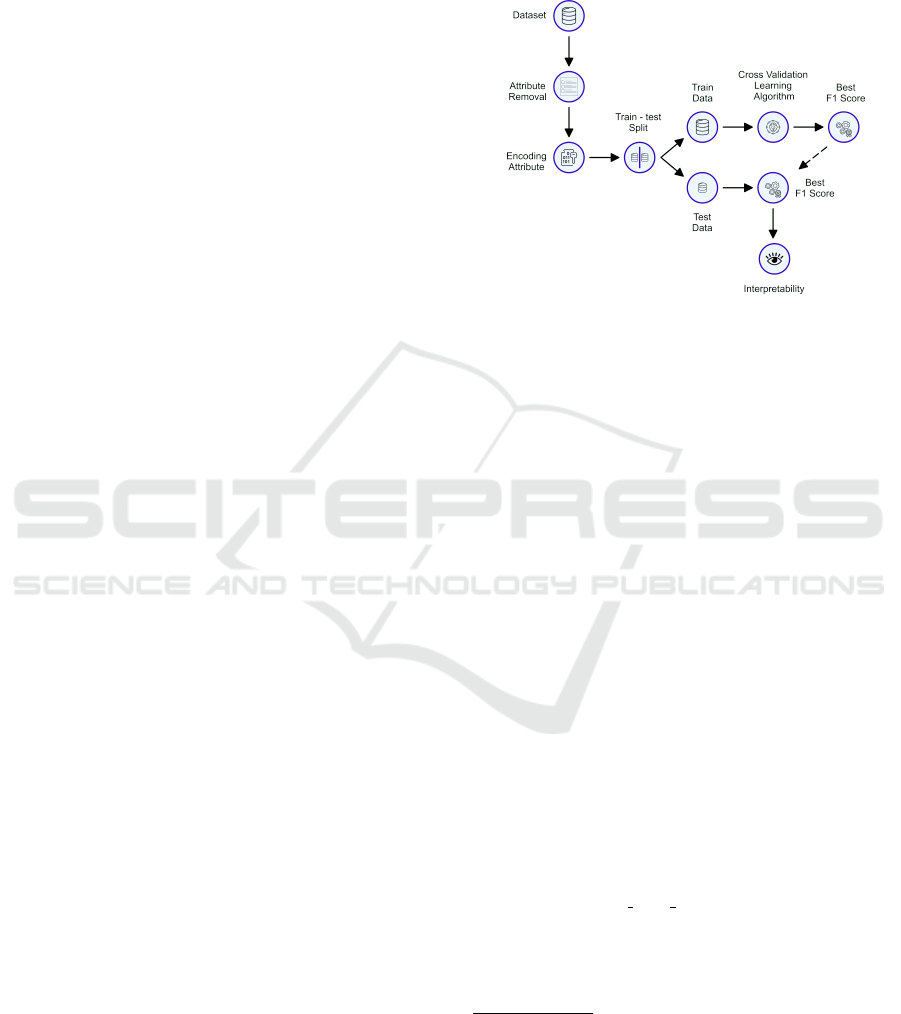
. Figure 1 illus-
trates the pipeline used to carry out this study.
Figure 1: Pipeline adopted.
4.2.1 Preprocessing
1. Attribute Removal
Initially, the database contained two attributes
with insufficient information, “What medicine
does the father take?” and “What medicine does
the mother take?”. Due to this limitation in data
quality, we decided to exclude these attributes.
Furthermore, textual attributes that referred to the
medication the individual’s parents took were re-
moved. We made this decision considering the
specific nature of this data and the complexity of
integrating it into our analysis.
Other attributes excluded from the analysis were
related to the CDI (Children’s Depression Inven-
tory) questionnaire. This exclusion was due to the
high correlation between these attributes and the
class attribute.
2. Categorical Attribute Coding
We use a specific coding, Ordinal Encoder, to
carry out the coding for ordinal categorical at-
tributes.
To deal with the non-ordinal nominal categorical
attribute “Lives with Who”, we employ eight un-
supervised categorical coders. Furthermore, we
adapted the OHE for coding that would trans-
form each family member option into a new at-
tribute, assigning the value one if the individual
1
Official documentation can be found at: Scikit-learn,
the version used was 1.2.2
2
The official documentation can be found at: Pandas,
the version used was 2.0 .2
3
Official documentation can be found at: Category En-
coders, the version used was 2.6.1.
Assessment of the Relationship Between Attribute Coding and the Interpretability of Machine Learning Models: An Analysis in the Context
of Children and Adolescents with Depression
485

Table 1: Description of the dataset and used attributes.
Description Attribute Type Possible Values
Demographics
Time spent with the mother/father per day during the week?
Discrete
Minimum = 0, Maximum = 24
Time spent with the mother/father per day on the weekend?
Discrete
Minimum = 0, Maximum = 24
Patient in psychological or psychiatric treatment?
Binary Yes, no
Parents live together or separated Binary Together, Separated/divorced
Father’s/mother’s education level? Ordinal Categorical
Did Not Study, Incomplete Primary School,
Complete Primary School, Incomplete High School,
Complete High School,Incomplete College, Complete College,
Don’t Know
Has the mother/father or anyone in their family been in
psychological or psychiatric treatment?
Binary Yes, no
Is the mother/father taking any continuous medication?
Binary Yes, no
Time the mother spends with her child(ren) per day
during the week
Discrete
Minimum = 2, Maximum = 24
Time the mother spends with her child(ren) per day
on the weekend
Discrete
Minimum = 4, Maximum = 24
Time the father spends with his child(ren) per day
during the week
Discrete
Minimum = 0 , Maximum = 24
Time the father spends with his child(ren) per day
on the weekend
Discrete
Minimum = 0 , Maximum = 24
Social Gender Binary Male, female
Age Discrete
Minimum = 10, Maximum = 16
Mother’s age Discrete
Minimum = 26, Maximum = 54
Is the mother/father working? Binary Yes, no
Father’s age Discrete
Minimum = 25, Maximum = 78
Who lives with the patient in their home? Nominal Categorical
[Father], [Mother], [Siblings], [Grandparents], [Father and Mother],
[Father, Mother, and Siblings], [Mother and Siblings],
[Mother, Siblings, and Others], [Father, Sibling, and Others],
[Mother and Others], [Father, Mother, Siblings, and Others],
[Father and Siblings], [Father, Mother, and Others],
[Siblings and Others], [Others], [Father and Stepmother],
[Father, Stepmother, and Others], [Mother and Stepfather],
[Mother, Stepfather, and Others], [Father and Others]
Questionnaire Youth Self-Report (YSR) Discrete
Minimum = 25, Maximum = 100
lives with that member and 0 if he does not. To
clarify, let us take as an example the option I
live with “father, mother and siblings”: each of
them was transformed into three new separate at-
tributes, with an exclusive column for “father”,
another for “mother” and a third for “siblings”.
Table 2 presents the Python coders and libraries
used to implement them.
Table 2: Libraries and methods used to implement the en-
codings.
Encoding Library Methods
Count Encoding Category Encoders CountEncoder
Customized One Hot Pandas -
Dummy Encoding Pandas get dummies
Frequency Encoding Pandas -
Hashing Encoding Category Encoders HashingEncoder
One Hot Encoding Pandas get dummies
Ordinal Encoding Category Encoders OrdinalEncoder
Rank Hot Encoding Category Encoders RankHotEncoder
During the coding process of categorical at-
tributes, we use the default settings of the cod-
ing methods except for the Dummy Encoding cod-
ing. For the Dummy Encoding technique, the
drop first pattern was changed, which removes
the first level of each column. This change results
in N-1 columns representing an attribute with a N
cardinality.
4.3 Learning Algorithms
This research employed six machine learning algo-
rithms to compare and determine the most effective
organization method among those presented. The al-
gorithms and their respective approaches were: De-
cision Tree - DecisionTreeClassifier, Random Forest
- RandomForestClassifier, Support Vector Machine
(SVM) - svm, Adaboost - AdaBoostClassifier, XG-
Boost - XGBClassifier, and Neural Network - MLP-
Classifier. During testing, all settings were changed to
their default settings, as the focus is on evaluating the
encodings, not the learning algorithms themselves.
We adopted a proportion of 80% for training and
20% for testing to divide the data.
We evaluated the model’s generalization using a
10-fold cross-validation. We use Python 3.10.9 at ev-
ery stage, from pre-processing to hypothesis testing.
Taking into account that the problem analyzed is
classification, the evaluation metric F1 Score
4
.
4.4 Interpretability
To assist in the interpretability of the model, we
adopted the SHAP (Lundberg and Lee, 2017) method,
through which it was possible to understand how the
model’s predictions are influenced by different re-
sources (attributes). We use the Dependence Plot as
4
F1-Score = 2 ×
Precision×Recall
Precision+Recall
HEALTHINF 2024 - 17th International Conference on Health Informatics
486

Table 3: Machine Learning Algorithm Metrics Results for Each Encoding.
Results for F1 Score (Mean/Standard Deviation)
Encoding AdaBoost Decision Tree Neural Network Random Forest SVM XGBoost
Count 0.6778/0.127 0.7106/0.1054 0.4547/0.0005 0.7698/0.1435 0.5725/0.1031 0.7202/0.1323
Customized One Hot 0.6993/0.0736 0.7475/0.1228 0.6752/0.164 0.7722/0.1565 0.6297/0.1056 0.7819/0.1011
Dummy 0.7119/0.0956 0.7390/0.1234 0.7022/0.1488 0.7687/0.1504 0.6297/0.1056 0.7761/0.0988
Frequency 0.6846/0.0746 0.7405/0.1017 0.4547/0.0005 0.7479/0.1471 0.6395/0.1205 0.7781/0.1071
Hash 0.7082/0.0894 0.7570/0.1159 0.6869/0.1438 0.7403/0.1640 0.6297/0.1056 0.7883/0.0935
One Hot 0.7123/0.0735 0.7395/0.1321 0.656/0.1034 0.7375/0.1563 0.6297/0.1056 0.761/0.1017
Ordinal 0.6954/0.0921 0.7605/0.1045 0.4547/0.0005 0.7585/0.1421 0.6395/0.1205 0.764/0.1013
Rank Hot 0.7036/0.1136 0.7366/0.1071 0.6879/0.1158 0.7646/0.1529 0.6297/0.1056 0.765/0.0981
a visual tool to deepen understanding of interpretable
and non-interpretable encodings.
5 RESULTS AND DISCUSSIONS
Table 3 presents the results of tests with six categor-
ical attribute encoding methods and ML algorithms.
The proper choice of encoding is crucial for accurate
outcomes, given the significance of nominal attributes
and the necessity of numeric data for ML algorithms.
The results are organized alphabetically based on
the encodings and learning algorithms. Additionally,
we highlight in bold the best encodings for each ML
algorithm. Considering the t-test, all tests were per-
formed with 95% confidence.
The study analyzed different encodings of cate-
gorical attributes in a database related to depression in
children and adolescents provided by the Federal Uni-
versity of Minas Gerais. The algorithms used were
AdaBoost, Decision Tree , Neural Networks, Random
Forest, SVM, and XGBoost.
”The learning algorithm that proved most effec-
tive in achieving the best encoding results was XG-
Boost. The encodings Hash, Customized One Hot,
Frequency, and Dummy yielded the highest F1 scores,
as confirmed through a t-test
5
with this algorithm.”
We use a method to assist with interpretability, as
it is essential to understand the meaning of each at-
tribute. In this case, how the attribute was encoded
can contribute to or harm the interpretability of the
explanations: both Hash, Frequency, and Count en-
coding have problems in terms of interpretability. For
example, in Figure 2, we present one of the SHAP
graphs, the Dependence Plot, with possible encodings
for the attribute “Lives with Who” from the Depres-
sion base. This graph aims to analyze the impact of a
given attribute on a set of database instances. On the
graph, each point presented represents an instance of
the base impacted by the attribute in the different en-
5
Hash: p-value: [0-0.0029], Customized One Hot: p-
value: [0-0.0375], Frequency: p-value: [0-0.0447], and
Dummy: p-value: [0]
codings. Such impact, measured by the SHAP value,
can be positive, negative, or null. In this case, the
instances whose SHAP value is negative are those in
which the attribute value hurts high depression. On
the other hand, instances with a positive SHAP value
are those whose attribute value contributes to high de-
pression symptoms.
In Figure 2a, in which the attribute was coded
with Ordinal Encoder, it is possible to notice the cases
in which the attribute “Lives with Who” always con-
tributed to the classification as low symptomatology
for depression (cases 1 – Mother and brothers, 2 - Fa-
ther, mother and brothers, 5 - Father and brothers, 8 -
Mother) and the cases in which always favored classi-
fication as high symptoms (cases 9 - Mother, brothers
and others, 10 - Father, mother and others, 11 - Fa-
ther, stepmother and others, 12 - Mother, stepfather
and others, 13 - Brothers and others, 14 - Father, 15
- Others, 16 - Father and others, 17 - Father, broth-
ers and others). In the remaining cases (3 – Grandfa-
ther and grandmother, 4 – Mother, siblings, and oth-
ers, 6 – Father and mother, 7 – Mother and others),
the attribute sometimes contributes to low symptoms
and, in others, to high symptoms. Primarily, we high-
light that in this encoding, it is possible to interpret
the model results with the behavior of the attribute.
In Figure 2b, observing the entry “col 1” gen-
erated in the Hash encoding, it is clear that when
“col 1” is equal to 0 (zero), we have negative val-
ues of SHAP value indicating favor low symptomatol-
ogy for depression. On the other hand, when “col 1”
is equal to 1 (one), the attribute contributes to high
depression symptoms. However, Hash functions are
unidirectional, making it impossible to revert to the
original values, which leads to the fact that “col 1”
has no meaning in the context of the problem, com-
promising the interpretability of the explanations to
be presented to the user and, possibly, its acceptance.
Finally, we work with the frequency and count en-
codings in Figures 2c and 2d. It is possible to ex-
tract interpretations of the attribute values as long as
different values represent different response options.
In frequency coding, each option is coded based on
how often it appears in the attribute, while in count
Assessment of the Relationship Between Attribute Coding and the Interpretability of Machine Learning Models: An Analysis in the Context
of Children and Adolescents with Depression
487
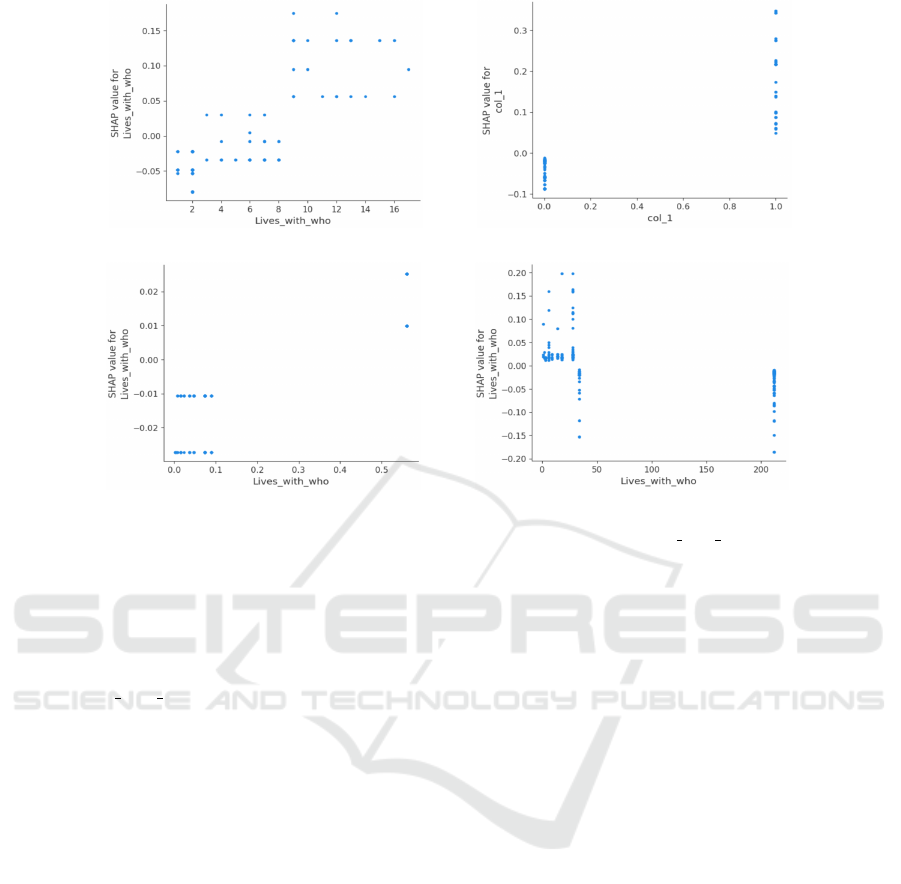
(a) Attribute encoded with ordinal encoder (b) Hash encoded attribute
(c) Frequency encoded attribute (d) Attribute encoded with count
Figure 2: Dependence plot with different encodings for the attribute “Lives with Who”
coding, the value represents the number of times the
answer option appears in the attribute. For example,
when we find the value 0.0158 in the frequency cod-
ing and the value 6 in the count coding for the at-
tribute “Lives
with Who” it could be any of the re-
sponse options: ‘Grandfather and Grandmother’, ‘Fa-
ther, Mother and Others’, ‘Mother, Stepfather and
Others’ and ‘Siblings and Others’, and it is not pos-
sible to determine which specific response option is
represented by these values in their respective encod-
ings.
Regarding cardinality, it is essential to note that
Hash, Customized One Hot, and Dummy coding tech-
niques increase the dimensionality of the data set. For
example, Hash encoding turns a single column into
eight columns, Customized One Hot encoding into
nine columns, and Dummy encoding into 19 columns.
This increase in dimensionality can become a prob-
lem due to increased computational cost, overfitting,
and analysis complexity.
The Neural Network and SVM learning algo-
rithms did not perform satisfactorily for this database,
considering the majority of encodings used.
Given the above, when it comes to coding, in the
case of this specific database, the best algorithm to
use is XGBoost. Furthermore, the user can choose
between Hash, Customized One Hot, Frequency, and
Dummy encodings, depending on what they want: a
higher F1 Score or the interpretability of the results.
6 FINAL CONSIDERATIONS
This study aimed to investigate the existence of a
technique for coding non-ordinal nominal attributes
that demonstrates consistent results when applied to
ML algorithms in a healthcare database linked to de-
pression in children and adolescents, as well as ob-
serve whether it is interpretable. Several unsupervised
coding techniques were explored, each with its advan-
tages and limitations.
Analyzing each algorithm’s metrics and applying
the t-test made it possible to evaluate the performance
of the different coding techniques. In the tests carried
out, it was observed that the Hash, Customized One
Hot, Frequency, and Dummy encodings achieved su-
perior performance, although not all of them were in-
terpretable. However, there is room to improve the
pipeline used in order to obtain more satisfactory re-
sults. This includes fine-tuning the parameters of ML
encodings and algorithms. Pay special attention to
hash encoding, exploring different types of Hash en-
coding, and adjusting the number of bits used.
Encoding nominal categorical attributes is an ef-
ficient solution to deal with the qualitative nature of
these attributes. It transforms categories into suitable
numeric representations, effectively using this infor-
mation in ML algorithms. This leads to more accurate
and efficient solutions, advances in data analysis, and
assists in decision-making, especially in the health-
HEALTHINF 2024 - 17th International Conference on Health Informatics
488

care sector.
For future research, it is recommended to investi-
gate broader healthcare datasets to validate different
hit techniques, varying in size and complexity. These
analyses should include databases with high cardi-
nality to compare supervised and unsupervised ap-
proaches, improving programming techniques in ma-
chine learning projects in healthcare.
ACKNOWLEDGEMENTS
The authors thank the National Council for Scien-
tific and Technological Development of Brazil (CNPq
- Conselho Nacional de Desenvolvimento Cient
´
ıfico
e Tecnol
´
ogico – Code: 311573/2022-3), the Pon-
tif
´
ıcia Universidade Cat
´
olica de Minas Gerais –
PUC-Minas, the Coordination for the Improvement
of Higher Education Personnel - Brazil (CAPES –
Grant PROAP 88887.842889/2023-00 – PUC/MG,
Grant PDPG 88887.708960/2022-00 – PUC/MG -
Inform
´
atica and Finance Code 001), and the Foun-
dation for Research Support of Minas Gerais State
(FAPEMIG – Code: APQ-03076-18).
REFERENCES
Association, A. P. et al. (2014). DSM-5: Manual
diagn
´
ostico e estat
´
ıstico de transtornos mentais.
Artmed Editora.
Bal
´
azs, J., Mikl
´
osi, M., Kereszt
´
eny,
´
A., Hoven, C. W., Carli,
V., Wasserman, C., Apter, A., Bobes, J., Brunner, R.,
Cosman, D., et al. (2013). Adolescent subthreshold-
depression and anxiety: Psychopathology, functional
impairment and increased suicide risk. Journal of
child psychology and psychiatry, 54(6):670–677.
Bernaras, E., Jaureguizar, J., and Garaigordobil, M. (2019).
Child and adolescent depression: A review of theo-
ries, evaluation instruments, prevention programs, and
treatments. Frontiers in psychology, 10:543.
Breskuvien
˙
e, D. and Dzemyda, G. (2023). Categori-
cal feature encoding techniques for improved classi-
fier performance when dealing with imbalanced data
of fraudulent transactions. International Journal of
Computers Communications & Control, 18(3).
Buckman, J., Roy, A., Raffel, C., and Goodfellow, I. (2018).
Thermometer encoding: One hot way to resist adver-
sarial examples. In International conference on learn-
ing representations.
Cerda, P. and Varoquaux, G. (2022). Encoding high-
cardinality string categorical variables. IEEE Transac-
tions on Knowledge and Data Engineering, 34:1164–
1176.
Chu, S.-H., Lenglet, C., Schreiner, M. W., Klimes-Dougan,
B., Cullen, K., and Parhi, K. K. (2018). Classifying
treated vs. untreated mdd adolescents from anatomical
connectivity using nonlinear svm. In 2018 40th An-
nual International Conference of the IEEE Engineer-
ing in Medicine and Biology Society (EMBC), pages
1–4.
Coutinho, M. P. L., Oliveira, M. X., Pereira, D. R., and
Santana, I. O. (2014). Indicadores psicom
´
etricos do
invent
´
ario de depress
˜
ao infantil em amostra infanto-
juvenil. Avaliac¸ao Psicologica: Interamerican Jour-
nal of Psychological Assessment, 13:269–276.
Hankin, B. L. (2006). Adolescent depression: Descrip-
tion, causes, and interventions. Epilepsy & Behavior,
8(1):102–114.
Herrman, H., Kieling, C., McGorry, P., Horton, R., Sargent,
J., and Patel, V. (2019). Reducing the global burden
of depression: a lancet–world psychiatric association
commission. The Lancet, 393(10189):e42–e43.
Kim, D., Kang, P., Kim, J., Kim, C. Y., Lee, J.-H., Suh,
S., and Lee, M.-S. (2019). Machine learning classi-
fication of first-onset drug-naive mdd using structural
mri. IEEE Access, 7:153977–153985.
Kotsiantis, S. B., Kanellopoulos, D., and Pintelas, P. E.
(2006). Data preprocessing for supervised leaning.
International journal of computer science, 1(2):111–
117.
Kovalerchuk, B. and McCoy, E. (2023). Explain-
able machine learning for categorical and mixed
data with lossless visualization. arXiv preprint
arXiv:2305.18437.
Kuhn, M. and Johnson, K. (2019). Feature Engineering
and Selection: A Practical Approach for Predictive
Models. CRC Press.
Lundberg, S. M. and Lee, S.-I. (2017). A unified approach
to interpreting model predictions. In Advances in neu-
ral information processing systems, pages 4765–4774.
PAHO (2022). Depression. https://www.paho.org/en/topics
/depression.
Pargent, F., Pfisterer, F., Thomas, J., and Bischl, B.
(2022). Regularized target encoding outperforms tra-
ditional methods in supervised machine learning with
high cardinality features. Computational Statistics,
37:2671––2692.
Roy, B. (2019). All about categorical variable encoding.
Vellido, A. (2020). The importance of interpretability and
visualization in machine learning for applications in
medicine and health care. Neural computing and ap-
plications, 32(24):18069–18083.
WHO (2021). Depression. https://www.who.int/news-roo
m/fact-sheets/detail/adolescent-mental-health.
Yu, K.-H., Beam, A. L., and Kohane, I. S. (2018). Artifi-
cial intelligence in healthcare. Nature biomedical en-
gineering, 2(10):719–731.
Assessment of the Relationship Between Attribute Coding and the Interpretability of Machine Learning Models: An Analysis in the Context
of Children and Adolescents with Depression
489
