Feature Selection for Unsupervised Anomaly Detection and Localization
Using Synthetic Defects
Lars Heckler
1,2
and Rebecca K
¨
onig
1
1
MVTec Software GmbH, Germany
2
Technical University of Munich, Germany
Keywords:
Anomaly Detection, Feature Selection, Visual Inspection, Synthetic Defects.
Abstract:
Expressive features are crucial for unsupervised visual Anomaly Detection and Localization. State-of-the-art
methods like PatchCore or SimpleNet heavily exploit such features from pretrained extractor networks and
model their distribution or utilize them for training further parts of the model. However, the layers com-
monly used for feature extraction might not represent the optimal choice for reaching maximum performance.
Thus, we present the first application-specific feature selection strategy for the task of unsupervised Anomaly
Detection and Localization that identifies the most suitable layer of a pretrained feature extractor based on
the performance on a synthetic validation set. The proposed selection strategy is applicable to any feature
extraction-based AD method and may serve as a competitive baseline for future work by not only outperform-
ing single-layer baselines but also features ensembled from multiple layer outputs.
1 INTRODUCTION
Detecting and localizing anomalies in natural im-
ages is an important task in modern computer vi-
sion. Anomalies manifest themselves in various ways
such as structural defects (Bergmann et al., 2019a;
Zou et al., 2022) or the violation of logical con-
straints (Bergmann et al., 2022). Consequently, the
task of Anomaly Detection and Localization (AD)
has a wide range of application areas reaching from
the medical domain (Seeb
¨
ock et al., 2020; Menze
et al., 2015) over autonomous driving (Blum et al.,
2019; Hendrycks et al., 2019) and video surveillance
(Nazare et al., 2018; Li et al., 2013) to industrial in-
spection (Bergmann et al., 2019a; Zou et al., 2022).
Especially within the industrial context AD depicts a
crucial tool for quality assurance. Since modern pro-
duction lines are highly automated and aim for maxi-
mum production quality it is difficult to acquire de-
fective samples that can be used within the design
phase of an AD system. Besides, all possible defect
types that might occur for a product cannot be known
prior to the launch of fabrication. For these reasons,
the task of industrial AD is predominantly tackled in
an unsupervised way, where the training of the AD
method only requires anomaly-free samples.
Within the domain of unsupervised AD, methods
that are built on top of pretrained networks have be-
come popular. These pretrained networks such as
ResNets (He et al., 2016) trained for ImageNet classi-
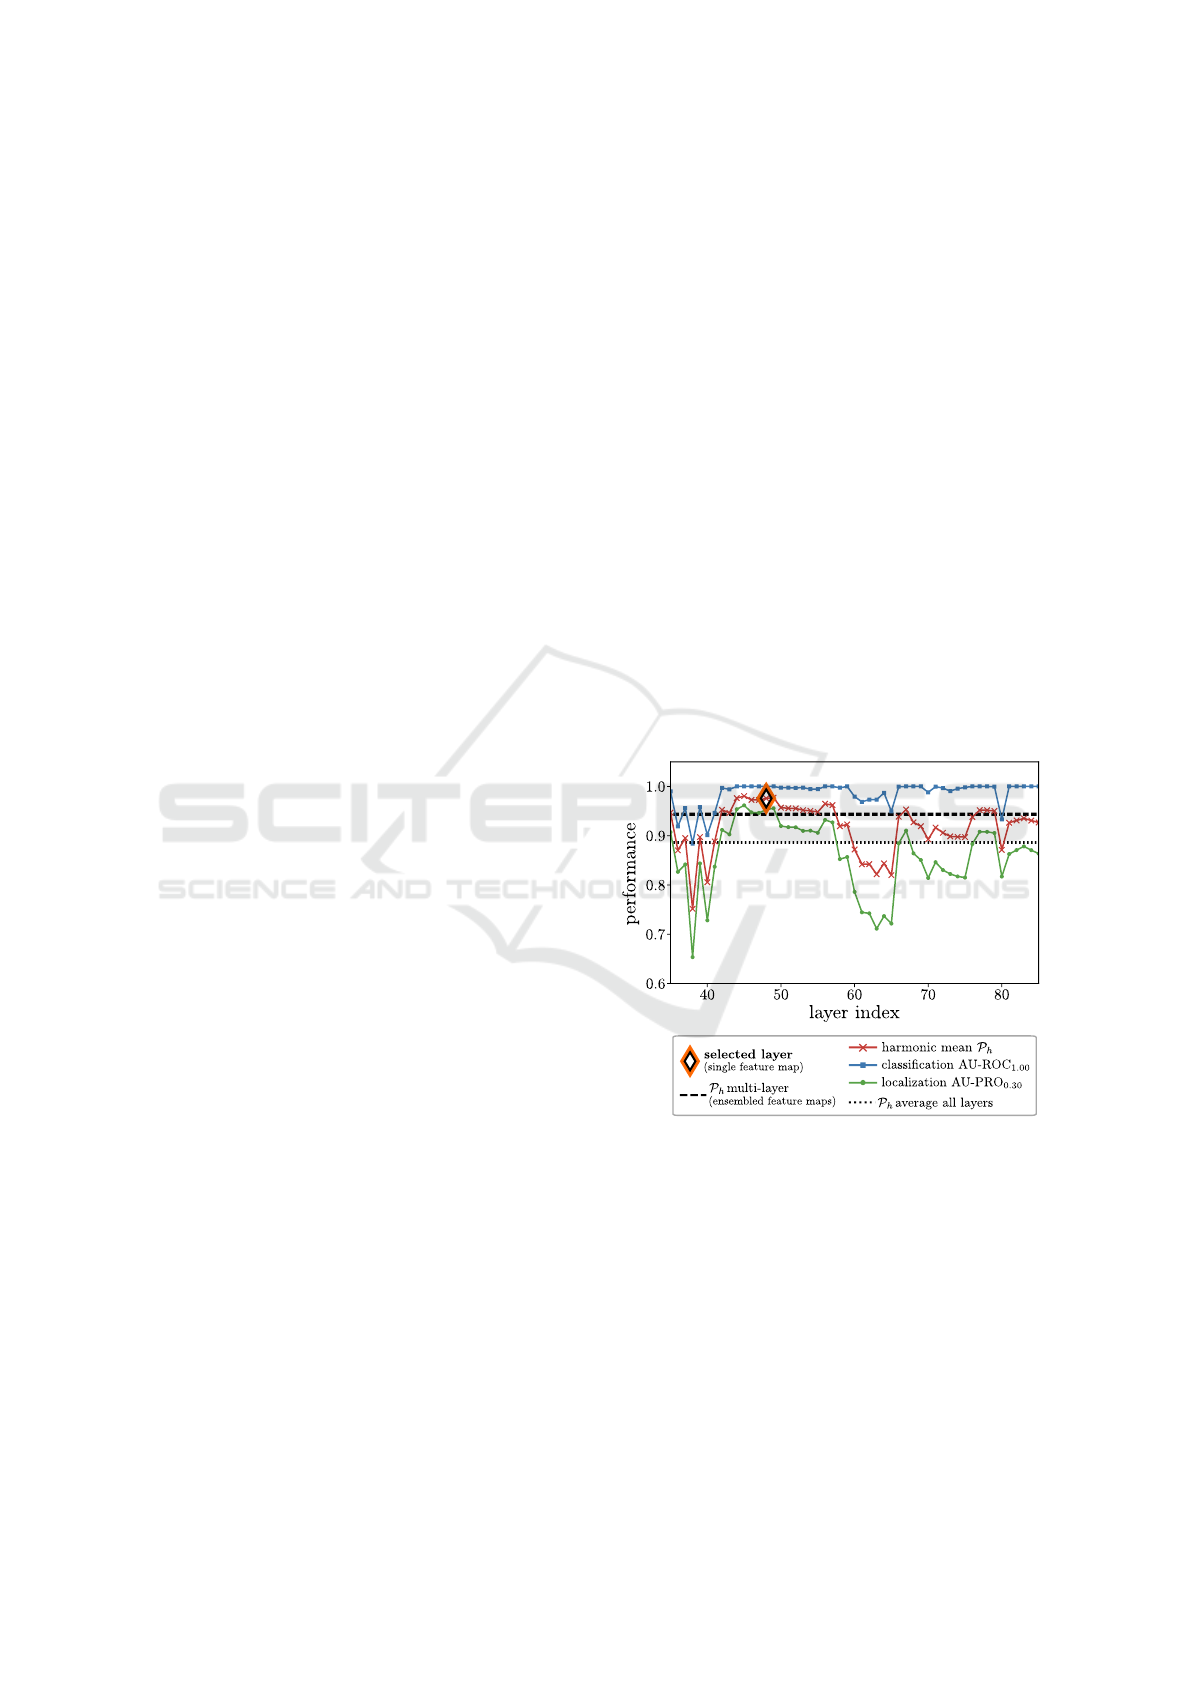
Figure 1: Application-specific feature selection for Patch-
Core. Performance of a layer is shown when exclusively
utilizing its corresponding feature map from the feature ex-
tractor. Using the features of a single Wide ResNet-50 layer
chosen by the proposed application-specific selection strat-
egy can practically improve the harmonic mean P
h
between
anomaly classification and localization over several base-
lines, even over features ensembled from multiple layers, as
shown here for MVTec AD object tile.
fication (Krizhevsky et al., 2012) are used for extract-
ing features from the input images and stay frozen
during both training and inference time. Here, the un-
derlying assumption for solving the task of Anomaly
Detection is that the feature extractor generates dis-
154
Heckler, L. and König, R.
Feature Selection for Unsupervised Anomaly Detection and Localization Using Synthetic Defects.
DOI: 10.5220/0012385500003660
Paper published under CC license (CC BY-NC-ND 4.0)
In Proceedings of the 19th International Joint Conference on Computer Vision, Imaging and Computer Graphics Theory and Applications (VISIGRAPP 2024) - Volume 3: VISAPP, pages
154-165
ISBN: 978-989-758-679-8; ISSN: 2184-4321
Proceedings Copyright © 2024 by SCITEPRESS – Science and Technology Publications, Lda.

tinct features for anomaly-free and anomalous images
that can then be exploited to differentiate between
these two classes. Moreover, extracting features on
a local patch level might allow a precise localization
of a defect (Roth et al., 2022; Defard et al., 2020).
Commonly, the extracted features originate from
the same layers of the feature extractor for every ap-
plication scenario. However, recently Heckler et al.
(2023) systematically analyzed the importance of pre-
trained feature extractors for unsupervised AD and
the corresponding choice of features. They found
that existing state-of-the-art AD methods are highly
sensitive to the particular choice of feature extrac-
tor and layer. In addition, the potential benefits in
performance of using distinct feature layers for dis-
tinct application scenarios was highlighted. Moti-
vated by these findings, we ask how to determine
the features of a pretrained feature extractor that are
most suitable for a specific AD task without requir-
ing access to any real defective samples. The pro-
posed feature selection strategy builds upon the gen-
eration of synthetic defects to estimate the suitabil-
ity of a layer to provide expressive features for the
given task. Extensive experiments demonstrate the ef-
fectiveness and feasibility of application-specific fea-
ture selection for Anomaly Detection and Localiza-
tion, exemplarily shown in Figure 1. In particular, our
key contributions are:
• We present the first feature selection strategy for
the task of unsupervised Anomaly Detection and
Localization that builds a competitive baseline for
future work within this research direction.
• Applying the proposed selection strategy that
does not require any real defective data we
demonstrate that it is feasible to select the features
of a single layer to obtain performances compara-
ble or superior to feature ensembling approaches.
• By fine-grained experiments we confirm the im-
portance of incorporating feature selection strate-
gies into future method development since com-
mon choices of feature layers are not guaranteed
to be optimal for a specific approach and applica-
tion scenario.
2 RELATED WORK
As outlined by recent surveys (Liu et al., 2023a;
Cui et al., 2023; Prunella et al., 2023), the task of
Anomaly Detection and Localization can be tackled
in various ways. Generally, Anomaly Detection meth-
ods can be separated into reconstruction-based and
embedding-based methods. Reconstruction-based
methods use network architectures such as convolu-
tional autoencoders (Masci et al., 2011) or Generative
Adversarial Networks (Goodfellow et al., 2014) to
learn the appearance of anomaly-free samples. After
training exclusively on such anomaly-free data their
reconstructions during inference erase the defects in
the anomalous test data. Consequently, comparing
the input image with its reconstruction results in large
deviations that indicate the presence of an anomaly
(Bergmann et al., 2019b; Akc¸ay et al., 2019; Luo
et al., 2023). Embedding-based methods try to model
the distribution of normal images in a predefined la-
tent space. During inference, images outside of this
distribution are considered as anomalous (Roth et al.,
2022; Defard et al., 2020; Cohen and Hoshen, 2020).
Combinations of both approaches also exist such as
student-teacher networks. Utilizing Knowledge Dis-
tillation (Hinton et al., 2015; Ba and Caruana, 2014) a
student network learns to imitate the embedding of
a pretrained teacher network on anomaly-free data.
Consequently, at test time the student fails to imitate
the teacher for data containing defects. The discrep-
ancy in the output of the two networks is used to de-
tect the anomalies (Bergmann et al., 2020; Rudolph
et al., 2023; Bergmann et al., 2022).
Pretrained Feature Extractors. Especially
embedding-based and student-teacher approaches
extensively make use of pretrained feature extrac-
tors to obtain distinctive features for anomaly-
free and defective samples, respectively (Rip-
pel et al., 2021; Reiss et al., 2021; Defard
et al., 2020; Roth et al., 2022). These feature
extractors such as ResNets (He et al., 2016),
Wide ResNets (Zagoruyko and Komodakis, 2016),
DenseNets (Huang et al., 2017) or EfficientNets
(Tan and Le, 2019) are usually pretrained on large
classification tasks like ImageNet (Krizhevsky et al.,
2012) and remain fixed during training of the AD
method. For instance, concatenating feature maps of
different hierarchy levels of the extractor PaDiM (De-
fard et al., 2020) models the distribution of normal
image patches by a multivariate Gaussian. Similarly,
Cohen and Hoshen (2020) retrieve features on image
level and use k-nearest-neighbors to determine the
average distance of the test image to the normal
training data. The state-of-the-art method PatchCore
(Roth et al., 2022) creates a feature memory bank by
subsampling the overall set of normal patch-features
with a coreset-selection strategy (Sener and Savarese,
2018). Again, the locally aware patch-features
combine feature maps from multiple layers of the
extractor. The distance of a test patch-feature to this
nominal memory bank defines the scoring function
Feature Selection for Unsupervised Anomaly Detection and Localization Using Synthetic Defects
155

for detecting and localizing anomalies.
Synthetic Defects for Unsupervised Anomaly De-
tection. The lack of defective samples for training
AD systems has led to the development of various
approaches to generate and exploit synthetic defects.
CutPaste (Li et al., 2021) cuts random image patches
from a defect-free image and pastes them into another
one. Schl
¨
uter et al. (2022) expand this strategy by
Poisson image editing (P
´
erez et al., 2003) and back-
ground segmentation to obtain synthetic anomalies
with a more natural appearance. Subsequently, both
of these synthetic defect generation techniques are
integrated into a self-supervised learning framework.
Synthetic defects on image level are also exploited to
obtain more expressive features for the given AD task
(Cao et al., 2023). Likewise, perturbations in the fea-
ture space are intended to reflect synthetic abnormali-
ties as well (Zavrtanik et al., 2022; Liu et al., 2023b).
These perturbations may be used to train an anomaly
detection module to distinguish normal from anoma-
lous features. (Zavrtanik et al., 2022). SimpleNet (Liu
et al., 2023b) further first utilizes a dedicated feature
adaption module before adding Gaussian noise to the
already adapted features. Subsequently, a discrimina-
tor network learns to distinguish normal from anoma-
lous features.
Feature Selection for Anomaly Detection.
Whereas the ideal properties of a feature for the
task of Anomaly Detection and Localization are
straightforward to define – similar for images or
image patches from the anomaly-free class but far
off from this distribution for anomalous samples
or patches – selecting such distinctive features
from a pretrained feature extractor is a much more
challenging problem. Therefore, concatenating
feature maps from different hierarchy levels has
become a prominent approach for building expressive
features (Roth et al., 2022; Defard et al., 2020; Liu
et al., 2023b; Yu et al., 2021). Here, fine-grained
details from earlier layers are usually joined with
the high-level abstraction capability of later layers.
However, recent work demonstrates that features
extracted from a single layer of the extractor can
lead to comparable or even superior performance for
state-of-the-art AD methods (Heckler et al., 2023),
provided that these single-layer-features are selected
individually for each application scenario.
In this paper, we follow this line of work and
propose a feature selection strategy for unsupervised
AD when only considering a single layer for extract-
ing features. Here, opposed to Heckler et al. (2023)
who theoretically evaluate the potential of choosing
an application-specific feature layer, we present and
validate a strategy that can be implemented in real-
world applications. Besides, we provide more fine-
grained insights into the importance of feature selec-
tion by considering a substantially larger set of layers
to choose from. To the best of our knowledge, we
are the first to propose such a feature selection strat-
egy for the task of Anomaly Detection and Localiza-
tion. Accordingly, apart from the practical benefit,
our method may also serve as a baseline for future
research in this field.
3 METHOD
For identifying the most expressive features for a spe-
cific AD scenario we first investigate whether certain
layers can be excluded from the overall set of layers
of a pretrained feature extractor to define the solu-
tion space (Sec. 3.1). Thereafter, the techniques used
to generate synthetic defects for our selection strat-
egy are explained in detail (Sec. 3.2). Finally, the
proposed application-specific selection strategy that
identifies the most suitable layer for feature extraction
is described (Sec. 3.3).
3.1 Layers Extracting Expressive
Features
Using features from pretrained feature extractors for
the task of unsupervised AD allows for choosing from
a wide range of potential features. In theory, the fea-
ture map F ∈ R
H×W×C
generated by any layer L of
the extractor might be useful for the given application.
Commonly, features from earlier layers are assumed
to provide too little abstraction of the characteristics
of the input image, whereas layers from the end of the
extractor might be biased towards the pretraining task
such as ImageNet classification (Roth et al., 2022).
To investigate whether these assumptions are valid we
analyze the set of potential features for an AD appli-
cation as follows. Given an AD scenario and a pre-
trained feature extractor X
pre
consisting of n layers
L = {L
i
}
i=1...n
, we obtain the overall set of features
F by forwarding the anomaly-free training images
S
AD,train
through X
pre
and extracting the features of
every layer L
i
∈ L, such that
F =
{
F
i
|F
i
= X
pre,i
(S
AD,train
), i = 1, . . . , n
}
. (1)
Here, X
pre,i
defines the feature extraction of the i-th
layer L
i
in X
pre
. Considering only the features of a
single layer we train the AD system with F
i
and then
evaluate the performance on the test set S
AD,test
. The
VISAPP 2024 - 19th International Conference on Computer Vision Theory and Applications
156
Figure 2: Synthetic defect types utilized within our feature
selection strategy with corresponding ground truth maps.
features for the test set are extracted from the same
layer L
i
∈ L of X
pre
as for S
AD,train
.
Overall, by this fine-grained pre-analysis we ex-
plore whether it is possible to reduce the initial set
of features to F
red
⊆ F based on certain attributes of
the corresponding layers such as the layer type or its
position within the extractor network. Accordingly,
the layers L
red
⊆ L generating these features repre-
sent the set of layers to choose from for our feature
selection strategy (Sec. 3.3).
3.2 Synthetic Defect Generation
The generation of synthetic defects has become a
technique widely used in the domain of unsupervised
AD (Cao et al., 2023; Zavrtanik et al., 2021; Guo
et al., 2023; Zhang et al., 2023). We propose to exploit
this technique for feature selection. In particular, we
generate three different kinds of synthetic anomalies.
Simple Synthetic Anomalies. Given an anomaly-
free image x
good
∈ R
H×W×C
we randomly determine
an axis-aligned rectangular region of size H
rand
×
W
rand
that fits the original image dimensions. Then,
the pixel values inside this region are set to 0 in ev-
ery channel C of the image x
good
to obtain the image
containing the simple synthetic defect x
bad,syn
. Visu-
ally, this results in a black rectangular area as shown
in Fig. 2.
CutPaste for Synthetic Anomalies. Inspired by Li
et al. (2021) we build upon their proposed CutPaste
strategy to obtain images with artificial defects. Here,
a region from an anomaly-free source image x
good,src
is cut out and the resulting crop is pasted into an
anomaly-free target image x
good,tar
to obtain x
bad,syn
.
Both the size and position of the crop in the source
image and the paste position in the target image are
chosen randomly and independently from one an-
other. Figure 2 illustrates some synthetic anomalies
obtained through CutPaste.
Natural Synthetic Anomalies (NSA). In order to
create synthetic defects with a more realistic appear-
ance than the Simple or CutPaste defects we make
use of a technique proposed by Schl
¨
uter et al. (2022).
Here, random crops from the anomaly-free source im-
age are scaled before pasting them into the anomaly-
free target image. To obtain a more seamless blending
Poisson image editing (P
´
erez et al., 2003) is utilized.
Besides, a threshold operation is applied to x
good,src
and x
good,tar
that is intended to separate the object
from the background. The crop and paste positions
need to be inside the foreground region. Thus, the
synthetic defects are likely to appear on the actual ob-
ject and seem more natural (Fig. 2). The implemen-
tation of NSA also allows multiple defective regions
in x
good,tar
in contrast to the other two defect types,
where we only generate one anomalous region in the
image.
3.3 Feature Selection Using Synthetic
Defects
Given a set of layers L of the pretrained feature ex-
tractor X
pre
, the task of feature selection is to identify
the layer L
∗
which generates the optimal features for a
specific AD scenario. Here, we consider the optimal
layer L
∗
as the layer leading to the best AD perfor-
mance when using its corresponding feature maps as
extracted features. Feature selection can thus be for-
malized as L
∗
= select (L) (Heckler et al., 2023).
We propose to utilize synthetic defects for defin-
ing the select-function (Fig. 3). In particular, we
split the anomaly-free training set of an AD scenario
S
AD,train
into two disjoint parts D
T
and D
V
. The first
part D
T
remains unchanged for training the AD sys-
tem, whereas the second part D
V
is split again dis-
jointly into D
V 1
and D
V 2
. Both D
V 1
and D
V 2
still
only contain anomaly-free images. Now, the images
in D
V 2
are augmented with synthetic defects, such
that D
V 2
becomes D
V,bad
. For ease of notation we ac-
cordingly denote D
V 1
as D
V,good
. In total we thus ob-
tain three non-overlapping dataset splits D
T
, D
V,good
and D
V,bad
from the original training set S
AD,train
. Us-
ing the features from a specific layer L the AD system
is trained using D
T
. The trained model M
L
is then
evaluated on the union of D
V,good
and D
V,bad
, the syn-
thetic validation set D
V,syn
, with corresponding per-
formance P {M
L
(D
V,syn
)}. The optimal layer L
∗
to
be selected is the one maximizing P :
L
∗
= select (L) = arg max
L∈L
P {M
L
(D
V,syn
)} (2)
Feature Selection for Unsupervised Anomaly Detection and Localization Using Synthetic Defects
157

Figure 3: Feature Selection for Anomaly Detection. From the original training set S
AD,train
a validation set D
V
and training
set D
T
are created. A part of D
V
is augmented with synthetic defects to obtain the synthetic validation set D
V,syn
that contains
both anomalous and anomaly-free images. The selected layer L
∗
is the layer leading to the best performance on D
V,syn
when
using its corresponding features for training the feature-extraction based AD method M .
We assume that the features of the layer selected
based on synthetic defects are also expressive for de-
tecting defects that occur in real-world applications
and, consequently, lead to high AD performance of
the corresponding model M
L
∗
.
4 EXPERIMENTS AND RESULTS
In this section we analyze the applicability of our pro-
posed feature selection strategy. Generally, the model
M
L
∗
using the features of the layer L
∗
selected with-
out any real defective sample is evaluated on real
test datasets D
test
. For this, we first describe the
implementation details of our experiments, the used
datasets and evaluation metrics. Then, we conduct
a pre-analysis on the performance of layers to iden-
tify the solution space (Sec. 4.1) for our main exper-
iment that validates the proposed selection strategy
(Sec. 4.2). Further, we compare our single-layer re-
sults to multi-layer state-of-the-art performance (4.3)
and provide ablation studies on e.g. the selection cri-
terion (Sec. 4.4).
Implementation Details. In our experiments we
consider two different methods for unsupervised AD:
PatchCore (Roth et al., 2022) and SimpleNet (Liu
et al., 2023b). While PatchCore directly uses the
extracted features from a pretrained feature extrac-
tor to model the feature space without any fur-
ther training, SimpleNet tries to adapt these fea-
tures for the present AD task to the target domain.
As feature extractors we investigate the widely used
Wide ResNet-50 (Zagoruyko and Komodakis, 2016)
and DenseNet-201 (Huang et al., 2017). Since each
layer might provide expressive features for the given
AD task (Sec. 4.1), we cannot discard any layer in ad-
vance and train both methods for each layer of those
networks (L
red
≡ L). For extracting features, we use
the feature extraction package
1
of torchvision in Py-
Torch (Paszke et al., 2019). This results in analyz-
ing 172 layers for Wide ResNet-50 and 708 layers for
DenseNet-201. We use the official implementations
of PatchCore
2
and SimpleNet
3
. In the PatchCore im-
plementation we fix the size of the coreset to 1000.
We train SimpleNet for 160 epochs and report the re-
sult of the final model. For both methods we zoom
input images to 256 × 256 spatial dimensions without
center cropping.
Datasets. We train and evaluate individually on
all 15 object categories of the MVTec AD dataset
(Bergmann et al., 2019a). For the synthetic anomaly
generation, we split the original train split S
AD,train
of
each dataset category into a train (D
T
) and a valida-
tion split (D
V
) that contain 70% and 30% of the orig-
inal training images, respectively. Of the validation
split D
V
75% of the images are modified to contain
synthetic anomalies (D
V,bad
) and the remaining 25%
of the images are not changed (D
V,good
). This good to
bad ratio approximates the ratio in the real test set but
remains constant for each object category.
Evaluation Metrics. In our experiments we evalu-
ate both the quality of anomaly detection and anomaly
localization. For anomaly detection on image-level
we report the area under the receiver operator charac-
teristic curve (AU-ROC). For anomaly localization on
1
pytorch.org/vision/stable/feature extraction.html
2
github.com/amazon-science/patchcore-inspection
3
github.com/DonaldRR/SimpleNet
VISAPP 2024 - 19th International Conference on Computer Vision Theory and Applications
158
pixel-level we use the area under per-region-overlap
curve (AU-PRO) (Bergmann et al., 2019a). As sug-
gested by Bergmann et al. (2019a) we integrate the
PRO-curve only up to a false positive rate of 0.3
(AU-PRO
0.30
) using the official evaluation code
4
. On
image-level, we report the full area (AU-ROC
1.00
).
Heckler et al. (2023) showed that distinct fea-
ture layers may be optimal for the respective task,
detection and localization. However, considering
real-world applicability we want to select a layer
that solves both tasks adequately. Therefore, we
compute the harmonic mean P
h
of AU-ROC
1.00
and
AU-PRO
0.30
and use this metric as performance mea-
sure
P
h
=
2 · AU-ROC
1.00
· AU-PRO
0.30
AU-ROC
1.00
+ AU-PRO
0.30
. (3)
The harmonic mean heavily penalizes if one of the
performance metrics is small and the other one is
large, in contrast to the arithmetic mean (Komi
´
c,
2011). In real-world applications, achieving satisfac-
tory results on both classifying and localizing anoma-
lies is a vital characteristic of an AD system.
4.1 Can We Reduce the Initial Set of
Layers?
In order to analyze whether it is possible to reduce
the initial set of layers and, thus, features to choose
from, we first group all available layers of a fea-
ture extractor according to their hierarchical position
within the extractor and their layer type. Exemplary
shown for MVTec AD object grid when using Patch-
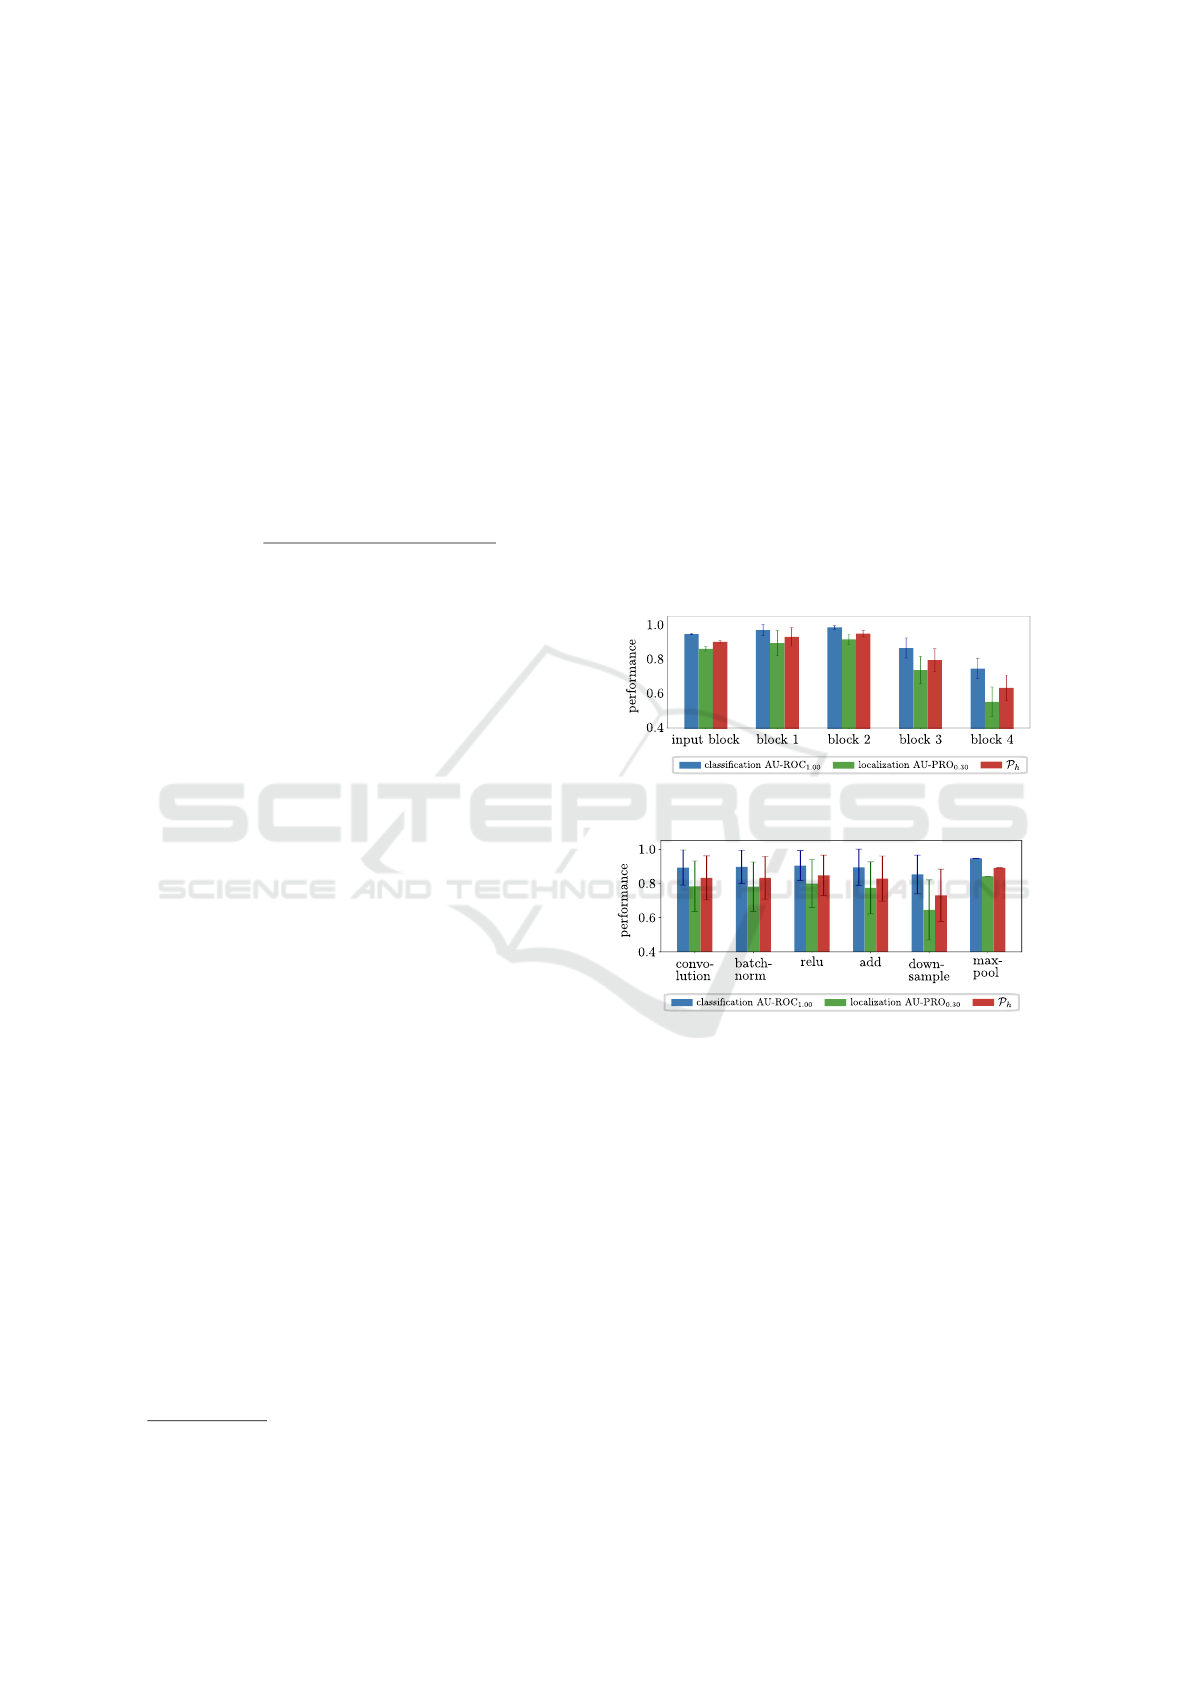
Core with a Wide ResNet-50 feature extractor, at first
glance the results in Figure 4a indicate that later layers
containing higher-level semantics have the tendency
to perform slightly worse than earlier layers or even
layers from the input block. However, as shown in
the appendix, these patterns vary significantly for dif-
ferent object categories. Likewise, patterns obtained
by grouping the feature performances by their corre-
sponding layer type are also very object-specific. In
addition, even for one object category we can observe
that features from any layer type might lead to high
performance (Fig. 4b).
Heckler et al. (2023) hypothesized that a pre-
selection of suitable layers based on the relative re-
ceptive field size might be possible. Therefore, we
also determine the effective receptive field size (Luo
et al., 2016) of each layer and divide it by the input
image size to obtain this attribute. Figure 5 shows the
AD performance over the relative receptive field size
for PatchCore and both analyzed feature extractors,
4
mvtec.com/company/research/datasets/mvtec-ad
averaged over all 15 MVTec AD objects. Though an
optimal range of the receptive field size seems to exist
here in general, the performance variations within this
range are still too large to use this attribute as a pre-
selection criterion. Moreover, the potentially ideal
range not only changes for distinct feature extractors
but also varies significantly when using other methods
such as SimpleNet, as shown in the appendix.
Considering all results from our extensive pre-
analysis we find that it is not possible to reduce the
initial set of all layers L based on the analyzed layer
attributes. Too many variations for distinct object-
categories, feature extractors and AD methods occur.
Therefore, rather than defining application-specific
pre-selection criteria we developed a universal feature
selection strategy that can cope with all these chal-
lenges to a certain extend, as presented within the next
section.
(a) Wide ResNet-50 blocks.
(b) Layer type.
Figure 4: AD metrics on real test set of MVTec AD ob-
ject grid. Shown is for each metric the mean with standard
deviation over all layers belonging to same block (a) and
all layers of same type (b) in Wide ResNet-50, trained with
PatchCore.
4.2 Feature Selection Using Synthetic
Defects
Our proposed feature selection strategy is based on
synthetic defects. We generate three different types of
synthetic defects, namely Simple, CutPaste and Nat-
ural Synthetic Anomalies (NSA), becoming more and
more complex and realistic in this order. The idea is
to transfer the AD performance from the synthetic to
real data. For each defect type we select the layer
L
∗
for which the model performs best on the syn-
Feature Selection for Unsupervised Anomaly Detection and Localization Using Synthetic Defects
159
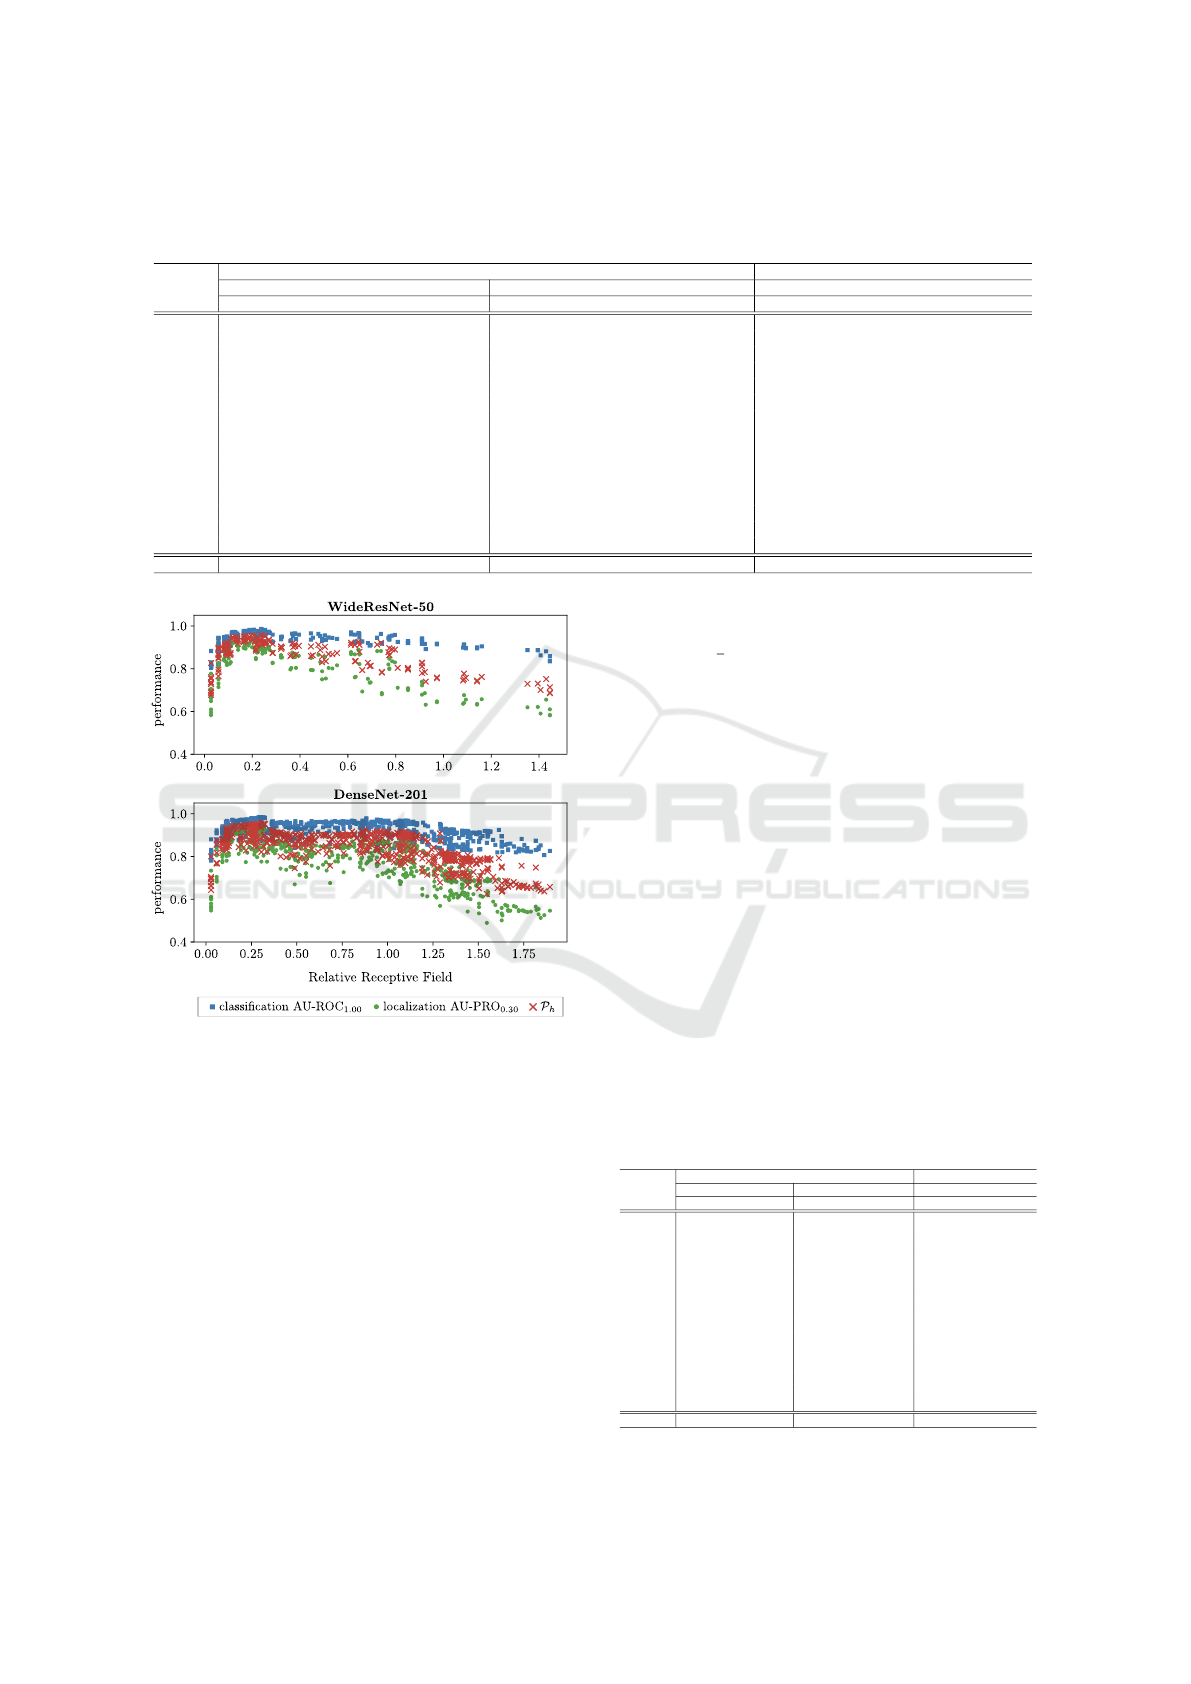
Table 1: Harmonic mean P
h
of AU-ROC
1.00
and AU-PRO
0.30
on the real test set of MVTec AD for the selected layers of each
defect type. The last column baseline is the average performance of all layers. For each object, feature extractor and anomaly
detection method, the best result is marked in bold.
PatchCore SimpleNet
WideResNet50 DenseNet201 WideResNet50
object Simple CutPaste NSA baseline Simple CutPaste NSA baseline Simple CutPaste NSA baseline
bottle 88.4 ± 0.9 94.1 ± 0.8 98.0 ± 0.2 91.0 ± 0.2 94.0 ± 0.2 95.0 ± 0.2 97.4 ± 0.3 90.9 ± 0.0 74.4 ± 22.2 91.0 ± 0.4 93.8 ± 0.7 42.8 ± 1.3
cable 77.1 ± 23.1 93.2 ± 1.2 93.9 ± 1.1 81.3 ± 0.2 93.5 ± 1.9 93.9 ± 0.8 94.7 ± 0.3 83.4 ± 0.1 47.7 ± 9.6 80.5 ± 2.1 87.9 ± 0.7 38.0 ± 0.5
capsule 97.4 ± 0.4 91.7 ± 0.5 97.5 ± 0.5 87.3 ± 0.1 90.8 ± 4.7 89.1 ± 1.3 92.6 ± 2.7 81.2 ± 0.1 85.5 ± 2.2 91.3 ± 1.5 77.8 ± 6.9 35.6 ± 0.6
carpet 73.1 ± 4.5 89.2 ± 8.0 90.2 ± 1.5 89.8 ± 0.1 80.5 ± 9.7 94.7 ± 0.8 85.7 ± 6.7 89.6 ± 0.0 52.8 ± 19.9 87.8 ± 0.4 81.3 ± 4.8 59.0 ± 0.2
grid 90.1 ± 1.3 84.9 ± 1.3 97.8 ± 0.8 83.7 ± 0.3 97.7 ± 0.3 87.3 ± 3.2 97.4 ± 0.8 71.1 ± 0.3 36.9 ± 7.4 80.7 ± 0.6 85.0 ± 2.2 28.4 ± 1.2
hazelnut 85.4 ± 7.5 96.3 ± 0.3 97.4 ± 0.1 93.9 ± 0.2 96.9 ± 0.2 95.8 ± 0.4 97.3 ± 0.1 91.9 ± 0.1 62.6 ± 4.1 86.9 ± 2.1 89.1 ± 3.5 33.7 ± 0.5
leather 92.2 ± 1.3 96.6 ± 0.7 98.9 ± 0.4 96.4 ± 0.0 99.2 ± 0.1 97.8 ± 0.0 98.9 ± 0.0 95.3 ± 0.0 71.1 ± 9.2 95.9 ± 1.8 98.1 ± 0.3 71.1 ± 0.4
metal nut 55.8 ± 14.4 90.1 ± 4.0 96.0 ± 1.3 86.4 ± 0.2 90.9 ± 0.1 92.3 ± 0.7 96.6 ± 0.8 85.4 ± 0.1 68.5 ± 16.2 88.6 ± 2.5 91.5± 0.4 35.2 ± 0.9
pill 95.1 ± 1.1 88.4 ± 3.4 86.0 ± 7.9 85.4 ± 0.2 90.4 ± 0.2 86.2 ± 2.6 79.2 ± 10.3 78.1 ± 0.0 74.9 ± 15.2 83.5 ± 3.7 72.5 ± 11.1 32.7 ± 0.4
screw 59.2 ± 26.2 82.7 ± 2.6 82.1 ± 11.9 72.0 ± 1.0 81.0 ± 1.0 73.5 ± 1.8 76.5 ± 2.1 62.9 ± 0.5 0.2 ± 0.2 73.0 ± 11.2 54.8 ± 18.5 28.5 ± 1.1
tile 87.5 ± 3.1 84.4 ± 1.5 97.6 ± 0.0 88.6 ± 0.0 83.4 ± 2.2 88.3 ± 4.3 84.0 ± 0.2 85.1 ± 0.0 20.1 ± 5.6 81.4 ± 3.8 88.3 ± 4.6 55.1 ± 1.0
toothbrush 94.0 ± 1.0 83.6 ± 1.4 89.7 ± 1.8 85.7 ± 0.1 91.7 ± 0.3 86.2 ± 1.2 67.3 ± 2.7 81.7 ± 0.3 45.7 ± 8.4 69.9 ± 0.8 68.5 ± 8.8 45.7 ± 1.3
transistor 58.3 ± 19.0 95.8 ± 0.2 86.1 ± 3.4 80.9 ± 0.2 79.7 ± 7.3 96.9 ± 0.2 88.6 ± 3.9 86.9 ± 0.2 43.8 ± 8.7 93.3 ± 0.5 93.7 ± 0.1 35.7 ± 0.7
wood 93.0 ± 0.7 91.0 ± 1.4 95.8 ± 0.3 88.3 ± 0.0 94.3 ± 0.2 88.8 ± 0.3 89.4 ± 0.0 80.6 ± 0.0 35.9 ± 16.4 82.8 ± 1.7 68.5 ± 13.3 53.1 ± 1.3
zipper 89.7 ± 2.2 94.8 ± 0.6 96.7 ± 0.5 90.5 ± 0.0 93.4 ± 0.5 95.6 ± 0.4 96.4 ± 0.5 88.5 ± 0.1 45.3 ± 9.1 88.7 ± 0.8 95.0 ± 0.3 40.4 ± 0.7
mean 82.4 ± 11.2 90.4 ± 2.7 93.6 ± 3.9 86.7 ± 0.3 90.5 ± 3.5 90.8 ± 1.7 89.5 ± 3.5 83.5 ± 0.2 51.0 ± 12.0 85.0 ± 3.5 83.1 ± 7.4 42.3 ± 0.9
Figure 5: AD performance on the real test set over rela-
tive receptive field size of all layers of Wide ResNet-50 and
DenseNet-201 when using the corresponding features for
PatchCore. The mean values over all 15 MVTec AD ob-
jects are reported.
thetic validation set D
V,syn
in terms of the harmonic
mean P
h
of AU-ROC
1.00
and AU-PRO
0.30
. In Ta-
ble 1 we report this metric of the chosen layer on the
real test set P
h
{M
L
∗
(D
test
)}. We run PatchCore three
times in each case. SimpleNet is run three times for
Wide ResNet-50 but only once for DenseNet-201 due
to the large number of layers and thus long training
time. The results for SimpleNet with DenseNet-201
can be found in the appendix. The repeated experi-
ments each have a different dataset split D
T
and D
V
and different generated synthetic anomalies in D
V,bad
.
The reported values are the means of the three runs
and the resulting standard deviations. Table 1 also
contains a column baseline. We compute the baseline
value P
b
as average performance over all available
layers P
b
=
1
n
∑
n
l=1
P
h
{M
l
(D
test
)} since this would be
the expected value of P
h
when choosing a random
layer of the feature extractor.
In all experiments our feature selection method
outperforms the baseline when using CutPaste or NSA
defects. Even the very basic defect type Simple leads
to a layer choice that benefits final performance on the
real test set for many objects. As expected, the more
realistic the defect types appear, the better performs
the feature selection algorithm. For PatchCore the
layer selection based on NSA outperforms the base-
line by approximately 7 percentage points on average
both for Wide ResNet-50 and DenseNet-201. The av-
erage performance of Simple defects is on par with
those from CutPaste and NSA for DenseNet-201. It is
significantly worse for Wide ResNet-50.
This could be due to the significantly larger stan-
dard deviations between different runs, compared to
Table 2: Performance (P
h
) on the real test set of MVTec AD
of the layer L
∗
obtained by feature selection (FS) using NSA
synthetic defects compared to using features concatenated
from multiple layers (ML), both averaged over three runs.
PatchCore SimpleNet
WideResnet50 DenseNet201 WideResnet50
object FS ML FS ML FS ML
bottle 98.0 ± 0.2 97.8 ± 0.0 97.4 ± 0.3 97.9 ± 0.1 93.8 ± 0.7 71.4 ± 13.8
cable 93.9 ± 1.1 94.5 ± 0.1 94.7 ± 0.3 95.3 ± 0.2 87.9 ± 0.7 73.8 ± 8.4
capsule 97.5 ± 0.5 97.4 ± 0.2 92.6 ± 2.7 96.5 ± 0.5 77.8 ± 6.9 87.0 ± 5.1
carpet 90.2 ± 1.5 96.4 ± 0.1 85.7 ± 6.7 95.8 ± 0.3 81.3 ± 4.8 69.6 ± 23.8
grid 97.8 ± 0.8 96.0 ± 0.5 97.4 ± 0.8 95.7 ± 0.7 85.0 ± 2.2 34.7 ± 13.9
hazelnut 97.4 ± 0.1 98.0 ± 0.2 97.3 ± 0.1 97.3 ± 0.3 89.1 ± 3.5 35.5 ± 39.1
leather 98.9 ± 0.4 99.0 ± 0.0 98.9 ± 0.0 99.0 ± 0.0 98.1 ± 0.3 94.5 ± 2.9
metal nut 96.0 ± 1.3 97.3 ± 0.1 96.6 ± 0.8 97.2 ± 0.1 91.5 ± 0.4 67.7 ± 33.5
pill 86.0 ± 7.9 96.2 ± 0.2 79.2 ± 10.3 96.2 ± 0.2 72.5 ± 11.1 88.2 ± 1.0
screw 82.1 ± 11.9 94.4 ± 0.7 76.5 ± 2.1 90.8 ± 1.5 54.8 ± 18.5 14.1 ± 10.8
tile 97.6 ± 0.0 94.6 ± 0.2 84.0 ± 0.2 94.7 ± 0.1 88.3 ± 4.6 41.0 ± 20.5
toothbrush 89.7 ± 1.8 90.8 ± 0.0 67.3 ± 2.7 91.8 ± 0.6 68.5 ± 8.8 63.6 ± 4.0
transistor 86.1 ± 3.4 89.5 ± 0.7 88.6 ± 3.9 89.5 ± 0.2 93.7 ± 0.1 84.4 ± 4.3
wood 95.8 ± 0.3 95.0 ± 0.1 89.4 ± 0.0 94.9 ± 0.2 68.5 ± 13.3 65.2 ± 4.3
zipper 96.7 ± 0.5 97.6 ± 0.1 96.4 ± 0.5 97.7 ± 0.2 95.0 ± 0.3 46.8 ± 16.5
mean 93.6 ± 3.9 95.6 ± 0.3 89.5 ± 3.5 95.4 ± 0.5 83.1 ± 7.4 62.5 ± 17.5
VISAPP 2024 - 19th International Conference on Computer Vision Theory and Applications
160

those of CutPaste and NSA. The defect type Sim-
ple may give a good result with our feature selection
method, but is clearly more unstable. The reason for
this variability could be the large difference between
the Simple defects, which are only black rectangles,
and the real defects.
Looking at SimpleNet, there is a huge gap be-
tween the baseline performance and the performance
of the feature selection based on CutPaste or NSA.
Our proposed method outperforms the baseline by
more than 40 percentage points, i.e. doubling the per-
formance. Defect type Simple falls behind this perfor-
mance, but is still 9 percentage points better than the
baseline.
4.3 Comparison to Multi-Layer
Features
Table 2 compares the performance of PatchCore and
SimpleNet using multi-layer features as suggested in
the original work (Roth et al., 2022; Liu et al., 2023b)
to the results obtained by our feature selection using
NSA defects. For both feature extractors the default
multi-layer features are obtained by concatenating the
feature maps of the last layers of block 2 and 3, re-
spectively. On average, the selection of a single layer
by our method provides slightly worse features for
PatchCore than the default multi-layer setting. How-
ever, for most object categories feature selection leads
to comparable results (e.g. Wide ResNet-50: ob-
jects cable, leather, toothbrush) or even outperforms
the multi-layer baseline (e.g. Wide ResNet-50: ob-
jects bottle, capsule, tile). Likewise, for SimpleNet
feature selection leads to significantly better results
than the multi-layer setting for nearly all object cat-
egories. Compared to the original publication (Liu
et al., 2023b) the multi-layer results for SimpleNet
are significantly worse. This might be due to several
reasons: We disable checkpoint selection based on
the test set metrics, use a smaller number of training
images and often the poor localization performance
heavily affects the reported P
h
. In total, Table 2 not
only verifies the feasibility of application-specific fea-
ture selection but also confirms its potential benefits
over state-of-the-art default feature layers.
4.4 Ablation Studies
Choice of Selection Criterion. In Sec. 4.2 we se-
lect the layer L
∗
based on the best value of the
harmonic mean P
h
of AU-ROC
1.00
and AU-PRO
0.30
achieved on the synthetic validation set D
V,syn
. We
want to investigate the impact of this selection crite-
rion on the final performance on the real test set D
test
.
Thus, we additionally perform feature layer selection
based on anomaly classification performance P
cls
=
AU-ROC
1.00
and report all metrics in Table 3. The
average performance over the three distinct dataset
splits with synthetic defects of type NSA, exemplar-
ily for PatchCore and DenseNet-201, is reported. We
see that the layer selection outperforms the baseline
for both selection criteria, and for all three evaluation
metrics. As expected, the evaluation metric P
h
on the
real test data is higher when selecting the layer based
on this metric (first column), than when selecting it
based on P
cls
(second column). Interestingly, even
P
cls
is higher in the former case. This means, that
for the transfer from synthetic to real defective data it
is important to select features that are distinctive for
both anomaly classification and anomaly localization.
This is in line with our motivation to also locate de-
fects precisely in real-world applications.
Table 3: Comparison of average performances P
h
, P
cls
and
P
loc
on the real test set of MVTec AD for feature layer se-
lection by harmonic mean P
h
and P
cls
with the baseline.
This table shows results of PatchCore on DenseNet-201
with feature selection based on defect type NSA.
selection crit. Harmonic mean AU-ROC
1.00
baseline
object P
h
P
cls
P
loc
P
h
P
cls
P
loc
P
h
P
cls
P
loc
bottle 97.4 99.9 95.0 83.7 98.9 72.6 90.9 99.6 84.0
cable 94.7 99.0 90.9 86.3 95.4 78.8 83.4 92.0 76.9
capsule 92.6 95.7 89.8 82.5 89.7 76.5 81.2 89.5 75.0
carpet 85.7 85.4 85.9 93.6 97.3 90.2 89.6 95.0 85.1
grid 97.4 99.4 95.5 84.1 91.0 78.1 71.1 79.9 64.6
hazelnut 97.3 100.0 94.8 96.5 99.9 93.3 91.9 96.5 87.9
leather 98.9 100.0 97.8 97.0 100.0 94.2 95.3 99.0 92.1
metal nut 96.6 99.5 93.9 82.3 93.4 73.7 85.4 93.8 78.9
pill 79.2 87.6 73.5 75.6 81.3 70.8 78.1 83.5 74.0
screw 76.5 85.0 69.8 84.2 88.3 81.0 62.9 76.7 55.0
tile 84.0 95.6 74.9 91.9 99.4 85.5 85.1 98.0 75.5
toothbrush
67.3 84.8 55.9 73.4 93.3 60.5 81.7 93.2 73.5
transistor 88.6 99.2 80.2 95.2 99.0 91.7 86.9 94.9 80.7
wood 89.4 97.0 82.8 89.4 97.0 82.8 80.6 96.9 70.1
zipper 96.4 97.7 95.2 83.8 94.7 75.7 88.5 96.0 82.6
mean 89.5 95.1 85.1 86.6 94.6 80.4 83.5 92.3 77.1
Generalization from Synthetic to Real Data. To
verify the generalization of feature selection using
synthetic defects on real test data, Table 4 reports
not only the performance on the real test set of
the model using the features of the selected layer
M
L
∗
(k = 1) but also the averaged performance
P
k
=
1
k
∑
k
l=1
P {M
l
(D
test
)} over the top k layers with
best performance on the synthetic validation set
D
V,syn
. Especially for NSA synthetic defects the pro-
posed selection strategy always outperforms the base-
line of randomly choosing a single layer for Metal Nut
and Leather. This indicates that the best features se-
lected by our strategy using this kind of synthetic de-
Feature Selection for Unsupervised Anomaly Detection and Localization Using Synthetic Defects
161

Table 4: Average performance (P
h
) on the real test set of
MVTec AD of the k best layers on the synthetic validation
set for PatchCore with a Wide ResNet-50 feature extractor
using different synthetic defects. Results are averaged over
three distinct initial dataset splits D
T
and D
V
and compared
to the average performance over all layers.
object Metal Nut Leather
k Simple CutPaste NSA Simple CutPaste NSA
1 55.8 ± 0.0 90.1 ± 0.0 96.0 ± 0.0 92.2 ± 0.0 96.6 ± 0.0 98.9 ± 0.0
2 51.4 ± 16.4 91.4 ± 1.9 96.1 ± 0.9 92.9 ± 0.8 96.7 ± 1.0 98.9 ± 0.0
3 50.8 ± 14.2 91.4 ± 1.9 96.2 ± 0.8 93.9 ± 1.6 96.4 ± 1.0 99.0 ± 0.2
4 61.6 ± 22.6 90.5 ± 2.8 96.4 ± 0.8 94.0 ± 1.4 96.8 ± 1.1 98.8 ± 0.4
all 86.4 ± 12.8 96.4 ± 3.0
fect consistently generalize well to the defects occur-
ring in the real test set. This also applies to utilizing
CutPaste defects, whereas Simple defects are both in-
sufficient and less stable. The complete ablation is
provided in the appendix.
5 CONCLUSION
Using features from a pretrained feature extractor has
become a popular paradigm in developing methods
for the task of unsupervised Anomaly Detection and
Localization. Commonly, for different application
scenarios features from the same layers are utilized.
Moreover, oftentimes multiple feature maps are com-
bined to obtain expressive features. However, recent
work found that an optimal, application-specific se-
lection of a single feature layer is sufficient to reach
state-of-the-art performance or even outperforms the
default multi-layer setting (Heckler et al., 2023).
In this paper, we followed this line of work and
proposed the first feature selection strategy for AD.
First, we demonstrated the necessity of consider-
ing all layers of a pretrained feature extractor in
application-specific feature selection. Thereupon, we
presented a selection strategy based on synthetic de-
fects that chooses from this overall set of layers and
does not require any real anomalous samples. Our
proposed strategy was evaluated for two state-of-the-
art AD methods, PatchCore (Roth et al., 2022) and
SimpleNet (Liu et al., 2023b), as well as two fea-
ture extractors, Wide ResNet-50 (Zagoruyko and Ko-
modakis, 2016) and DenseNet-201 (Huang et al.,
2017), both pretrained on ImageNet (Krizhevsky
et al., 2012). Especially using CutPaste or NSA syn-
thetic defects for our selection strategy consistently
led to improvements over the expected value of a ran-
domly chosen layer. Moreover, for certain object cat-
egories of the MVTec AD dataset application-specific
feature selection outperformed the default multi-layer
features as well.
Overall, our method may serve as a competitive
baseline for further research in this field. However,
future work may reduce the computational cost of
estimating the suitability of a layer for generating
application-specific features. Other synthetic defect
types may also be considered in combination with our
strategy, potentially leading to an even more consis-
tent improvement over ensembled features from mul-
tiple layers.
REFERENCES
Akc¸ay, S., Atapour-Abarghouei, A., and Breckon, T. P.
(2019). Skip-ganomaly: Skip connected and adversar-
ially trained encoder-decoder anomaly detection. In
2019 International Joint Conference on Neural Net-
works (IJCNN), pages 1–8.
Ba, J. and Caruana, R. (2014). Do deep nets really need
to be deep? In Ghahramani, Z., Welling, M., Cortes,
C., Lawrence, N., and Weinberger, K., editors, Ad-
vances in Neural Information Processing Systems,
volume 27. Curran Associates, Inc.
Bergmann, P., Batzner, K., Fauser, M., Sattlegger, D., and
Steger, C. (2022). Beyond Dents and Scratches: Log-
ical Constraints in Unsupervised Anomaly Detection
and Localization. International Journal of Computer
Vision, 130(4):947–969.
Bergmann, P., Fauser, M., Sattlegger, D., and Steger, C.
(2019a). MVTec AD — A Comprehensive Real-
World Dataset for Unsupervised Anomaly Detection.
In IEEE Conference on Computer Vision and Pattern
Recognition (CVPR), pages 9584–9592.
Bergmann, P., Fauser, M., Sattlegger, D., and Steger,
C. (2020). Uninformed Students: Student-Teacher
Anomaly Detection With Discriminative Latent Em-
beddings. In IEEE Conference on Computer Vision
and Pattern Recognition (CVPR), pages 4182–4191.
Bergmann, P., L
¨
owe, S., Fauser, M., Sattlegger, D., and
Steger, C. (2019b). Improving Unsupervised De-
fect Segmentation by Applying Structural Similarity
to Autoencoders. In Proceedings of the 14th Inter-
national Joint Conference on Computer Vision, Imag-
ing and Computer Graphics Theory and Applica-
tions - Volume 5: VISAPP, pages 372–380. INSTICC,
SciTePress.
Blum, H., Sarlin, P.-E., Nieto, J., Siegwart, R., and Ca-
dena, C. (2019). Fishyscapes: A Benchmark for Safe
Semantic Segmentation in Autonomous Driving. In
IEEE International Conference on Computer Vision
Workshops (ICCVW), pages 2403–2412.
Cao, Y., Xu, X., Liu, Z., and Shen, W. (2023). Collaborative
discrepancy optimization for reliable image anomaly
localization. IEEE Transactions on Industrial Infor-
matics, pages 1–10.
Cohen, N. and Hoshen, Y. (2020). Sub-image anomaly
detection with deep pyramid correspondences. arXiv
preprint arXiv:2005.02357v1.
Cui, Y., Liu, Z., and Lian, S. (2023). A survey on unsu-
pervised anomaly detection algorithms for industrial
images. IEEE Access, 11:55297–55315.
Defard, T., Setkov, A., Loesch, A., and Audigier, R. (2020).
Padim: A patch distribution modeling framework for
VISAPP 2024 - 19th International Conference on Computer Vision Theory and Applications
162

anomaly detection and localization. In Pattern Recog-
nition. ICPR International Workshops and Challenges
2021, Proceedings, Part IV, volume 12664 of Lecture
Notes in Computer Science, pages 475–489. Springer.
Goodfellow, I., Pouget-Abadie, J., Mirza, M., Xu, B.,
Warde-Farley, D., Ozair, S., Courville, A., and Ben-
gio, Y. (2014). Generative adversarial nets. In Ghahra-
mani, Z., Welling, M., Cortes, C., Lawrence, N., and
Weinberger, K., editors, Advances in Neural Infor-
mation Processing Systems, volume 27. Curran Asso-
ciates, Inc.
Guo, Y., Jiang, M., Huang, Q., Cheng, Y., and Gong,
J. (2023). Mldfr: A multilevel features restoration
method based on damaged images for anomaly detec-
tion and localization. IEEE Transactions on Industrial
Informatics, pages 1–10.
He, K., Zhang, X., Ren, S., and Sun, J. (2016). Deep Resid-
ual Learning for Image Recognition. In IEEE Con-
ference on Computer Vision and Pattern Recognition
(CVPR), pages 770–778.
Heckler, L., K
¨
onig, R., and Bergmann, P. (2023). Explor-
ing the importance of pretrained feature extractors for
unsupervised anomaly detection and localization. In
Proceedings of the IEEE/CVF Conference on Com-
puter Vision and Pattern Recognition (CVPR) Work-
shops, pages 2916–2925.
Hendrycks, D., Basart, S., Mazeika, M., Mostajabi, M.,
Steinhardt, J., and Song, D. (2019). A Bench-
mark for Anomaly Segmentation. arXiv preprint
arXiv:1911.11132v1.
Hinton, G., Vinyals, O., and Dean, J. (2015). Distilling the
knowledge in a neural network.
Huang, G., Liu, Z., van der Maaten, L., and Weinberger,
K. Q. (2017). Densely connected convolutional net-
works. In Proceedings of the IEEE Conference on
Computer Vision and Pattern Recognition (CVPR).
Komi
´
c, J. (2011). Harmonic mean. In International Ency-
clopedia of Statistical Science, pages 622–624, Berlin,
Heidelberg. Springer Berlin Heidelberg.
Krizhevsky, A., Sutskever, I., and Hinton, G. E. (2012). Im-
ageNet Classification With Deep Convolutional Neu-
ral Networks. In Advances in Neural Information Pro-
cessing Systems, pages 1097–1105.
Li, C.-L., Sohn, K., Yoon, J., and Pfister, T. (2021). Cut-
paste: Self-supervised learning for anomaly detection
and localization. In 2021 IEEE/CVF Conference on
Computer Vision and Pattern Recognition (CVPR),
pages 9659–9669.
Li, W.-X., Mahadevan, V., and Vasconcelos, N. (2013).
Anomaly Detection and Localization in Crowded
Scenes. IEEE Transactions on Pattern Analysis and
Machine Intelligence (TPAMI), 36(1):18–32.
Liu, J., Xie, G., Wang, J., Li, S., Wang, C., Zheng, F., and
Jin, Y. (2023a). Deep industrial image anomaly detec-
tion: A survey. arXiv preprint arXiv:2301.11514.
Liu, Z., Zhou, Y., Xu, Y., and Wang, Z. (2023b). Simplenet:
A simple network for image anomaly detection and
localization. In Proceedings of the IEEE/CVF Con-
ference on Computer Vision and Pattern Recognition
(CVPR), pages 20402–20411.
Luo, W., Li, Y., Urtasun, R., and Zemel, R. (2016). Un-
derstanding the effective receptive field in deep con-
volutional neural networks. In Advances in Neural
Information Processing Systems, volume 29. Curran
Associates, Inc.
Luo, W., Yao, H., and Yu, W. (2023). Normal reference
attention and defective feature perception network for
surface defect detection. IEEE Transactions on Instru-
mentation and Measurement, 72:1–14.
Masci, J., Meier, U., Cires¸an, D., and Schmidhuber, J.
(2011). Stacked Convolutional Auto-Encoders for Hi-
erarchical Feature Extraction. In Artificial Neural Net-
works and Machine Learning – ICANN 2011, pages
52–59. Springer.
Menze, B. H., Jakab, A., Bauer, S., Kalpathy-Cramer, J.,
Farahani, K., Kirby, J., et al. (2015). The Multi-
modal Brain Tumor Image Segmentation Benchmark
(BRATS). IEEE Transactions on Medical Imaging,
34(10):1993–2024.
Nazare, T. S., de Mello, R. F., and Ponti, M. A. (2018). Are
pre-trained cnns good feature extractors for anomaly
detection in surveillance videos? arXiv preprint
arXiv:1811.08495.
Paszke, A., Gross, S., Massa, F., Lerer, A., Bradbury, J.,
Chanan, G., Killeen, T., Lin, Z., Gimelshein, N.,
Antiga, L., Desmaison, A., Kopf, A., Yang, E., De-
Vito, Z., Raison, M., Tejani, A., Chilamkurthy, S.,
Steiner, B., Fang, L., Bai, J., and Chintala, S. (2019).
PyTorch: An Imperative Style, High-Performance
Deep Learning Library. In Advances in Neural Infor-
mation Processing Systems, volume 32.
P
´
erez, P., Gangnet, M., and Blake, A. (2003). Poisson im-
age editing. ACM Trans. Graph., 22(3):313–318.
Prunella, M., Scardigno, R. M., Buongiorno, D., Brunetti,
A., Longo, N., Carli, R., Dotoli, M., and Bevilacqua,
V. (2023). Deep learning for automatic vision-based
recognition of industrial surface defects: A survey.
IEEE Access, 11:43370–43423.
Reiss, T., Cohen, N., Bergman, L., and Hoshen, Y. (2021).
Panda: Adapting pretrained features for anomaly de-
tection and segmentation. In Proceedings of the
IEEE/CVF Conference on Computer Vision and Pat-
tern Recognition, pages 2806–2814.
Rippel, O., Mertens, P., and Merhof, D. (2021). Model-
ing the distribution of normal data in pre-trained deep
features for anomaly detection. In 2020 25th Inter-
national Conference on Pattern Recognition (ICPR).
IEEE.
Roth, K., Pemula, L., Zepeda, J., Sch
¨
olkopf, B., Brox, T.,
and Gehler, P. V. (2022). Towards total recall in in-
dustrial anomaly detection. In IEEE/CVF Conference
on Computer Vision and Pattern Recognition, CVPR
2022, pages 14298–14308. IEEE.
Rudolph, M., Wehrbein, T., Rosenhahn, B., and Wandt, B.
(2023). Asymmetric student-teacher networks for in-
dustrial anomaly detection. In IEEE/CVF Winter Con-
ference on Applications of Computer Vision, WACV
2023, pages 2591–2601. IEEE.
Schl
¨
uter, H. M., Tan, J., Hou, B., and Kainz, B. (2022). Nat-
ural synthetic anomalies for self-supervised anomaly
detection and localization. In Avidan, S., Brostow,
G., Ciss
´
e, M., Farinella, G. M., and Hassner, T., edi-
tors, Computer Vision – ECCV 2022, pages 474–489,
Cham. Springer Nature Switzerland.
Feature Selection for Unsupervised Anomaly Detection and Localization Using Synthetic Defects
163

Seeb
¨
ock, P., Orlando, J. I., Schlegl, T., Waldstein, S. M.,
Bogunovi
´
c, H., Klimscha, S., Langs, G., and Schmidt-
Erfurth, U. (2020). Exploiting epistemic uncertainty
of anatomy segmentation for anomaly detection in
retinal oct. IEEE Transactions on Medical Imaging,
39(1):87–98.
Sener, O. and Savarese, S. (2018). Active learning for con-
volutional neural networks: A core-set approach. In
6th International Conference on Learning Represen-
tations, ICLR 2018.
Tan, M. and Le, Q. (2019). Efficientnet: Rethinking model
scaling for convolutional neural networks. In Interna-
tional conference on machine learning, pages 6105–
6114. PMLR.
Yu, J., Zheng, Y., Wang, X., Li, W., Wu, Y., Zhao, R.,
and Wu, L. (2021). Fastflow: Unsupervised anomaly
detection and localization via 2d normalizing flows.
arXiv preprint arXiv:2111.07677v2.
Zagoruyko, S. and Komodakis, N. (2016). Wide residual
networks. In British Machine Vision Conference 2016.
British Machine Vision Association.
Zavrtanik, V., Kristan, M., and Sko
ˇ
caj, D. (2022). Dsr
– a dual subspace re-projection network for surface
anomaly detection. In Avidan, S., Brostow, G., Ciss
´
e,
M., Farinella, G. M., and Hassner, T., editors, Com-
puter Vision – ECCV 2022, pages 539–554, Cham.
Springer Nature Switzerland.
Zavrtanik, V., Kristan, M., and Sko
ˇ
caj, D. (2021). Draem
- a discriminatively trained reconstruction embedding
for surface anomaly detection. In Proceedings of the
IEEE/CVF International Conference on Computer Vi-
sion (ICCV), pages 8330–8339.
Zhang, X., Li, S., Li, X., Huang, P., Shan, J., and Chen,
T. (2023). Destseg: Segmentation guided denoising
student-teacher for anomaly detection. In Proceedings
of the IEEE/CVF Conference on Computer Vision and
Pattern Recognition (CVPR), pages 3914–3923.
Zou, Y., Jeong, J., Pemula, L., Zhang, D., and Dabeer,
O. (2022). Spot-the-difference self-supervised pre-
training for anomaly detection and segmentation. In
Computer Vision – ECCV 2022, pages 392–408,
Cham. Springer Nature Switzerland.
APPENDIX
Implementation Details of Synthetic
Defects
For all three defect types D
V,bad
consists of the same
original images, only the synthetic defect type differs.
We do not put any prior knowledge on the real defects
into defect generation.
Simple and CutPaste. We parameterize the rectan-
gles such that they have a minimum distance to the
image borders of 20 pixels. Width and height are
randomly sampled and cover between ten and fifty
percent of the image width and height, respectively.
Thus, it is not guaranteed that the defect appears on
the actual object in the image.
Natural Synthetic Anomalies (NSA). We make
use of the official implementation at https://github.
com/hmsch/natural-synthetic-anomalies with commit
id 9195916 and use all of the proposed parameters.
In particular, we distinguish between objects and tex-
tures for the Poisson blending. NSA (Schl
¨
uter et al.,
2022) also estimates the background to ensure that de-
fects are generated on the objects. However, this pro-
cedure sometimes fails and defects can also occur in
the background. In each image, the number of gener-
ated defects is randomly sampled between 1 and 4 for
textures and objects screw and zipper and between 1
and 3 for the remaining objects.
Can We Reduce the Initial Set of Layers?
For the following experiments we trained on a re-
duced training set D
T
of the original training set
S
AD,train
and evaluate the performance on the original
test set S
AD,test
for each MVTec AD object category,
respectively. For comparability to our main experi-
ments, D
T
contains 70% of the original anomaly-free
training images.
Performance by Block and Layer Type. The per-
formance when exclusively using a single layer L for
feature extraction grouped by block for MVTec AD
object cable is provided in Figure A.1 for PatchCore.
In contrast to object grid (Figure 4a), features from
later layers are more suitable.
Figure A.1: AD metrics on real test set of MVTec AD ob-
ject cable. Shown is for each metric the mean with stan-
dard deviation over all layers belonging to same block in
Wide ResNet-50, trained with PatchCore.
Performance over Relative Receptive Field. The
performance averaged over all MVTec AD objects for
SimpleNet is shown in Figure A.2.
VISAPP 2024 - 19th International Conference on Computer Vision Theory and Applications
164
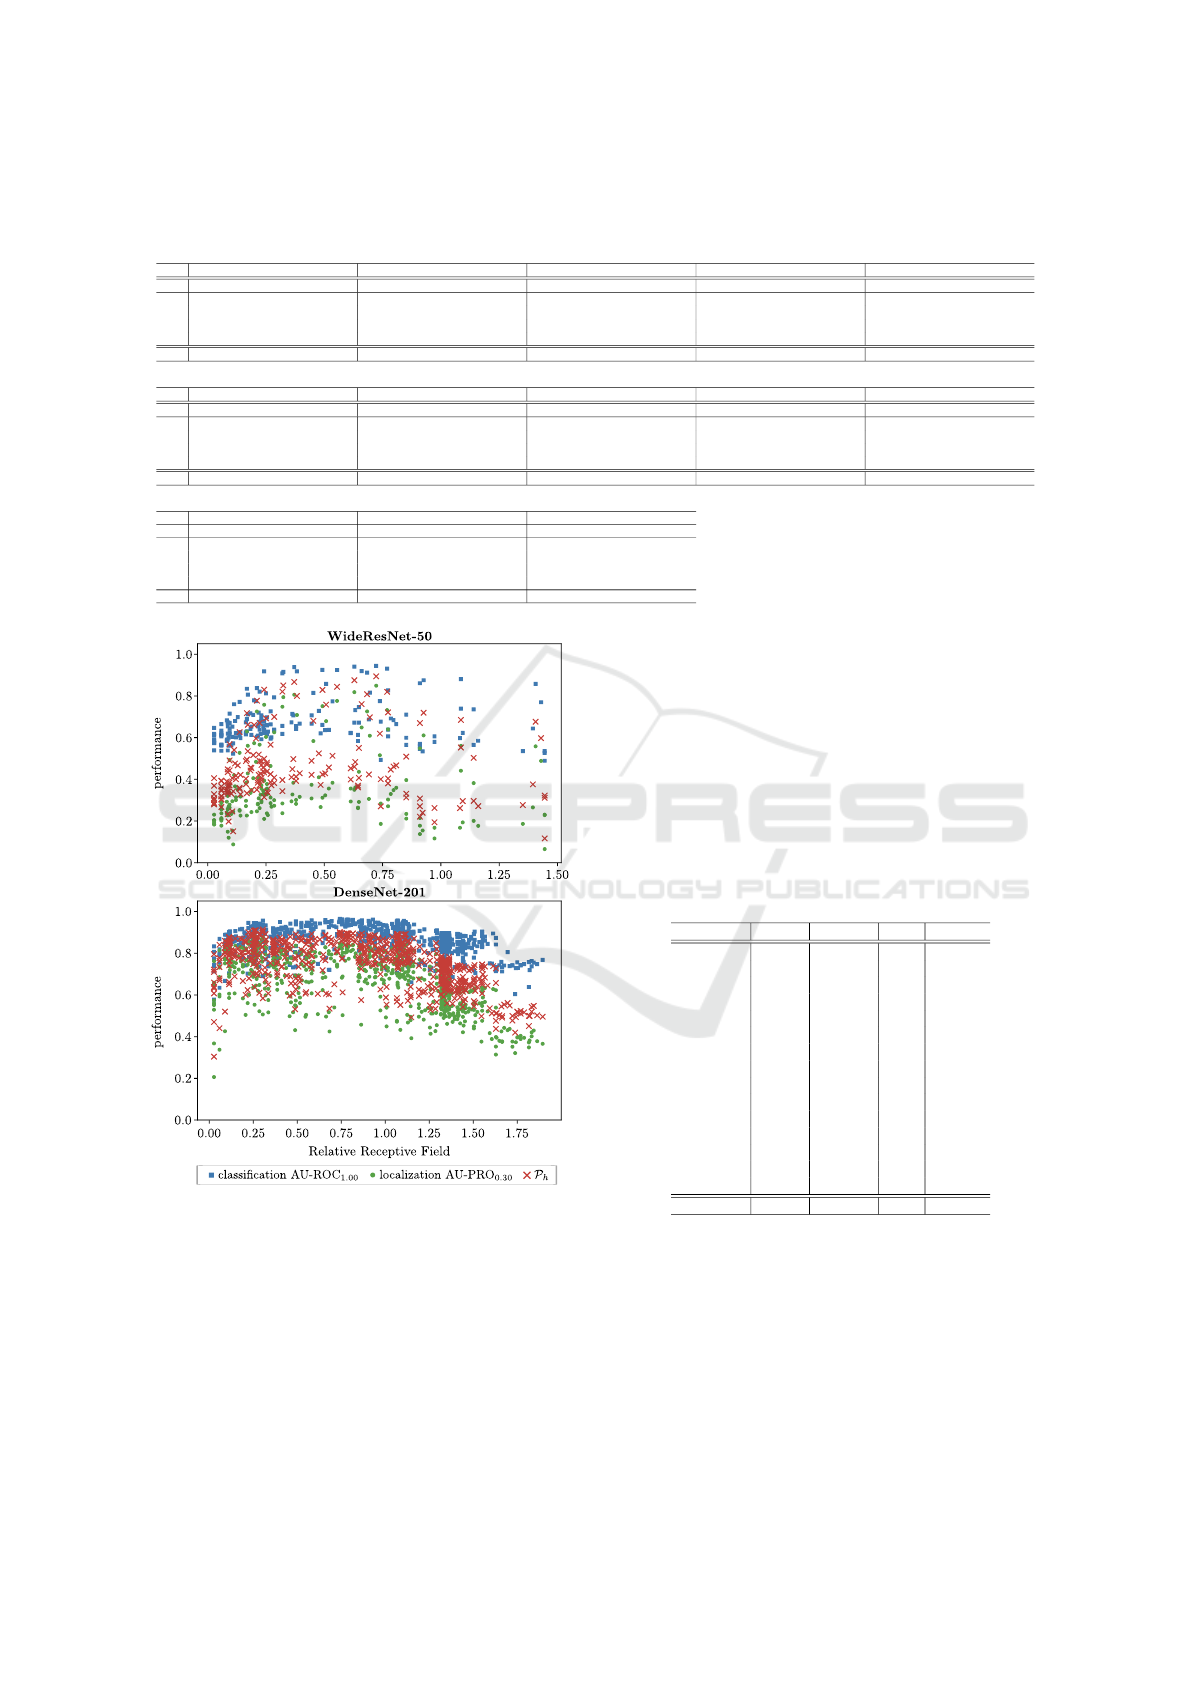
Table A.1: Average performance (P
h
) on the real test set of MVTec AD of the k best layers on the synthetic validation set for
PatchCore with a Wide ResNet-50 feature extractor using different synthetic defects. Results are averaged over three distinct
initial dataset splits D
T
and D
V
and compared to the average performance over all layers.
object Bottle Cable Capsule Hazelnut Carpet
k Simple CutPaste NSA Simple CutPaste NSA Simple CutPaste NSA Simple CutPaste NSA Simple CutPaste NSA
1 88.4 ± 0.0 94.1 ± 0.0 98.0 ± 0.0 77.1 ± 0.0 93.2 ± 0.0 93.9 ± 0.0 97.4 ± 0.0 91.7 ± 0.0 97.5 ± 0.0 85.4 ± 0.0 96.3 ± 0.0 97.4 ± 0.0 73.1 ± 0.0 89.2 ± 0.0 90.2 ± 0.0
2 72.8 ± 17.3 93.9 ± 0.4 98.1 ± 0.1 77.5 ± 19.1 92.9 ± 1.1 93.9 ± 0.7 97.2 ± 0.2 91.8 ± 0.4 97.3 ± 0.2 88.7 ± 5.1 96.4 ± 0.1 97.2 ± 0.2 71.5 ± 2.6 84.2 ± 6.2 90.9 ± 1.0
3 77.3 ± 15.9 93.9 ± 0.7 98.1 ± 0.2 82.8 ± 17.9 92.9 ± 1.0 93.5 ± 1.0 91.1 ± 10.5 91.6 ± 0.5 97.4 ± 0.3 89.3 ± 4.7 96.3 ± 0.3 97.3 ± 0.3 69.0 ± 4.3 84.9 ± 5.6 91.2 ± 1.3
4 77.5 ± 14.0 93.8 ± 0.8 98.0 ± 0.2 85.1 ± 16.3 93.2 ± 1.0 93.7 ± 0.9 92.7 ± 9.7 91.2 ± 1.4 97.5 ± 0.3 90.9 ± 5.2 96.3 ± 0.6 97.4 ± 0.3 74.3 ± 10.0 85.0 ± 10.3 91.2 ± 1.3
all 91.0 ± 8.0 81.3 ± 16.9 87.3 ± 10.7 93.9 ± 5.4 89.8 ± 6.6
object Pill Screw Toothbrush Transistor Zipper
k Simple CutPaste NSA Simple CutPaste NSA Simple CutPaste NSA Simple CutPaste NSA Simple CutPaste NSA
1 95.1 ± 0.0 88.4 ± 0.0 86.0 ± 0.0 59.2 ± 0.0 82.7 ± 0.0 82.1 ± 0.0 94.0 ± 0.0 83.6 ± 0.0 89.7 ± 0.0 58.3 ± 0.0 95.8 ± 0.0 86.1 ± 0.0 89.7 ± 0.0 94.8 ± 0.0 96.7 ± 0.0
2 95.5 ± 0.9 89.8 ± 2.1 87.9 ± 2.4 59.2 ± 13.0 82.4 ± 1.8 78.9 ± 7.8 93.5 ± 1.0 85.0 ± 1.5 88.6 ± 1.5 66.9 ± 11.7 95.8 ± 0.2 87.2 ± 3.1 88.4 ± 3.1 94.2 ± 0.6 96.6 ± 0.4
3 95.3 ± 0.8 90.4 ± 2.2 90.3 ± 5.3 64.6 ± 14.1 82.9 ± 2.4 78.8 ± 7.3 90.7 ± 5.2 85.4 ± 1.4 88.6 ± 1.5 65.9 ± 12.9 95.9 ± 0.2 86.7 ± 2.7 86.4 ± 4.5 93.9 ± 1.0 96.9 ± 0.8
4 94.7 ± 1.7 90.0 ± 2.2 91.0 ± 5.6 65.4 ± 13.6 83.2 ± 2.9 78.4 ± 6.4 91.9 ± 5.1 85.0 ± 1.7 88.2 ± 1.5 67.0 ± 15.9 95.9 ± 0.3 88.2 ± 3.5 85.6 ± 4.3 94.0 ± 0.9 96.8 ± 0.9
all 85.4 ± 10.6 72.0 ± 18.6 85.7 ± 8.4 80.9 ± 15.3 90.5 ± 8.2
object Grid Tile Wood
κ Simple CutPaste NSA Simple CutPaste NSA Simple CutPaste NSA
1 90.1 ± 0.0 84.9 ± 0.0 97.8 ± 0.0 87.5 ± 0.0 84.4 ± 0.0 97.6 ± 0.0 93.0 ± 0.0 91.0 ± 0.0 95.8 ± 0.0
2 90.6 ± 0.7 84.5 ± 0.6 97.4 ± 0.5 86.9 ± 1.8 85.0 ± 2.3 97.7 ± 0.1 92.7 ± 0.8 89.0 ± 2.7 95.7 ± 0.3
3 90.3 ± 0.8 84.4 ± 0.5 97.4 ± 0.5 89.1 ± 3.5 85.5 ± 2.3 97.1 ± 0.9 92.8 ± 0.7 89.9 ± 3.0 95.6 ± 0.3
4 89.4 ± 3.7 83.6 ± 1.6 97.2 ± 0.8 89.7 ± 4.2 85.6 ± 2.2 96.8 ± 1.0 92.7 ± 0.7 89.0 ± 3.0 95.6 ± 0.4
all 83.7 ± 12.4 88.6 ± 6.5 88.3 ± 8.6
Figure A.2: AD performance on the real test set over rela-
tive receptive field size of all layers of Wide ResNet-50 and
DenseNet-201 when using the corresponding features for
SimpleNet. The mean values over all 15 MVTec AD ob-
jects are reported.
- Considering all experiments, the observed pat-
terns vary significantly for different object categories
and methods such that a universal pre-selection of ex-
pressive features by block, layer type or relative re-
ceptive field size is challenging.
Feature Selection Using Synthetic Defects
The results of our main experiment where we ap-
ply our feature selection strategy using different syn-
thetic defects for SimpleNet extracting features with
a single layer of a DenseNet-201 can be found in Ta-
ble A.2.
Table A.2: Harmonic mean P
h
on the real test set of
MVTec AD for the selected layers of each defect type, for
SimpleNet with a DenseNet-201 feature extractor. The last
column baseline is the average performance of all layers.
Only a single run was conducted.
object Simple CutPaste NSA baseline
bottle 94.2 93.0 96.7 87.0
cable 68.5 92.7 90.3 68.8
capsule 93.8 67.2 94.1 71.9
carpet 70.4 91.5 78.2 81.0
grid 97.0 88.3 97.8 67.2
hazelnut 93.7 96.3 96.8 79.1
leather 99.1 97.4 98.9 90.3
metal nut 86.1 92.3 93.9 73.9
pill 89.4 78.8 63.7 65.8
screw 77.4 73.9 60.0 55.4
tile 70.8 86.3 82.2 72.6
toothbrush 84.5 76.3 33.9 73.9
transistor 62.4 95.8 83.9 73.1
wood 84.9 84.4 85.6 70.6
zipper 95.5 95.4 96.9 83.7
mean 84.5 87.3 83.5 74.3
Ablation Studies
Generalization from Synthetic to Real Data. The
results of all MVTec AD objects for our ablation
study that validates the consistent generalization from
synthetic to real defects in our selection strategy, es-
pecially for defect types CutPaste and NSA, can be
found in Table A.1 for PatchCore extracting features
with a single Wide ResNet-50 layer.
Feature Selection for Unsupervised Anomaly Detection and Localization Using Synthetic Defects
165
