
Direct 3D Body Measurement Estimation from Sparse Landmarks
David Bojani
´
c
1 a
, Kristijan Bartol
2 b
, Tomislav Petkovi
´
c
1 c
and Tomislav Pribani
´
c
1 d
1
Faculty of Electrical Engineering and Computing, University of Zagreb, Unska 3, Zagreb, Croatia
2
TU Dresden, 01062 Dresden, Dresden, Germany
Keywords:
Anthropometry, Body Measurements, 3D Landmarks.
Abstract:
The current state-of-the-art 3D anthropometry extraction methods are either template-based or landmark-
based. Template-based methods fit a statistical human body model to a 3D scan and extract complex features
from the template to learn the body measurements. The fitting process is usually an optimization process,
sensitive to its hyperparameters. Landmark-based methods use body proportion heuristics to estimate the
landmark locations on the body in order to derive the measurements. Length measurements are derived as
distances between landmarks, whereas circumference measurements are derived as cross-sections of the body
and a plane defined at the desired landmark location. This makes it very susceptible to noise in the 3D
scan data. To address these issues, we propose a simple learning method that infers the body measurements
directly using the landmarks defined on the body. Our method avoids fitting a body model, extracting com-
plex features, using heuristics, and handling noise in the data. We compare our method on the CAESAR
dataset and show that using a simple method coupled with sparse landmark data can compete with state-
of-the-art methods. To take a step towards open-source 3D anthropometry, we make our code available at
https:/github.com/DavidBoja/Landmarks2Anthropometry.
1 INTRODUCTION
Anthropometry is the scientific study of the measure-
ments and proportions of the human body (Bartol
et al., 2021). With the most recent development of 3D
scanners, now available even in mobile devices (Zhao
et al., 2023), the need for body measurement methods
from 3D data is increasing. Automatic extraction of
body measurements could accelerate the tedious and
time-consuming manual measurement process crucial
for numerous applications such as surveying (Zakaria
and Gupta, 2019), medicine (Donli
´
c, 2019; Heyms-
field et al., 2018), fashion (Zakaria and Gupta, 2019),
fitness (Casadei and Kiel, 2020), and entertainment
(Camba et al., 2016).
The first methods to address automatic 3D body
measurement extraction were landmark-based. The
goal of landmark-based methods is to extract body
locations suitable for accurate measurement. These
methods usually use heuristics, such as body pro-
portions (Lu and Wang, 2008), to determine the ap-
a
https://orcid.org/0000-0002-2400-0625
b
https://orcid.org/0000-0003-2806-5140
c
https://orcid.org/0000-0002-3054-002X
d
https://orcid.org/0000-0002-5415-3630
proximate landmark locations. To further refine the
landmark locations, the change in body curvature
(Markiewicz et al., 2017) or the change in the cross-
section by cutting the body with a plane (Zhong
et al., 2018) is analyzed. Length measurements can
then be estimated using the Euclidean distance or the
Geodesic distance (Xie et al., 2021) between the land-
marks. Circumference measurements can be deter-
mined by cutting the subject with a plane at a de-
sired landmark, and finding the cross-section (Lu and
Wang, 2008). These measurements are, however, less
accurate in the presence of data noise. Additionally,
such methods assume specific scanning poses (Zhong
et al., 2018), no severe distortions of the body (Xie
et al., 2021), known gender (Lu and Wang, 2008), etc.
Recent advances in human body measurement
have been driven by statistical human body models
(often referred to as templates) such as SMPL (Loper
et al., 2015). The templates are relevant because
body measurements can be predefined since the se-
mantics of each vertex remain consistent across dif-
ferent poses and shapes (Wasenmuller et al., 2015).
Template-based methods first fit a statistical body
model to a 3D scan to find the optimal pose and shape
parameters after which the predefined measurements
524
Bojani
´
c, D., Bartol, K., Petkovi
´
c, T. and Pribani
´
c, T.
Direct 3D Body Measurement Estimation from Sparse Landmarks.
DOI: 10.5220/0012384000003660
Paper published under CC license (CC BY-NC-ND 4.0)
In Proceedings of the 19th International Joint Conference on Computer Vision, Imaging and Computer Graphics Theory and Applications (VISIGRAPP 2024) - Volume 4: VISAPP, pages
524-531
ISBN: 978-989-758-679-8; ISSN: 2184-4321
Proceedings Copyright © 2024 by SCITEPRESS – Science and Technology Publications, Lda.

Figure 1: We use a simple Bayesian ridge model to estimate 11 body measurements (show on the right) using 72 human body
landmarks (shown on the left). We mark with green the visible landmarks on the front of the body, and with red the not visible
landmarks that are located on the back of the body.
are extracted. However, the fitting is very sensitive to
the hyperparameters of the minimization (Loper et al.,
2015) and 3D scan data is often noisy. To increase the
robustness of the body measurements, some methods
extract additional features from the fitted template and
use them to estimate the measurements (Yan et al.,
2020). These features are complex, using multiple
predefined paths or PCA coefficients of the triangle
deformation found during the fitting process (Tsoli
et al., 2014).
We argue that anthropometric measurements can
be accurately learned using only sparse landmark data
instead of complex features or heuristics. Therefore,
we propose to use a simple Bayesian ridge regres-
sion model (Tipping, 2001) that takes landmark co-
ordinates as input, and outputs body measurements.
The motivation behind using the Bayesian regres-
sion model is the underlying assumption that the out-
put variables (the measurements) are normally dis-
tributed, as can be seen in the left part of Figure 2.
Furthermore, the normalized 3D coordinates of the
landmarks also reflect a 3D normal distribution, as
can be seen in the right part of Figure 2 (without the
outliers). Using the Bayes regression, we can encode
these distribution priors into the model.
Our approach assumes that accurate 3D body
landmarks are given, and their automatic extraction
from 3D scans is out of the scope of this work. If
3D landmarks are not given, they can be estimated
using existing methods such as (Wuhrer et al., 2010;
Luo et al., 2022; Xie et al., 2021). The key point is
that the competing methods (Tsoli et al., 2014; Hasler
et al., 2009) also assume accurate body landmarks but
use them to firstly fit a template body to the 3D scan,
and then estimate the body measurements, either us-
ing predefined locations or intermediate features. In
contrast to previous works, we use the landmark data
to directly predict the body measurements.
The main aim of our work is, therefore, to show
that the fitting process and complex feature extraction
can be skipped, and accurate body measurements can
be estimated directly from the landmark coordinates.
The body measurements estimated using only land-
marks are comparable in accuracy to the body mea-
surements obtained by first fitting the template mod-
els. To validate our claims, we evaluate our body mea-
surement estimation approach on a public CAESAR
dataset (Robinette et al., 1999).
2 RELATED WORK
The existing approaches for automatic body measure-
ment extraction can typically be divided into three
categories: template-based, landmark-based, and di-
rect methods.
Landmark-based methods make use of the 3D
landmarks on the body to extract the measurements
from the scanned human body. To find the landmarks,
(Zhong et al., 2018) slice the 3D scan every 5mm
along the height of the body, and search for changes
in the cross-sections to find the landmarks; (Lu and
Wang, 2008) use 2D silhouettes and grayscale im-
age to detect landmarks in 2D, after which they are
reprojected into the 3D space; (Xie et al., 2021)
use the Mean Curvature Skeleton (Tagliasacchi et al.,
2012) to find the segmentation of the body, after
which heuristics are used on the segmented parts
to define the landmarks; (Markiewicz et al., 2017)
Direct 3D Body Measurement Estimation from Sparse Landmarks
525

Figure 2: Distribution of measurements and landmarks. The left part of the Figure shows the distribution in mm for 4 body
measurements from the CAESAR (Robinette et al., 1999) dataset: arm length (shoulder to wrist), chest circumference, hip
circumference, and stature. As expected from body measurements, the arm length and stature seem to follow a normal
distribution; whereas the chest and hip seem to follow a positively skewed normal distribution. The right part of the Figure
shows the distribution for the Nuchale landmark over all the CAESAR dataset subjects. Since the subjects are scanned in a
normalized position, the variation of the landmark location reflects the change in human body shape. The Nuchale landmarks
across the subjects seem to follow a 3D normal distribution. This is observed for all the other landmarks as well.
compute the Gaussian curvature on the body to find
characteristic points with salient curvatures; (Wang
et al., 2006) assume colored markers on the human
body during the scanning process, which they extract
in post-processing. Once the landmarks are found,
length measurements can be estimated as Euclidean
or Geodesic distances between the landmarks, and
circumference measurements can be estimated by cut-
ting the subject with a plane at a desired landmark
location and finding the cross-section. Rather than
cutting the human body, (Xiaohui et al., 2018) find
a path on the body mesh from a set of landmarks to
determine the measurements.
Template-based methods fit a statistical human
body model (template) to a 3D scan and extract com-
plex features from the template to learn the body mea-
surements. The fitting process can be done by opti-
mizing over the body model parameters, and refined
by non-rigid deformation (NRD) (Yan et al., 2020;
Tsoli et al., 2014; Li and Paquette, 2020; Wasen-
muller et al., 2015) which minimizes several loss
components, such as the data term, landmark term,
smoothness term and normal term. Similarly, the fit-
ting process can be done using a deep learning model
(Kaashki et al., 2021; Kaashki et al., 2023), where
a 3D-CODED (Groueix et al., 2018) architecture is
used to infer the fitted body. After the template body
has been fitted, the measurements can be learned,
transferred, or estimated from 3D landmarks. To learn
the measurements (Tsoli et al., 2014; Li and Paquette,
2020; Yan et al., 2020) use 3D points and features ex-
tracted from the fitted body to learn the measurements
using different models, such as the ElasticNet (Zou
and Hastie, 2005), SVR (Chang and Lin, 2011) and
PLS (Geladi and Kowalski, 1986) models. To trans-
fer the measurements (Kaashki et al., 2021; Kaashki
et al., 2023; Wasenmuller et al., 2015) predefine the
body measurement paths on the template body, which
can be transferred onto the scan by finding the nearest
neighbor of each path point from the template to the
scan. Similarly, to estimate the measurements from
landmarks, (Wang et al., 2014; Gonzalez Tejeda and
Mayer, 2020) transfer the landmarks from the tem-
plate body to the scan, and find the measurement as
the previously described landmark-based methods.
Differently from the template-based and
landmark-based methods, direct methods
(
ˇ
Skorv
´
ankov
´
a et al., 2022; Probst et al., 2017)
learn the body measurements directly from the
frontal partial 3D scans. (
ˇ
Skorv
´
ankov
´
a et al., 2022)
uses a variation of the PointNet (Qi et al., 2016)
architecture whereas (Probst et al., 2017) uses
gradient-boosted trees to predict local measurements,
which are weighted in order to compute the final
measurements.
3 METHODOLOGY
3.1 Dataset
The CAESAR dataset (Robinette et al., 1999) is com-
prised of 4396 subjects scanned in the standing pose
with 73 annotated body landmarks. The landmarks
can be seen in Figure 3. The subjects were manu-
ally measured, and we use a subset of 11 measure-
ments following common practice (Tsoli et al., 2014),
as seen in Figure 1. We pre-process the dataset in
VISAPP 2024 - 19th International Conference on Computer Vision Theory and Applications
526
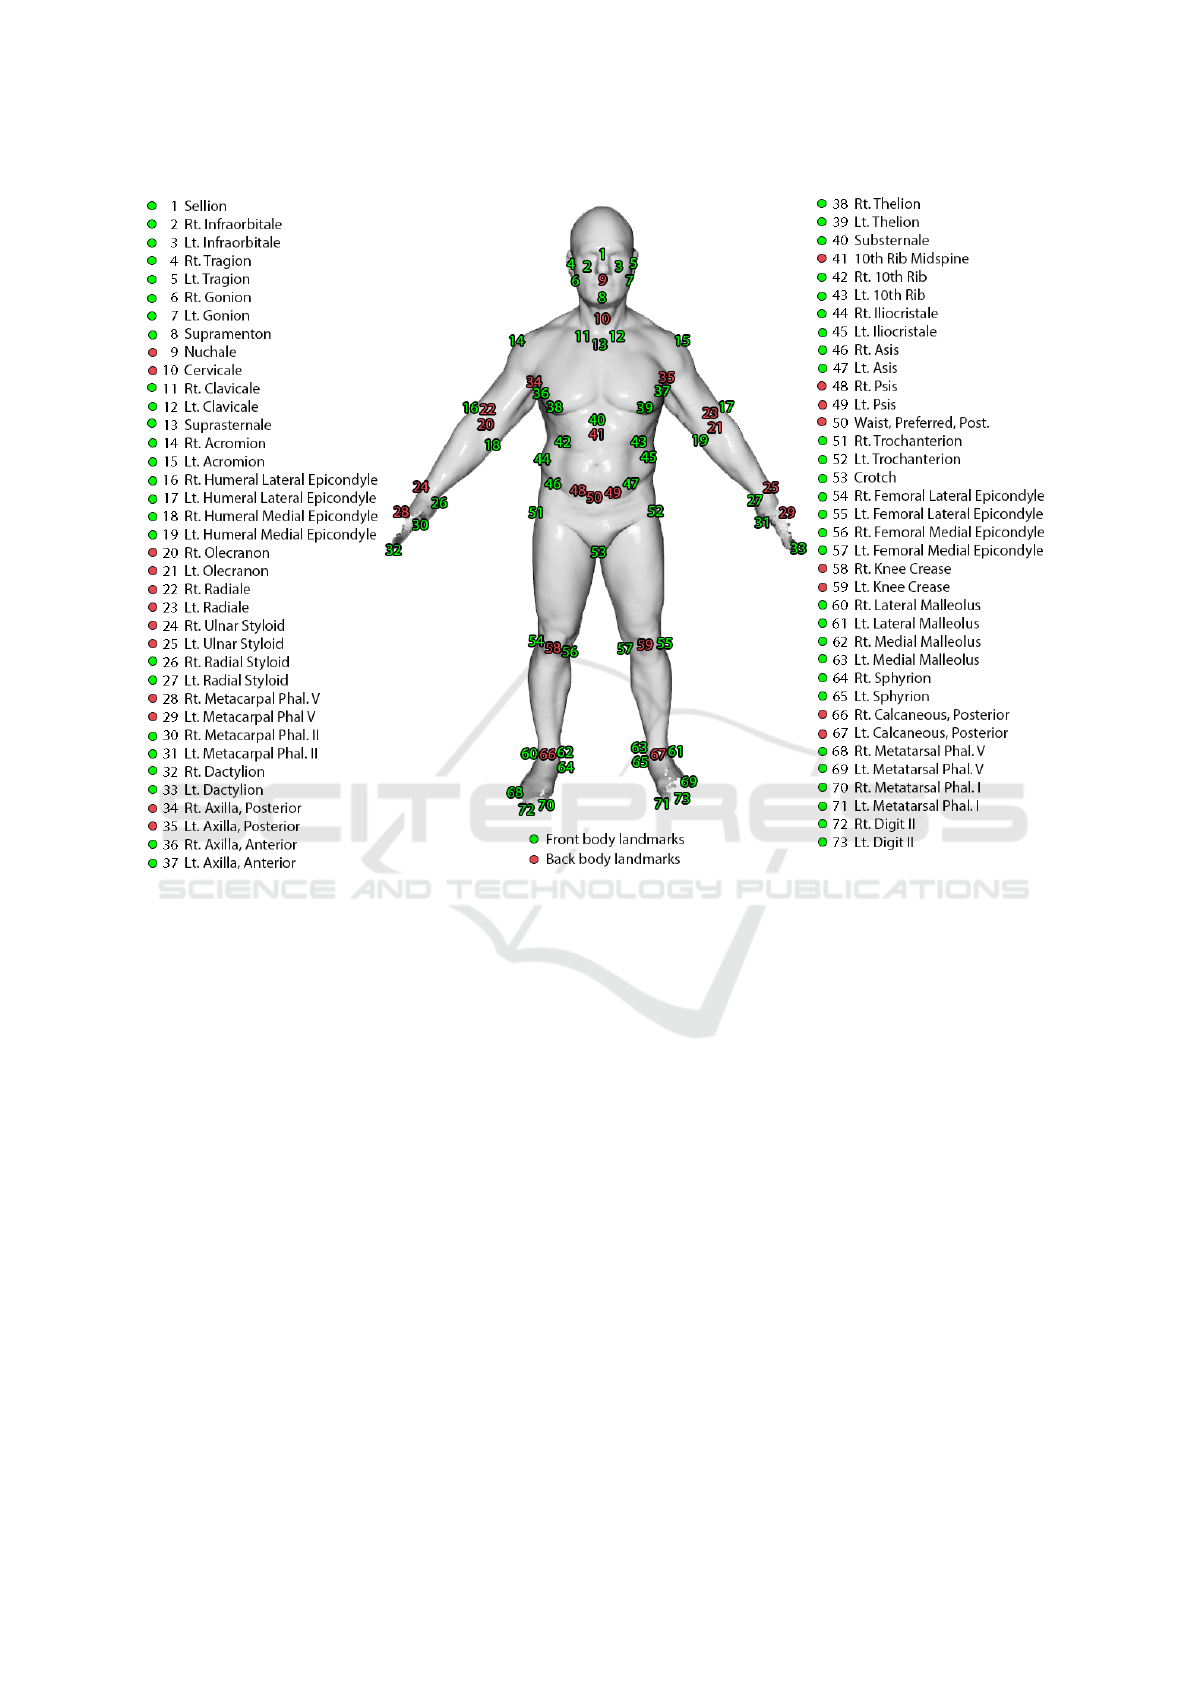
Figure 3: Landmarks used in this work defined in the CAESAR dataset. For more details, we refer the readers to (Robinette
et al., 1999).
order to remove the subjects with missing landmarks
or body measurements. We normalize the landmarks
by centering them using the Substernale landmark lo-
cated in the middle of the chest (see Figure 3). After
normalization, we remove the Substernale landmark
from the dataset since it does not hold any more in-
formation.
Finally, we end up with 1879 male subjects and
1954 female subjects, each with 72 landmarks and 11
body measurements. Following (Tsoli et al., 2014),
we randomly sample 200 scans for each sex as a test
set and use the remaining 1679 and 1754 for training.
3.2 Method
We use the Bayesian ridge regression model (Tipping,
2001) to learn the 11 body measurements listed in
Figure 1 given the 72 body landmarks sparsely scat-
tered over a scan. The Bayesian regression is used
to include regularization parameters in the estima-
tion procedure by introducing uninformative priors
over the hyper-parameters for the precision (inverse
of variance) of the weights w and error variance σ
2
of
a linear model.
More concretely, given a set of N subjects
{x
n
, y
i
n
}
N
n=1
, where x
n
∈ R
1×216
is the set of flattened
72 body landmarks and y
i
n
∈ R
1×1
is the i-th body
measurement, we assume a linear model:
y
i
n
= x
n
· w + ε
n
, (1)
where w ∈ R
216×1
are the weights of the linear model,
and ε
n
∼ N (0, σ
2
) is the vector of normally dis-
tributed errors. Then, the output measurement follows
a Normal distribution p(y
i
n
|x
n
) = N (y
i
n
| x
n
w, σ
2
). To
use the ridge regularization, the model weights w are
encoded using the normal distribution:
p(w | α) =
N
∏
i=1
N (w
i
| 0, α
−1
i
) (2)
where α
i
are the hyper-parameters for the precision of
each weight w
i
, modeling the strength of the prior. To
model these hyper-parameters, the Gamma distribu-
tion is used as a suitable conjugate prior for the preci-
Direct 3D Body Measurement Estimation from Sparse Landmarks
527

Table 1: MAE in mm on the CAESAR dataset for male subjects. AE denotes the allowable error. Results from (Tsoli, 2014).
Measurement (Anthroscan, 2014) (Hasler et al., 2009) (Tsoli et al., 2014) Ours AE (Gordon et al., 1989)
Ankle Circumference 13.66 5.72 5.56 6.24 4
Arm Length (Shoulder to Elbow) 13.99 12.66 13.32 6.95 -
Arm Length (Shoulder to Wrist) 14.49 13.76 12.66 9.93 -
Arm Length (Spine to Wrist) 14.71 11.81 10.40 11.38 -
Chest Circumference 13.96 15.21 13.02 18.24 15
Crotch Height 11.01 9.77 8.36 1.17 10
Head Circumference 5.51 7.46 5.59 8.92 5
Hip Circ. Max Height 16.50 18.89 19.05 17.33 -
Hip Circumference, Maximum 7.90 12.57 10.66 22.87 12
Neck Base Circumference 21.57 13.33 13.47 12.40 11
Stature 5.86 7.98 6.53 5.75 10
Average 12.65 11.74 10.78 11.02
sion of the Normal distribution:
p(α) =
N
∏
i=1
Gamma(α
i
| a, b). (3)
To model the error variance σ
2
, the Gamma distribu-
tion is chosen as a conjugate prior for the precision:
p(β) = Gamma(β | c, d) (4)
where β ≡ σ
−2
. Higher values of the parameters
a, b, c and d, indicate a stronger prior belief about the
corresponding precision.
Bayesian inference proceeds by computing the
posterior over all the unknowns, given the anthropom-
etry data y
i
=
y
i
1
, . . . y
i
N
T
:
p(w, α, σ
2
| y
i
) =
p(y
i
| w, α, σ
2
)p(w, α, σ
2
)
p(y
i
)
. (5)
Equation 5 cannot be solved in full analytically
because of the normalizing integral p(y
i
). Therefore,
(Tipping, 2001) resort to rewriting the posterior as:
p(w, α, σ
2
| y
i
) = p(w | y
i
, α, σ
2
)p(α, σ
2
| y
i
), (6)
and using approximations, to finally summarize the
problem as maximizing the marginal likelihood p(y
i
|
α, σ
2
)p(α)p(σ
2
). These are maximized using a gradi-
ent descent approach on the log marginal likelihood.
Finally, given a new subject with landmarks x
∗
,
predictions are made in terms of the distribution:
p(y
i
∗
| y
i
) =
Z
p(y
i
∗
| w, α, σ
2
)p(w, α, σ
2
| y
i
)dwdαdσ
2
.
(7)
To implement the Bayesian ridge regression, we
use the Scikit-learn (Pedregosa et al., 2011) library
with the default values of 1e−6 for all the four pa-
rameters a, b, c and d. We model each measurement
y
i
separately, and each sex separately, resulting in
2 × 11 = 22 models.
4 EXPERIMENTS
A great challenge with comparing and evaluating 3D
anthropometric methods are the limited open-source
datasets and code implementations. Most methods
create private small scale dataset (Zhong et al., 2018;
Kaashki et al., 2021; Lu and Wang, 2008) in order
to test their method with several human body scans,
and do not share it with the community because of
privacy issues. Additionally, most of the methods do
not share their implementations (Zhong et al., 2018;
Probst et al., 2017; Tsoli et al., 2014; Lu and Wang,
2008) with the community, making a thorough com-
parison between different methods very hard.
We compare our method with one commercial
solution denominated as Anthroscan (Anthroscan,
2014) and two template-based methods (Tsoli et al.,
2014; Hasler et al., 2009), which share their results
on the proprietary CAESAR dataset (Robinette et al.,
1999) available for purchase. To make a step to-
wards more open-source 3D anthropometry research,
we share the exact 3D scans we evaluate our method
on and make our implementation available to the re-
search community.
We use the mean absolute error (MAE) metric to
compare our estimated measurements with the ground
truth ones. The MAE for a single measurement is
computed as:
MAE =
1
N
N
∑
i=1
|y
i
gt
− y
i
est
| (8)
where N is the number of subjects, y
i
gt
is the
ground truth measurement for subject i and y
i
est
is
the estimate measurement for subject i. We compare
the MAE for each measurement separately and report
them in Table 1 and Table 2.
As can be seen from Table 1 and Table 2, each
method has certain advantages towards specific mea-
VISAPP 2024 - 19th International Conference on Computer Vision Theory and Applications
528

Table 2: MAE in mm on the CAESAR dataset for female subjects. AE denotes the allowable error. Results from (Tsoli,
2014). We bold the best result for each measurement.
Measurement (Anthroscan, 2014) (Hasler et al., 2009) (Tsoli et al., 2014) Ours AE (Gordon et al., 1989)
Ankle Circumference 7.55 6.59 6.19 5.87 4
Arm Length (Shoulder to Elbow) 11.26 8.42 6.65 6.32 6
Arm Length (Shoulder to Wrist) 11.67 10.42 10.05 7.36 -
Arm Length (Spine to Wrist) 13.19 13.40 11.87 9.84 -
Chest Circumference 12.43 13.02 12.73 17.26 15
Crotch Height 7.45 7.53 5.50 0.78 10
Head Circumference 7.44 7.45 5.91 8.42 5
Hip Circ. Max Height 17.05 18.96 18.59 20.99 -
Hip Circumference, Maximum 7.47 16.15 12.35 21.40 12
Neck Base Circumference 21.03 16.35 15.43 13.84 11
Stature 5.60 10.21 7.51 5.52 10
Average 11.10 11.68 10.25 10.69
surements. The commercial solution Anthroscan
(Anthroscan, 2014), achieves the lowest MAE on the
hip circumference measurements for both female and
male subjects. The reason for this might be that
the measurements are directly extracted from dense
scan data, without using a body template or relying
on accurate landmark data. However, the method
achieves the worst average results when comparing
all the measurements, making it less robust for hu-
man shape estimation. The template-based method
from (Hasler et al., 2009) performs slightly better (on
average) than Anthroscan. However, it does not seem
to have any advantages towards any specific measure-
ment. (Hasler et al., 2009) fits the template of the
SCAPE (Anguelov et al., 2005) body model onto the
scan, and uses a linear model to predict the measure-
ments from the body model vertices. This kind of
approach, however, depends on a very sensitive, ini-
tial fitting process, since the measurements are then
extracted from the template.
To address these issues, (Tsoli et al., 2014) fits
a BlendSCAPE (Hirshberg et al., 2012) body model
to the 3D scan and extracts complex features from
the template to learn an ElasticNet (Zou and Hastie,
2005) linear model to predict the measurements. By
using more sophisticated features, such as a set of pre-
defined paths, PCA coefficients of the body model fit-
ting, and limb lengths, (Tsoli et al., 2014) achieves
better results than the previous methods because, in
the end, it considers a much greater number of local
and global features. As can be seen from the Tables,
they achieve the lowest average errors.
We argue that dense 3D data and an additional
set of features are not necessary to accurately esti-
mate the body measurements and, therefore, we pro-
pose using only the 3D landmark data to estimate the
measurements. As shown in Table 1 and 2, using
only sparse landmark data, our method achieves com-
parable results to the state-of-the-art methods while
simplifying the measurement protocol. The method
achieves the best performance on the length measure-
ments, such as arm lengths, crotch height, and stature
for both sexes. Intuitively, these measurements ben-
efit from using landmarks, which are directly corre-
lated to how they are manually measured. Conse-
quently, our method achieves the lowest error on the
neck base circumference, which is the second hardest
measurement to estimate, judging by the average er-
rors across all of the competing methods. When mea-
sured manually by the experts, the neck base circum-
ference is taken with a beaded chain with an alligator
clip at one end. The chain is placed and clipped to-
gether so it lies at the base of the neck and falls over
the Cervicale landmark (see Figure 3). The length
of the chain to the bead where it is clipped is mea-
sured. This measuring protocol differs severely from
the others, making the measurement harder to esti-
mate. Our method seems to benefit, again, from well-
placed landmarks around the neck area, allowing a
better estimate of the measurement.
On the other hand, our method seems to strug-
gle with the chest and hip circumferences. One rea-
son for this can be attributed to the location of the
landmarks. With manual measurement, the chest cir-
cumference is located on the largest part between the
Thelion and Axilla landmarks. As can be seen from
Figure 3, however, there are no landmarks in that lo-
cation. Similarly, with manual measurement, the hip
circumference is located at the maximum protrusion
of the buttocks, approximately around the Trochante-
rion landmarks. As can be seen from Figure 3, again,
there are no landmarks on the front and back of the
body in those locations, which we know carry a lot of
variation of the human shape. Therefore, our method
needs to infer these measurements from substantially
less information than the competing methods (sparse
landmarks) and use the spatial relationship between
all the other landmarks, to infer the body proportions.
Direct 3D Body Measurement Estimation from Sparse Landmarks
529

The second reason these measurements are harder
to estimate is the assumption of the Bayesian regres-
sion to model the output variable (the measurements)
with the Normal distribution. As can be seen from
Figure 2, the chest and hip circumferences are the
only two measurements that have slightly skewed nor-
mal distributions, making them harder to generalize.
To address these issues, future work should focus on
landmark placement, making them more informative.
Rather than using multiple landmarks on the feet of
the subjects, for example, they could be replaced with
landmarks around the chest and hip area.
Finally, our average measurements for the male
and female subjects are behind the state-of-the-art
method from (Tsoli et al., 2014) by only 0.24 mm
and 0.44 mm respectively. We note, however, that
our average MAE gets skewed by the higher hip and
chest circumference errors. Comparing the median
errors, on the other hand, our method would achieve a
median MAE of 9.93 mm for the male subjects, com-
pared to 10.66 mm from (Tsoli et al., 2014); and a me-
dian MAE of 8.42 mm for the female subjects, com-
pared to 10.05 mm from (Tsoli et al., 2014). There-
fore, addressing the issue of better landmark place-
ment would greatly improve our results.
5 CONCLUSION
We propose a simple 3D body measurement estima-
tion method directly using the landmarks on the body.
Our method shows better or comparable results on
the CAESAR dataset for most measurements, and
achieves the lowest errors on the arm lengths, crotch
height, stature, and neck base circumference, for both
sexes. With our method, we show that extracting
complex features prior to measuring (such as mul-
tiple paths from the fitted template model, or PCA
coefficients of the triangle deformation of the fitted
template model), is not necessary to accurately esti-
mate the body measurements. Additionally, we show
that fitting a template body model to the scan is also
not necessary if given the location of 3D landmarks;
where accurate measurements can be directly esti-
mated from the landmarks.
To further improve the results for certain measure-
ments, such as the hip and chest circumferences, fu-
ture work will need to address the placement of the
3D landmarks, in order to provide the model with ad-
ditional information about the body shape. By cou-
pling the accurate landmark placement with a 3D
landmark extraction algorithm, our 3D body measure-
ment method could be made fully automatic.
ACKNOWLEDGEMENTS
This work has been supported by the Croatian Sci-
ence Foundation under projects IP-2018-01-8118 and
DOK-2020-01.
REFERENCES
Anguelov, D., Srinivasan, P., Koller, D., Thrun, S., Rodgers,
J., and Davis, J. (2005). Scape: Shape comple-
tion and animation of people. ACM Trans. Graph.,
24(3):408–416.
Anthroscan (2014). Human solutions gmbh. anthroscan.
http://www. https://www.human-solutions.com/. Ac-
cessed: 2023-10-06.
Bartol, K., Bojani
´
c, D., Petkovi
´
c, T., and Pribani
´
c, T.
(2021). A review of body measurement using 3d scan-
ning. IEEE Access, 9:67281–67301.
Camba, J. D., De Leon, A. B., de la Torre, J., Saor
´
ın, J. L.,
and Contero, M. (2016). Application of low-cost 3d
scanning technologies to the development of educa-
tional augmented reality content. In 2016 IEEE Fron-
tiers in Education Conference (FIE), pages 1–6.
Casadei, K. and Kiel, J. (2020). Anthropometric Measure-
ment. StatPearls Publishing, Treasure Island (FL).
Chang, C.-C. and Lin, C.-J. (2011). LIBSVM. ACM
Transactions on Intelligent Systems and Technology,
2(3):1–27.
Donli
´
c, M. (2019). Three-dimensional analysis of back sur-
face under dynamic conditions in scoliosis diagnos-
tics. PhD thesis, Faculty of Electrical Engineering and
Computing, University of Zagreb.
Geladi, P. and Kowalski, B. R. (1986). Partial least-squares
regression: a tutorial. Analytica Chimica Acta, 185:1–
17.
Gonzalez Tejeda, Y. and Mayer, H. A. (2020). Calvis: chest,
waist and pelvis circumference from 3d human body
meshes as ground truth for deep learning.
Gordon, C. C., Churchill, T., Clauser, C. E., Bradtmiller, B.,
and Mcconville, J. T. (1989). Anthropometric survey
of u.s. army personnel: Methods and summary statis-
tics 1988.
Groueix, T., Fisher, M., Kim, V. G., Russell, B., and Aubry,
M. (2018). 3d-coded : 3d correspondences by deep
deformation. In ECCV.
Hasler, N., Stoll, C., Sunkel, M., Rosenhahn, B., and Seidel,
H.-P. (2009). A Statistical Model of Human Pose and
Body Shape. Computer Graphics Forum.
Heymsfield, S. B., Bourgeois, B., Ng, B. K., Sommer, M. J.,
Li, X., and Shepherd, J. A. (2018). Digital anthropom-
etry: a critical review. European journal of clinical
nutrition, 72(5):680–687.
Hirshberg, D. A., Loper, M., Rachlin, E., and Black, M. J.
(2012). Coregistration: Simultaneous alignment and
modeling of articulated 3d shape. In Computer Vision
– ECCV 2012, pages 242–255. Springer Berlin Hei-
delberg.
VISAPP 2024 - 19th International Conference on Computer Vision Theory and Applications
530

Kaashki, N. N., Hu, P., and Munteanu, A. (2021). Deep
learning-based automated extraction of anthropomet-
ric measurements from a single 3-d scan. IEEE Trans-
actions on Instrumentation and Measurement, 70:1–
14.
Kaashki, N. N., Hu, P., and Munteanu, A. (2023). Anet: A
deep neural network for automatic 3d anthropometric
measurement extraction. IEEE Transactions on Mul-
timedia, 25:831–844.
Li, P. and Paquette, S. (2020). Predicting anthropometric
measurements from 3d body scans: Methods and eval-
uation. In Di Nicolantonio, M., Rossi, E., and Alexan-
der, T., editors, Advances in Additive Manufacturing,
Modeling Systems and 3D Prototyping, pages 561–
570, Cham. Springer International Publishing.
Loper, M., Mahmood, N., Romero, J., Pons-Moll, G., and
Black, M. J. (2015). SMPL: A skinned multi-person
linear model. ACM Trans. Graphics (Proc. SIG-
GRAPH Asia), 34(6):248:1–248:16.
Lu, J. and Wang, M. (2008). Automated anthropometric
data collection using 3d whole body scanners. Expert
Systems with Applications, 35(1-2):407–414.
Luo, S., Zhang, Q., and Feng, J. (2022). Automatic location
and semantic labeling of landmarks on 3d human body
models. Computational Visual Media, 8(4):553–570.
Markiewicz, Ł., Witkowski, M., Sitnik, R., and Mielicka, E.
(2017). 3d anthropometric algorithms for the estima-
tion of measurements required for specialized garment
design. Expert Systems with Applications, 85:366–
385.
Pedregosa, F., Varoquaux, G., Gramfort, A., Michel, V.,
Thirion, B., Grisel, O., Blondel, M., Prettenhofer,
P., Weiss, R., Dubourg, V., Vanderplas, J., Passos,
A., Cournapeau, D., Brucher, M., Perrot, M., and
Duchesnay, E. (2011). Scikit-learn: Machine learning
in Python. Journal of Machine Learning Research,
12:2825–2830.
Probst, T., Fossati, A., Salzmann, M., and Gool, L. V.
(2017). Efficient model-free anthropometry from
depth data. In 2017 International Conference on 3D
Vision (3DV). IEEE.
Qi, C. R., Su, H., Mo, K., and Guibas, L. J. (2016). Pointnet:
Deep learning on point sets for 3d classification and
segmentation. arXiv preprint arXiv:1612.00593.
Robinette, K. M., Daanen, H., and Paquet, E. (1999).
The caesar project: a 3-d surface anthropometry sur-
vey. In Second International Conference on 3-D Dig-
ital Imaging and Modeling (Cat. No.PR00062), pages
380–386.
ˇ
Skorv
´
ankov
´
a, D., Rie
ˇ
cick
´
y, A., and Madaras, M. (2022).
Automatic estimation of anthropometric human body
measurements. In Proceedings of the 17th Interna-
tional Joint Conference on Computer Vision, Imag-
ing and Computer Graphics Theory and Applications.
SCITEPRESS - Science and Technology Publications.
Tagliasacchi, A., Alhashim, I., Olson, M., and Zhang, H.
(2012). Mean curvature skeletons. Computer Graph-
ics Forum, 31(5):1735–1744.
Tipping, M. E. (2001). Sparse bayesian learning and the
relevance vector machine. J. Mach. Learn. Res.,
1:211–244.
Tsoli, A. (2014). Modeling the Human Body in 3D: Data
Registration and Human Shape Representation. PhD
thesis, Brown University, Department of Computer
Science.
Tsoli, A., Loper, M., and Black, M. J. (2014). Model-based
anthropometry: Predicting measurements from 3d hu-
man scans in multiple poses. In IEEE Winter Confer-
ence on Applications of Computer Vision. IEEE.
Wang, M.-J. J., Wu, W.-Y., Lin, K.-C., Yang, S.-N., and
Lu, J.-M. (2006). Automated anthropometric data col-
lection from three-dimensional digital human models.
The International Journal of Advanced Manufactur-
ing Technology, 32(1-2):109–115.
Wang, Q., Jagadeesh, V., Ressler, B., and Piramuthu, R.
(2014). Im2fit: Fast 3d model fitting and anthropo-
metrics using single consumer depth camera and syn-
thetic data. In 3D Image Processing, Measurement ,
and Applications.
Wasenmuller, O., Peters, J. C., Golyanik, V., and Stricker,
D. (2015). Precise and automatic anthropometric mea-
surement extraction using template registration. In
Proceedings of the 6th International Conference on
3D Body Scanning Technologies, Lugano, Switzer-
land, 27-28 October 2015. Hometrica Consulting - Dr.
Nicola D'Apuzzo.
Wuhrer, S., Azouz, Z. B., and Shu, C. (2010). Semi-
automatic prediction of landmarks on human models
in varying poses. In 2010 Canadian Conference on
Computer and Robot Vision, pages 136–142.
Xiaohui, T., Xiaoyu, P., Liwen, L., and Qing, X. (2018).
Automatic human body feature extraction and per-
sonal size measurement. Journal of Visual Languages
& Computing, 47:9–18.
Xie, H., Zhong, Y., Yu, Z., Hussain, A., and Chen, G.
(2021). Automatic 3d human body landmarks extrac-
tion and measurement based on mean curvature skele-
ton for tailoring. The Journal of The Textile Institute,
113(8):1677–1687.
Yan, S., Wirta, J., and K
¨
am
¨
ar
¨
ainen, J.-K. (2020). Anthro-
pometric clothing measurements from 3d body scans.
Machine Vision and Applications, 31(1-2).
Zakaria, N. and Gupta, D. (2019). Anthropometry, Apparel
Sizing and Design. The Textile Institute Book Series.
Elsevier Science.
Zhao, H., Chen, J., Wang, L., and Lu, H. (2023). Arkittrack:
A new diverse dataset for tracking using mobile rgb-
d data. In Proceedings of the IEEE/CVF Conference
on Computer Vision and Pattern Recognition (CVPR),
pages 5126–5135.
Zhong, Y., Li, D., Wu, G., and Hu, P. (2018). Automatic
body measurement based on slicing loops. Interna-
tional Journal of Clothing Science and Technology,
30(3):380–397.
Zou, H. and Hastie, T. (2005). Regularization and vari-
able selection via the elastic net. Journal of the Royal
Statistical Society Series B: Statistical Methodology,
67(2):301–320.
Direct 3D Body Measurement Estimation from Sparse Landmarks
531
