
Gait Parameter Estimation from a Single Privacy Preserving Depth
Sensor
Yale Hartmann
∗ a
, Jonah Kl
¨
ockner
∗
, Lucas Deichsel
b
, Rinu Elizabeth Paul
c
and Tanja Schultz
d
Cognitive Systems Lab, University of Bremen, Germany
Keywords:
Depth Video, Skeleton Estimation, Pose Estimation, Stride Length Estimation, Step Length Classification,
Frailty Assessment.
Abstract:
Recovery from a hard fall is more difficult with age, and early detection of increased fall risk can support
early prevention training. The ETAP project focuses on detecting early signifiers like step length in real-time
and unobtrusively in older adult life with a single privacy-preserving depth sensor. This paper highlights our
efforts to estimate a healthy individual’s skeleton and stride length and outlines how this will be transferred to
care facilities. The best ResNet50-based model achieved a mean precision error of 17.49 cm per skeletal joint
and stride length error of 5.73 cm on the mean stride length over 727 steps and 7.52cm over 16.67 seconds.
Furthermore, 80% accuracy in step classification was achieved. These results show that gait parameter esti-
mation is accurately possible. In the future, we aim to improve these results and build an online system with
our care facility partners, transferring these findings to everyday life.
1 INTRODUCTION
Analysis of the human gait has a multitude of med-
ical and sports appliances (Hodgins, 2008), includ-
ing early detection of diseases like Parkinson’s (Han-
nink et al., 2018) or predicting increased fall risk
for the elderly (Runge and Hunter, 2006). Because
of these benefits, analysis should be regularly con-
ducted every or every other year (Lee et al., 2022).
It requires schooled personnel, and even if performed
binds time, the personnel and elderly might rather
spend otherwise (Stone and Skubic, 2012; Hodgins,
2008). Research and the need for automatic moni-
toring have increased with the increase of older pop-
ulations and has included inertial sensors (Hellmers
et al., 2018; Kroll et al., 2022; Greene et al., 2017;
Pedrero-S
´
anchez et al., 2023; Bet et al., 2021), grip
strength (Greene et al., 2014), smart floors (Chawan
et al., 2022; Mishra et al., 2022), cameras (Ferraris
et al., 2021), and depth sensors (Eichler et al., 2022;
Dubois and Charpillet, 2017; Dubois et al., 2017;
Dubois et al., 2019; Dubois et al., 2021).
a
https://orcid.org/0000-0002-1003-0188
b
https://orcid.org/0009-0001-5349-7511
c
https://orcid.org/0009-0003-2327-5111
d
https://orcid.org/0000-0002-9809-7028
∗
Authors contributed equally
Mobility assessment tests are performed to under-
stand and evaluate the mobility, balance, and fall risk
for older adults. Different tests are performed, and
scores are given on factors such as the time taken
to complete the test. Automatically analyzing gait
allows for multiple useful test parameters, like step
length, stride length, or cadence, to be determined
continuously and outside the testing process. Figure
1 shows the distinction between step length and stride
length: step length is the distance between two feet,
and stride length is the distance between the same foot
when on the ground.
Figure 1: Gait parameters. Image from (Tekscan, 2019).
Most research focuses on the Timed-up-and-go
(TUG) test, as it is clearly defined and proven to pre-
dict frailty (Hellmers et al., 2018; Kroll et al., 2022;
Greene et al., 2017; Pedrero-S
´
anchez et al., 2023;
Bet et al., 2021; Dubois et al., 2017; Dubois et al.,
2019; Dubois et al., 2021). The Tinetti Test (Chawan
et al., 2022; Dubois et al., 2021), the PPA (Pedrero-
Hartmann, Y., Klöckner, J., Deichsel, L., Paul, R. and Schultz, T.
Gait Parameter Estimation from a Single Privacy Preserving Depth Sensor.
DOI: 10.5220/0012383700003657
Paper published under CC license (CC BY-NC-ND 4.0)
In Proceedings of the 17th International Joint Conference on Biomedical Engineering Systems and Technologies (BIOSTEC 2024) - Volume 1, pages 637-645
ISBN: 978-989-758-688-0; ISSN: 2184-4305
Proceedings Copyright © 2024 by SCITEPRESS – Science and Technology Publications, Lda.
637

S
´
anchez et al., 2023) and BBS (Eichler et al., 2022)
are also commonly used. The research community
now aims to validate if these test results and frailty
scores can also be predicted from everyday life, as
this would allow continuous monitoring in outpatient
settings (Choi et al., 2021). Another challenge in both
frailty and fall detection is the lack of data from neu-
rological patients (Betteridge et al., 2021) and the as-
sociated question of transferability.
Internal (body-worn) and external (environmen-
tal) sensors lend themselves to continuous everyday
life monitoring. Inertial Sensors are occlusion-free
and are with the inhabitant at all times, inside and
outside — if they remember and want to wear them.
Depth cameras are limited to the rooms in which they
are installed. However, in care facilities, the elderly
often stay in the same few rooms. Since the cam-
eras do not record facial features, they are easier for
inhabitants and care facility workers to accept than
traditional RGB cameras and are deemed privacy-
preserving. Crucially, the inhabitant does not need
to remember to wear them.
While research on human skeleton/pose estima-
tion from RGB(+D) cameras has improved substan-
tially over the years
1
(Cao et al., 2021; Fang et al.,
2022; Zhang et al., 2022) and has been applied to gait
analysis (Viswakumar et al., 2019) the same cannot
be said for purely depth based approaches.
In this paper, we put forward our approach uti-
lizing classical and deep learning models to continu-
ously monitor the gait in everyday life by using a sin-
gle privacy-preserving depth camera. We specifically
focus on skeleton estimation, stride, and step length
calculation and lay out how we are currently bringing
these into elderly care facilities.
2 METHODS
We developed a multi-stage pipeline for skeleton es-
timation from depth images and, in turn, stride length
estimation from the skeleton. Multiple skeleton and
stride length estimation models on a custom-recorded
dataset are evaluated for this. Each is trained on the
first five sessions of the dataset and tested on the sixth.
The stride length estimation algorithms are tuned on
the motion capture data and applied without changes
to the extracted skeletons.
1
paperswithcode.com/task/3d-human-pose-estimation
(last opened 26.10.23)
2.1 Metrics
We have used a multitude of metrics to capture each
model’s performance. Some consider skeleton accu-
racy, while others compare step detection and stride
length calculation.
The Mean Per Keypoint Positional Error deter-
mines how close the joint positions of the prediction
are to the ground truth on average (Zheng et al., 2022)
— smaller is better.
MPKPE =
1
N
N
∑
i=1
∥K
i
− J
∗
i
∥
2
(1)
N refers to the number of all joints and J
i
and K
i
being
the predicted and true positions, respectively.
The Procrustes-aligned Mean Per Keypoint
Positional Error is used to compare the skeletal struc-
ture by factoring out factors like scaling and rotation
(Reddy, 2015) — smaller is better.
The Percentage of Correct Keypoints gives the
percentage of joints within a certain distance (typi-
cally 15 cm) (Zheng et al., 2022). The range is 0-
100% — higher is better.
PCK =
100
N
N
∑
i=1
(
1, if ∥K
i
− J
i
∥
2
< 15 cm
0, else
, (2)
The Mean Bone Standard Deviation is a measure
for the stability of the predicted skeleton by mean de-
viations in the bone length over time (Sun et al., 2017)
— smaller is better.
Step Percent describes the ratio of predicted steps
(S
∗
) and true amount of steps (S) and give a rough in-
dication if a model over- or underestimates the num-
ber of taken steps. The best value is 100%. Larger
values indicate too many recognized steps. Lower
values indicate missing steps.
SP =
S
∗
S
(3)
Mean Stride Length Difference indicates how
large the model deviates from the true stride length on
average. If the predicted strides are too long, the met-
ric becomes positive and negative for too short strides.
MSLD =
1
|S|
·
|S|
∑
i=1
S
i
−
1
|S
∗
|
·
|S
∗
|
∑
i=1
S
∗
i
(4)
The Distance Ratio (DR) gives the summed stride
difference between prediction and ground truth. Sim-
ilar to SP, the best value is 100%, with lower values
indicating underestimation and higher values indicat-
ing overestimation.
DR =
|S
∗
|
∑
i=1
S
∗
i
· (
|S|
∑
i=1
S
i
)
−1
(5)
BIOSIGNALS 2024 - 17th International Conference on Bio-inspired Systems and Signal Processing
638
The Step Distribution Distance (SDD) describes
the 5 cm binned histogram difference of stride lengths
between estimation and ground truth (Cha and Sri-
hari, 2002) — lower is better.
2.2 Dataset
The lab dataset was recorded at our BASE (Meier
et al., 2018) using the Optitrack Motion Capture and
newly installed Intel RealSense D435 depth sensor.
It was recorded from one person walking freely in
the room and comprises 89 min of data. It con-
tains 157,825 frames over six sessions of 14:50 min
at 120 GB. 2,375 depth frames were lost to techni-
cal errors and could not be recovered. The 2.95% of
missing motion capture joints were reconstructed us-
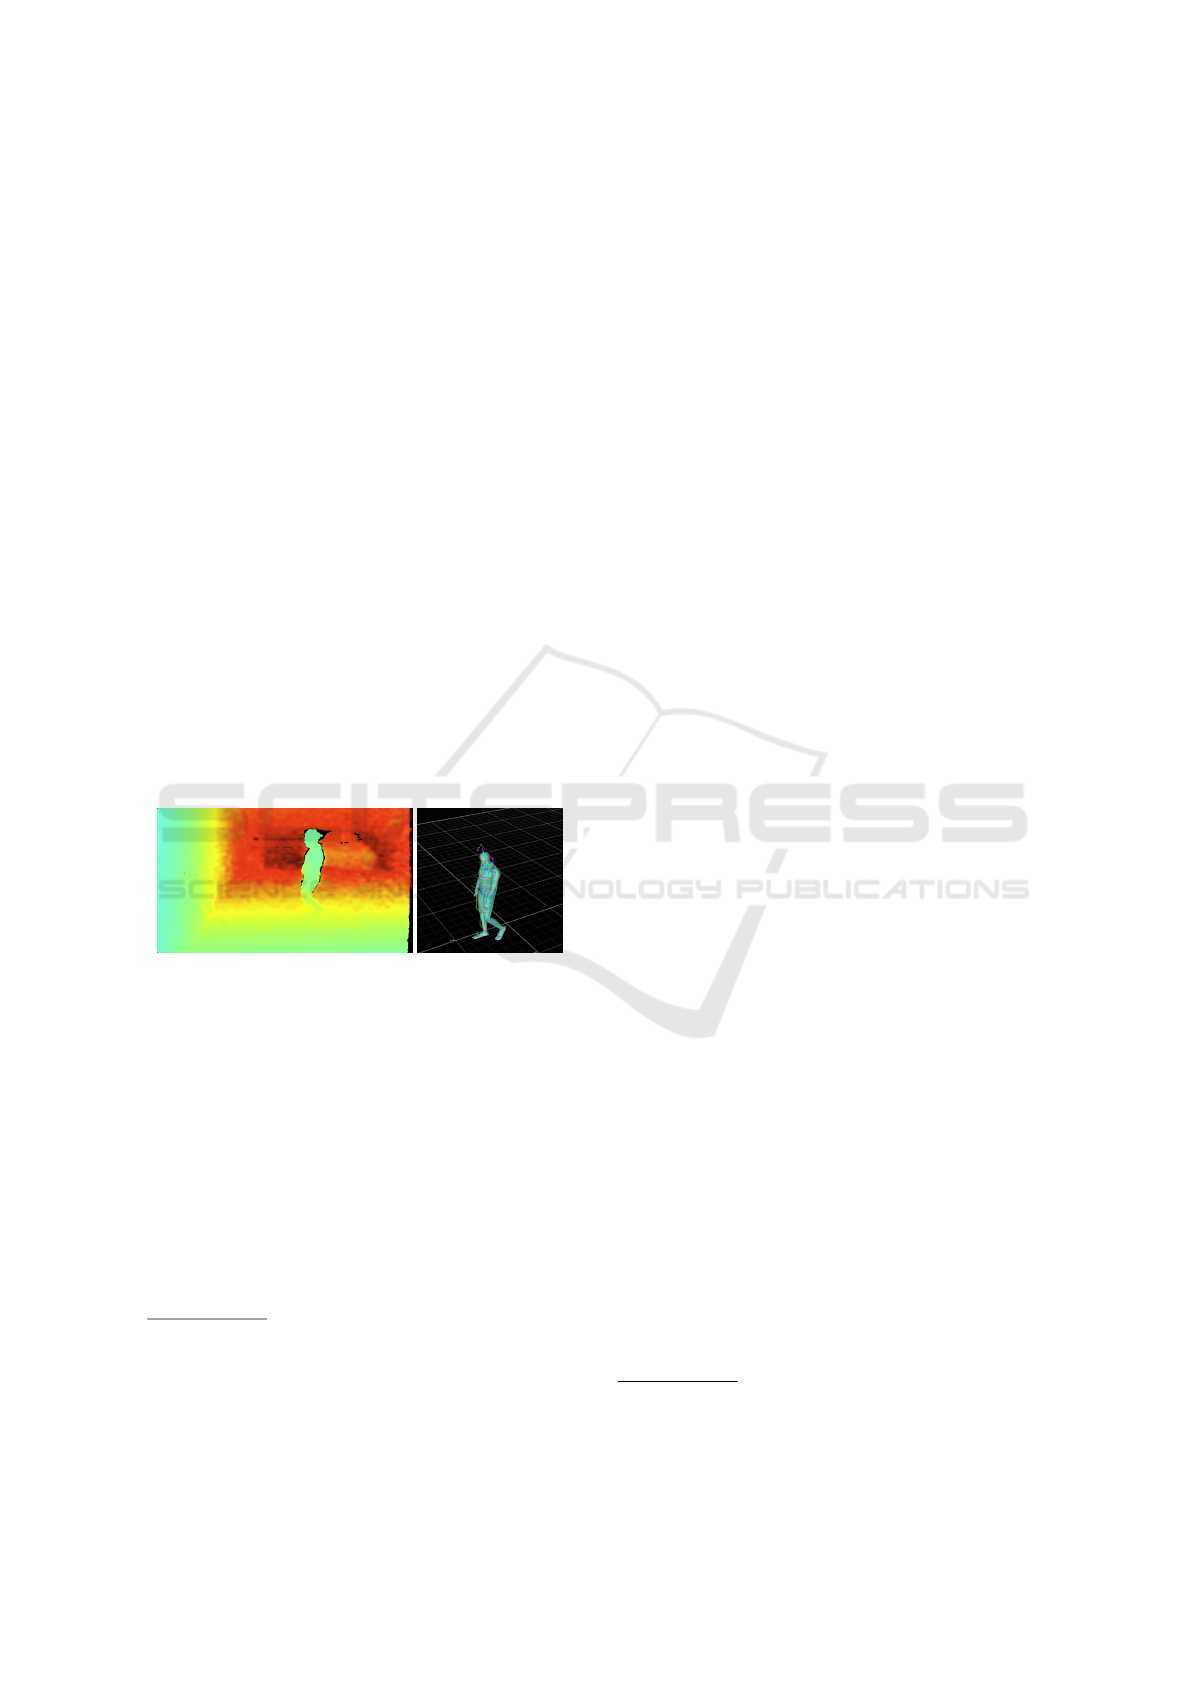
ing linear interpolation. Figure 2 shows a frame of
the recorded single channel 16 bit depth image with
848x480 pixel resolution on the left and the accord-
ing 3D motion capture rendering on the right. The
motion capture skeleton uses 21 Joints, including the
heels and toes of both feet. Additionally, the motion
capture includes 3DOF joint rotations. As these are
not strictly necessary for the developed algorithms,
we evaluated models using rotation and position as
well as position only.
Figure 2: Left: Colorized example image from the depth
sensor. Turquoise/green is close at ∼ 2.5 m (due to the cam-
era height), and dark red is far at ∼ 4.2 m. The person in
turquoise is in the front, and to their back right is a table.
Right: corresponding motion capture.
The motion capture and the depth camera both
use active infrared emitters that influence each other’s
precision. Therefore, the RealSense depth camera
was hardware synced with the Optitrack motion cap-
ture via inversed output sync signal from the Mo-
tive software via Optitrack eSync 2 and custom input
connector
2
to the RealSense. The inversed exposure
signal results in a rising edge once the motion cap-
ture emitters are turned off, which triggers the depth
emitters and shutter
3
. In other words, the sensors
2
Many thanks for connector confection to robotik.dfki-
bremen.de/ (last opened: 26.10.23)
3
The whitepaper has since been withdrawn but the
technology still works with specific versions. More
info: github.com/IntelRealSense/librealsense/issues/10926
(last opened: 26.10.23). Our Versions: RealSense SDK at
are synced to record directly after each other, such
that the emitters do not interfere. The Genlock mode
of the RealSense halves the framerate from 60fps to
30fps at the desired 848x480 resolution, and the mo-
tion capture is set to mirror this framerate as described
above, resulting in undisturbed signals at 30 Hz from
both sensors.
The stride lengths for this dataset are calculated
using the motion capture marker positions of the foot
joints at their low point in acceleration, i.e., when
placed on the ground during the single support of the
stance phase, see Section 3. The average stride length
and variation of the single recorded individual can be
seen in Figure 9. The average step length is 38 cm.
2.3 Recording Precision
Both sensors were checked for precision. A good
indicator for skeletal precision is the BSD, as de-
scribed in section 2.1. The BSD for all bones is
0.578 cm, with the left upper arm being most stable
at 4 · 10
−6
cm and the left thigh being the most vari-
able at 1.308 cm.
According to Intel
4
, the optimum range for the
D435 is 30 cm - 3 m. With an RMS Depth Error
of ∼ 30 mm at 3 m distance (Grunnet-Jepsen et al.,
2020). This aligns with Mejia-Trujillo et al.’s study of
the RealSenses performance for gait analysis (Mejia-
Trujillo et al., 2019) and our findings.
3 STRIDE LENGTH ESTIMATION
There are two places where the stride length estima-
tion is applied: (1) for ground truth calculation and (2)
for final prediction. In the former case, the algorithm
is applied to the motion capture data; in the latter, it is
applied to the extracted skeletons. The former case is
focused on as the algorithm works similarly for both.
The subject was able to move freely in the room.
Thus, the ground truth stride lengths cannot be pre-
determined and must be estimated from the motion
capture. The core idea is based on the not-moving
foot during ground contact in the stance phase. Fig-
ure 3 shows the speed of the left foot over a 13 second
window. The signal was cleaned by applying a But-
terworth Lowpass filter of second order. The cut-off
is set to 4 Hz, based on the assumption of a maximum
2 Hz walking speed. As can be seen, the speed reg-
ularly hits zero, indicating a mid-stance. The devel-
oped algorithm then detects the local minimum and
2.50.0, RealSense Firmware at 05.13.00.50
4
intelrealsense.com/depth-camera-d435/ (last opened
26.10.23
Gait Parameter Estimation from a Single Privacy Preserving Depth Sensor
639
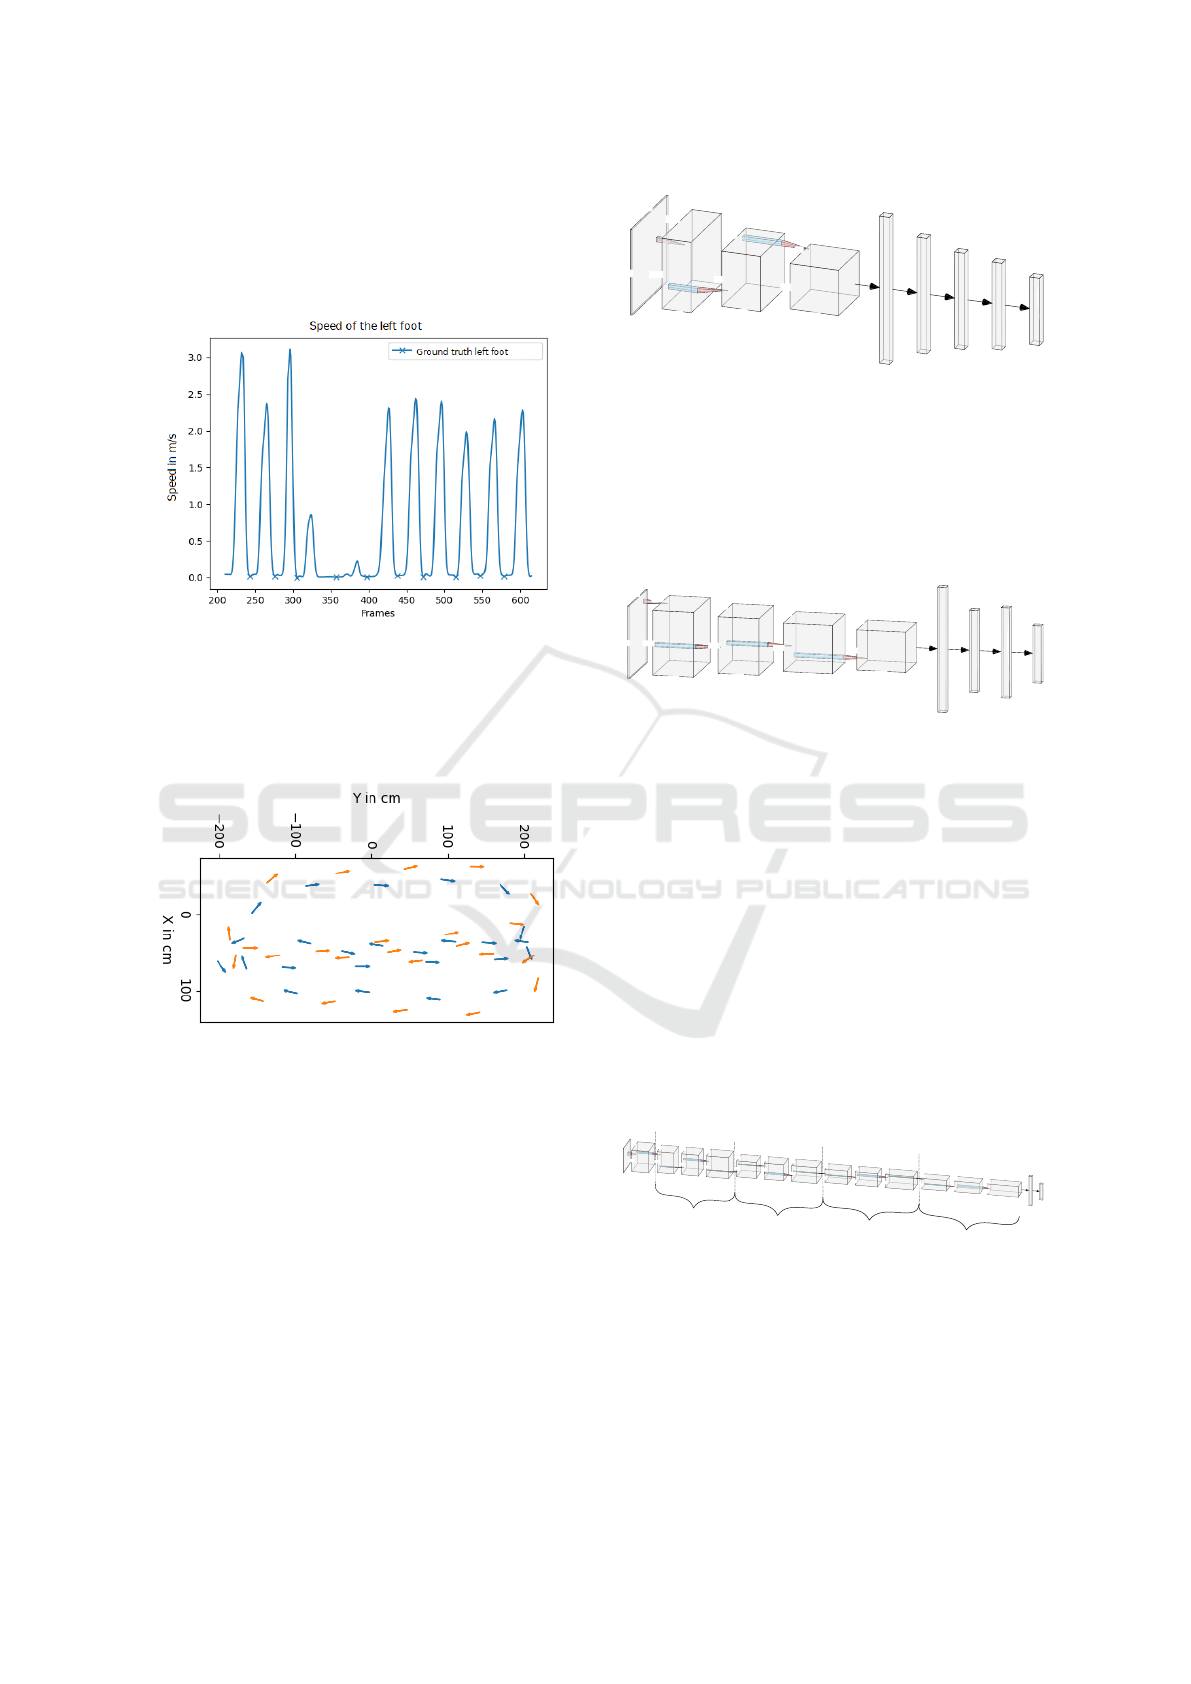
sets a minimum distance between two mid-stances to
prevent noise from influencing the results. The mini-
mum distance was tuned by hand on the ground truth
data, such that the number of steps matches the ones
taken during the session, as depicted in Figure 3.
Figure 3: Speed of the left foot. Detected middle stance
phase marked with X. The image shows 13 s.
Figure 4 shows another example of the determined
ground truth steps by plotting each foot in blue or yel-
low and indicating heel and toe motion capture mark-
ers.
Figure 4: Detected Steps. Blue is the left foot, and orange
is the right foot. The arrow starts at the heel and ends at the
toe of the motion capture data.
3.1 Motion Capture Estimation from
Depth Video
The baseline CNN architecture consists of three
convolutional layers with Max-Pooling and RELU-
activation, as shown in Figure 5. Depending on
whether the network should predict rotation, the out-
put is either size 63 or 126. The 164 million parame-
ters are trained using the Adam optimizer.
The second architecture is based on Li and Chan’s
work (Li and Chan, 2015) and uses a fourth convolu-
tional layer and a Dropout layer with a 25% dropout.
The architecture is shown in Figure 6. The dimen-
848
480
282
160
1
8
16
32
53
26
94
47
39104
4096
1024
512
126
Figure 5: Baseline CNN architecture.
sions were adjusted from Li and Chan’s RGB input
to our single channel depth input. Like the baseline
CNN architecture, the Adam optimizer was used for
training. A variation of this model includes the us-
age of an Average Pooling Layer in the first layer to
reduce the number of trainable parameters from 106
million to 13 million.
848
480
424
240
212
120
106
101760
1024
2048
126
64
53
30
64
60
32
32
1
Figure 6: Li and Chan-based CNN architecture.
The third model is based on the ResNet50 archi-
tecture used by Sun et al. (Sun et al., 2017), as shown
in Figure 7. The ResNet50 was once trained with the
L1-Norm and once with the compositional loss, as
proposed by Sun et al. The core idea of the composi-
tional loss is to take the dependencies between joints
into account to achieve a more stable skeleton predic-
tion. The SGD optimizer was used with a momentum
of 0.9.
The compositional loss trained network outputs
joint positions relative to the hip. As we wanted to
keep the stride length algorithm the same, we also in-
cluded a simple CNN that predicts the hip position
as an absolute value and then transforms the relative
joints into absolute positions.
3x
6x
4x
3x
240
480
848
64
64
64
256
128
128
512
256
256
1024
512
512
2048
120
120
120
60
60
60
30
30
30
15
15
15
424
212
212
212
106
53
53
53
27
27
27
106
106
2048
60
Figure 7: ResNet50 architecture.
3.2 Results
Table 1 shows the aggregated results of all model vari-
ants. As mentioned, each model was trained on the
first five sessions and tested on the sixth session of
the dataset. The best model per metric is marked in
BIOSIGNALS 2024 - 17th International Conference on Bio-inspired Systems and Signal Processing
640
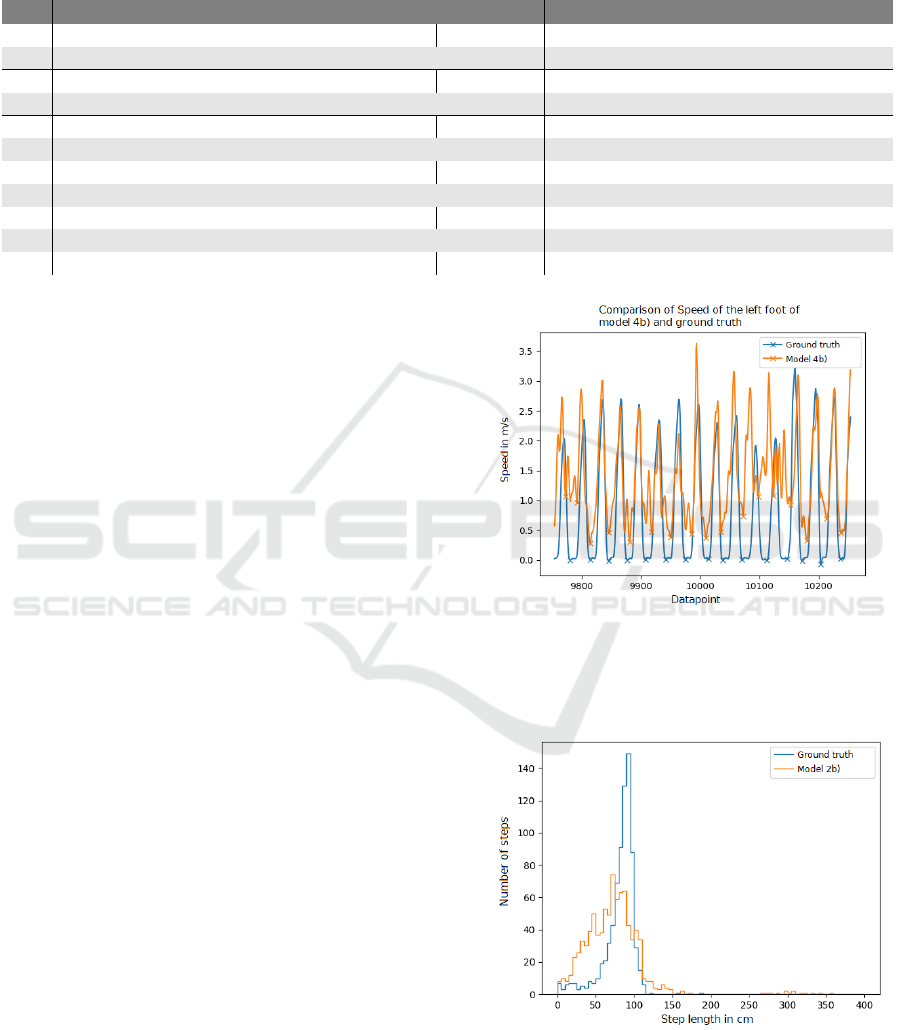
Table 1: Results of all Models. (1) Baseline CNN: with rotation (1a) and without (1b). (2) Li and Chan-based CNN: with
rotation (2a) and without (2b). (3) Model (2) with AvgPool Layer: with rotation (3a), without (3b), and without + smaller
Learning Rate (3c). (4) ResNet50: with rotation + L1-Loss (4a), without + L1-Loss (4b), without + MSE Loss (4c) and
without + Compositional Loss (4d).
MPKPE
↓
(cm) PMPKPE
↓
(cm) PCK
↑
(%) BSD
↓
(cm) SP (%) MSLD (cm) DR (%) SDD
↓
1a) 25.20 18.57 41.46 3.00 123.81 -11.09 107 11428
1b) 25.03 18.41 67.23 2.15 126.15 -10.20 110 11645
2a) 28.94 18.75 30.88 1.30 106.81 1.21 108 9773
2b) 25.00 18.10 67.94 1.90 106.59 1.68 109 9770
3a) 23.61 18.07 35.57 1.67 121.89 -9.84 107 9881
3b) 19.03 17.16 76.75 2.01 121.54 -10.87 105 10442
3c) 20.24 17.90 73.38 1.70 122.85 -12.29 104 10689
4a) 17.49 16.15 59.72 1.11 115.35 -7.53 105 7032
4b) 17.62 16.02 83.31 1.23 116.04 -5.73 108 6620
4c) 21.34 18.67 74.97 3.97 120.78 -7.00 110 8864
4d) 32.21 27.78 31.50 0.00 119.48 -13.23 100 10728
bold. The ResNet50 models generally perform best,
except for the Step Percent (SP) and Mean Stride
Length Difference (MSLD), where the Li and Chan-
based CNN outperforms them. Notably, all models
perform better without predicting the rotation (a vs. b
variants), specifically in the PCK metric. The higher
error on rotation corresponds with the notion that ro-
tations are challenging to get right from a single depth
image, and the additional free parameters are helpful
to model performance.
The ResNet50 architectures outperform any other
model on the skeleton-based metrics (MPKPE, PMP-
KPE, PCK, and BSD) by a margin. 17.49 cm and
17.62 cm mean keypoint error (MPKPE) is the lowest
recorded, and 83% PCK (e.g., 83% of points are off
by less than 15 cm) is the highest reported. Consid-
ering the 3 cm RealSense error, this is quite a good
value. The compositional loss based ResNet seems to
have learned the skeletal structure perfectly but does
not apply it correctly to the depth images, resulting in
a perfect BSD and DR but otherwise subpar results,
requiring further investigation.
Considering the estimated strides, all models over-
estimate the steps taken (SP larger than 100%). This
can be explained by the higher noise in the depth-
based skeletons over the motion capture ground truth,
as seen in Figure 8. A key option includes using
a more sophisticated time-sequence model for mid-
stance or direct stride length estimation.
Figure 9 and Figure 10 show the 5 cm binned
stride histograms for models 2b) and 4b), respec-
tively. The Li and Chan-based CNN underestimates
most strides. Specifically, the ground truth peak
around 90 cm is not fully accounted for. Model 2b)
does have a 106% SP and a DR of 110%, indicating
that the number of steps found matches the ground
truth. However, it seems there are too many short
Figure 8: Speed comparison left foot ground truth vs pre-
dicted by model 4b.
strides counterbalanced by a few double-width strides
(see 300 cm strides in Figure 9).
Figure 9: Model 2b) 5 cm binned histograms of the ground
truth (blue) and predicted (orange) steps.
In contrast, model 4b) main issue is the overly rec-
ognized short strides, as seen in the histogram 10 and
the 116% SP. However, the stride length distribution
Gait Parameter Estimation from a Single Privacy Preserving Depth Sensor
641
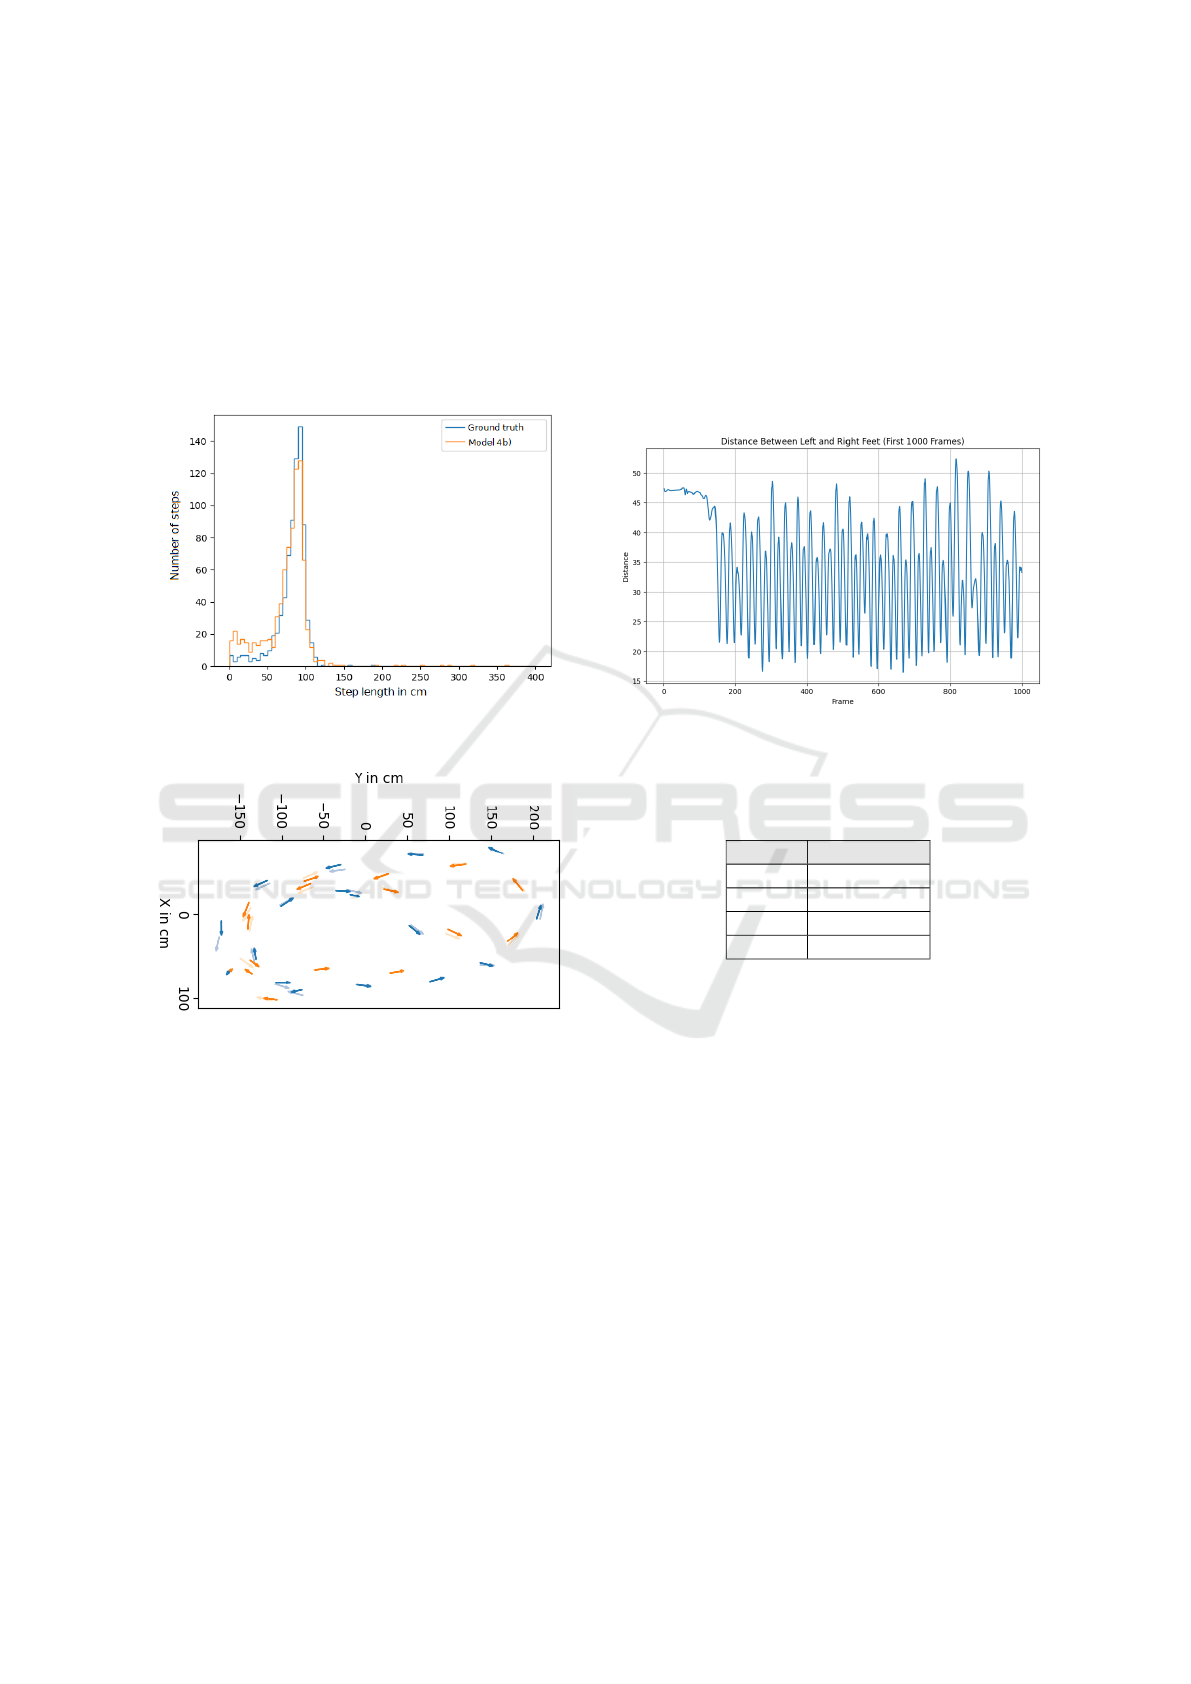
best matches the ground truth, and the DR is at 108%
(indicating that too many steps are found), but the
summed distance remains close to the ground truth.
The notion is further supported by Figure 11. At lo-
cations (0, 0) and (-150, 0), two mid-stance phases on
the right foot are recognized, where only one should
be; accordingly, these are two of the too-short strides.
Almost all other phases are correctly identified and
reasonably close to the ground truth.
Figure 10: Model 4b) 5 cm binned histograms of the ground
truth (blue) and predicted (orange) steps.
Figure 11: Model 4b). Subsequence of the sixth session.
The left foot is plotted in orange, and the right foot is in
blue. Full color represents predicted steps. Faded color is
ground truth.
4 STEP LENGTH
CLASSIFICATION
Step Length estimation and classification extend the
stride length estimation and are essential for various
mobility assessment tests such as SPPB (Short Phys-
ical Performance Battery) (Guralnik, 1994) where
classification into shorter, longer, or usual length steps
impacts score calculations.
The ground truth calculation for step length dif-
fers from stride length as this is the point in time
when both feet are on the ground and the local max-
ima of the Euclidean distance between the two feet,
as shown in Figure 12. The step length is then de-
rived from the motion capture foot joints, considering
the person’s center of mass and walking direction, see
(de Queiroz Burle et al., 2020). This differs from the
stride length estimation, as both feet are considered
here, whereas the same foot is considered in stride
length. Local maxima are determined using a sliding
window of eleven frames and scipy’s argrelextrema
function.
Figure 12: Euclidean distance between right and left foot
for first 1000 frames.
Table 2: Distribution of step into various classes according
to the step length.
Class Range (cm)
normal 30.4 to 45.6
small < 30.4
big > 45.6
other -
Based on the step length ground truth, four dif-
ferent classes are created: other, typical step, small
step, and big step. The normal range is considered ac-
cording to the age, height, and sex of the participant
in the dataset (Gill et al., 2016). Every step that is
20% higher than the average length (38 cm, see Sec-
tion 2.2) is considered a big step, and every step that
is 20% smaller than the average length, is considered
a small step, as shown in Table 2. Only the frames
with local maxima are considered steps for this task,
and all other frames are labeled as other. This makes
the task substantially harder but allows us to apply the
same model to online data in the future.
The classification into said four classes is real-
ized with a few variations: (1) using the complete
21 positional skeletons vs. only the left and right leg
joints and (2) using Random Forests vs. K-Nearest-
Neighbor classifiers.
The data was re-balanced during preprocessing by
random sub-sampling of the other class and split into
BIOSIGNALS 2024 - 17th International Conference on Bio-inspired Systems and Signal Processing
642
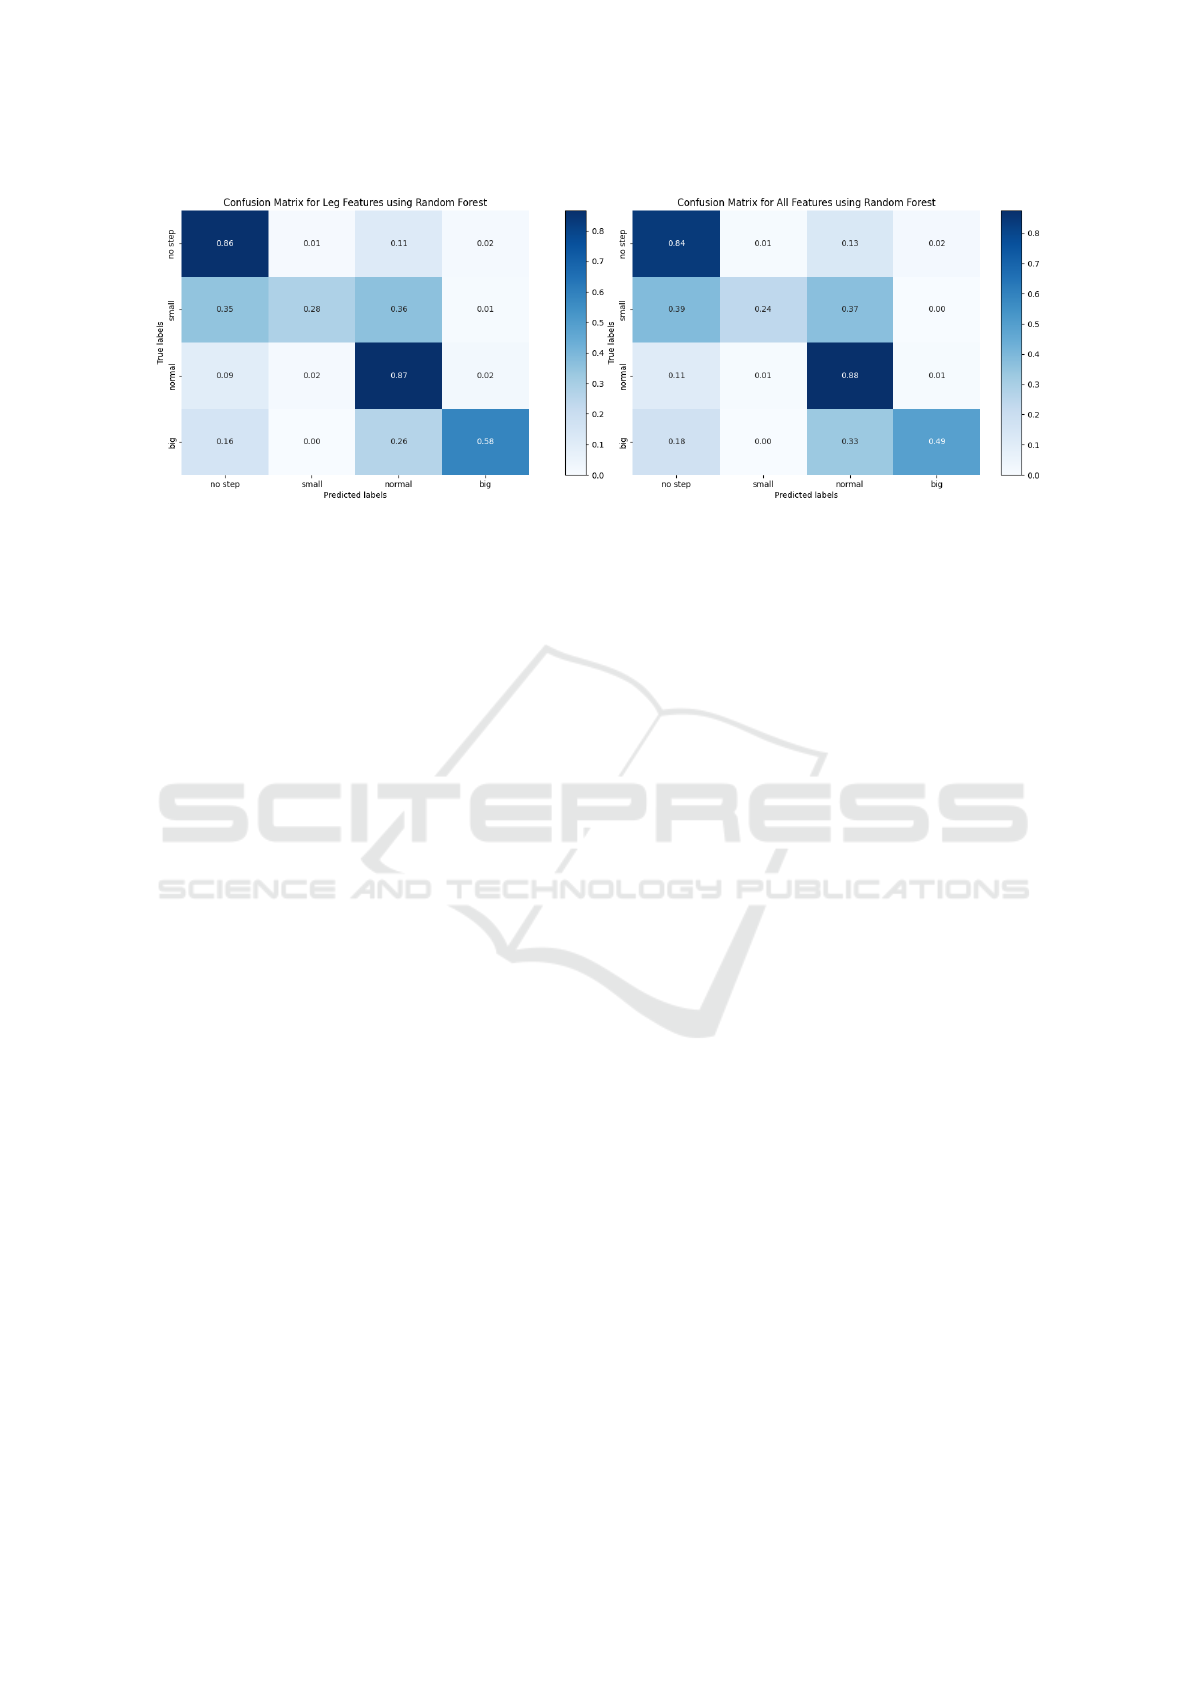
Figure 13: Confusion Matrix of RF classifier using only leg joints vs. the whole skeleton.
a randomized 80:20 split — furthermore, all absolute
joint positions were converted to be relative to the hip
joint. After an extensive grid search, the best classi-
fier is the Random Forest, with a maximum depth of
20 and 150 trees. The most prominent features found
via the RF’s feature importance are the leg joints, in-
cluding Foot, Toe Base, Up Leg, and Leg. Figure 13
shows the RFs performance on all joints vs only the
leg joints.
The evaluation was performed using 10-fold
cross-validation. The RF classifier performed best
(80% accuracy), slightly trailed by the KNN (77% ac-
curacy). The RF performs slightly better when using
only the most prominent leg joints, with an increase
of 2% accuracy.
5 CONCLUSIONS
In this paper, we put forward our approach to gait
parameter estimation from a single depth sensor in
preparation for online everyday frailty assessments in
elderly care facilities. We collected a 90 min dataset
with custom hardware synchronization of the Opti-
track Motion Capture and Intel RealSense D435 and
evaluated three deep learning approaches to pose es-
timation, our algorithm for stride length estimation,
and our models for step length classification.
The skeleton estimation achieved a 17.49 cm
mean per key point error (MPKPE) with an error of
3 cm attributed to the depth sensor and the partici-
pant’s distance. Building on this, the stride length
estimation often overestimated the number of steps
taken but is very close to the ground truth by means of
stride lengths (SDD of 6620) and total distance (DR
of 108%). The main issue was mid-stance phases de-
tected where none were present, resulting in too many
small steps predicted. The step length classification
showed good results with 80% accuracy. While the
feature importance ranking showed the feet joints to
be most crucial, using all joints almost performed on
par, leaving room to investigate occlusions and com-
pare to works based on silhouette tracking.
6 FUTURE WORK
The next logical step is to combine the deep learning-
based pose estimation and machine learning-based
step length/stride length estimation and add time se-
quence modeling. This way, both partial occlusions
and time context can further improve the stability of
all models. Another approach currently under inves-
tigation is transferring RGB-pre-trained models like
AlphaPose and PoseNet or their architectures into
depth only, like done above with the ResNet50 archi-
tecture.
A key question remaining is the transferability to
elderly patients as well as unsupervised everyday life
settings. For this, we recorded 10,000+ h of depth
data in three elderly care facilities and plan to apply
the above findings, models, and future improvements
after finishing annotation and preprocessing.
The keen eye might have noticed that almost all
models above are technically real-time capable. After
further evaluation of the aforementioned facility data,
we aim to deploy these into the facilities to evaluate
their impact on everyday care personnel work and in-
habitants’ well-being.
ACKNOWLEDGEMENTS
The research reported in this paper has been sup-
ported by the German Ministry of Health (BMG),
as part of the Research Project ETAP - Evalua-
Gait Parameter Estimation from a Single Privacy Preserving Depth Sensor
643

tion von teilautomatisierten Pflegeprozessen in der
Langzeitpflege am Beispiel von KI-basiertem Bewe-
gungsmonitoring (etap-projekt.de/) and by the Ger-
man Research Foundation DFG as part of the Collab-
orative Research Center 1320 EASE - Everyday Ac-
tivity Science and Engineering, University of Bremen
(ease-crc.org/).
REFERENCES
Bet, P., Castro, P. C., and Ponti, M. A. (2021). Foresee-
ing future falls with accelerometer features in active
community-dwelling older persons with no recent his-
tory of falls. Experimental Gerontology, 143:111139.
Betteridge, C. M. W., Natarajan, P., Fonseka, R. D., Ho, D.,
Mobbs, R., and Choy, W. J. (2021). Objective falls-
risk prediction using wearable technologies amongst
patients with and without neurogenic gait alterations:
A narrative review of clinical feasibility. mHealth,
7(0).
Cao, Z., Hidalgo, G., Simon, T., Wei, S.-E., and Sheikh, Y.
(2021). OpenPose: Realtime Multi-Person 2D Pose
Estimation Using Part Affinity Fields. IEEE Trans-
actions on Pattern Analysis and Machine Intelligence,
43(1):172–186.
Cha, S.-H. and Srihari, S. N. (2002). On measuring the
distance between histograms. Pattern Recognition,
35(6):1355–1370.
Chawan, V. R., Huber, M., Burns, N., and Daniel, K.
(2022). Person Identification And Tinetti Score Pre-
diction Using Balance Parameters : A Machine Learn-
ing Approach To Determine Fall Risk. In Proceed-
ings of the 15th International Conference on PErva-
sive Technologies Related to Assistive Environments,
pages 203–212, Corfu Greece. ACM.
Choi, J., Parker, S. M., Knarr, B. A., Gwon, Y., and Youn, J.-
H. (2021). Wearable Sensor-Based Prediction Model
of Timed up and Go Test in Older Adults. Sensors,
21(20):6831.
de Queiroz Burle, A., de Gusm
˜
ao Lafayette, T. B., Fonseca,
J. R., Teichrieb, V., and Da Gama, A. E. F. (2020).
Real-time approach for gait analysis using the kinect
v2 sensor for clinical assessment purpose. In 2020
22nd Symposium on Virtual and Augmented Reality
(SVR), pages 144–153. IEEE.
Dubois, A., Bihl, T., and Bresciani, J.-P. (2017). Automat-
ing the Timed Up and Go Test Using a Depth Camera.
Sensors, 18(2):14.
Dubois, A., Bihl, T., and Bresciani, J.-P. (2019). Auto-
matic measurement of fall risk indicators in timed up
and go test. Informatics for Health and Social Care,
44(3):237–245.
Dubois, A., Bihl, T., and Bresciani, J.-P. (2021). Identifying
Fall Risk Predictors by Monitoring Daily Activities
at Home Using a Depth Sensor Coupled to Machine
Learning Algorithms. Sensors, 21(6):1957.
Dubois, A. and Charpillet, F. (2017). Measuring frailty and
detecting falls for elderly home care using depth cam-
era. Journal of Ambient Intelligence and Smart Envi-
ronments, 9(4):469–481.
Eichler, N., Raz, S., Toledano-Shubi, A., Livne, D.,
Shimshoni, I., and Hel-Or, H. (2022). Automatic
and Efficient Fall Risk Assessment Based on Machine
Learning. Sensors (Basel, Switzerland), 22(4):1557.
Fang, H.-S., Li, J., Tang, H., Xu, C., Zhu, H., Xiu, Y., Li,
Y.-L., and Lu, C. (2022). AlphaPose: Whole-Body
Regional Multi-Person Pose Estimation and Tracking
in Real-Time.
Ferraris, C., Cimolin, V., Vismara, L., Votta, V., Amprimo,
G., Cremascoli, R., Galli, M., Nerino, R., Mauro, A.,
and Priano, L. (2021). Monitoring of Gait Parameters
in Post-Stroke Individuals: A Feasibility Study Using
RGB-D Sensors. Sensors, 21(17):5945.
Gill, S., Keimig, S., Kelty-Stephen, D., Hung, Y.-C., and
DeSilva, J. (2016). The relationship between foot
arch measurements and walking parameters in chil-
dren. BMC Pediatrics, 16.
Greene, B. R., Doheny, E. P., O’Halloran, A., and
Anne Kenny, R. (2014). Frailty status can be accu-
rately assessed using inertial sensors and the TUG test.
Age and Ageing, 43(3):406–411.
Greene, B. R., Redmond, S. J., and Caulfield, B. (2017).
Fall Risk Assessment Through Automatic Combina-
tion of Clinical Fall Risk Factors and Body-Worn Sen-
sor Data. IEEE Journal of Biomedical and Health In-
formatics, 21(3):725–731.
Grunnet-Jepsen, A., Sweetser, J. N., and Woodfill, J.
(2020). Tuning depth cameras for best perfor-
mance. https://dev.intelrealsense.com/docs/tuning-
depth-cameras-for-best-performance.
Guralnik, J. (1994). short physical performance battery as-
sessing lower extremity and prediction of mortality
and nursing home admission. J. Gerontrol., 49:85–94.
Hannink, J., Kautz, T., Pasluosta, C. F., Barth, J., Sch
¨
ulein,
S., Gaßmann, K.-G., Klucken, J., and Eskofier, B. M.
(2018). Mobile Stride Length Estimation With Deep
Convolutional Neural Networks. IEEE Journal of
Biomedical and Health Informatics, 22(2):354–362.
Hellmers, S., Izadpanah, B., Dasenbrock, L., Diek-
mann, R., Bauer, J. M., Hein, A., and Fudickar, S.
(2018). Towards an Automated Unsupervised Mo-
bility Assessment for Older People Based on Inertial
TUG Measurements. Sensors (Basel, Switzerland),
18(10):3310.
Hodgins, D. (2008). The importance of measuring human
gait. Medical device technology, 19(5):42, 44–7.
Kroll, F., L
¨
offler, S., Becker, I., and Hofstedt, P. (2022).
Automatic Detection of Timed-up and Go Tests with
IMU Sensor Data:. In Proceedings of the 15th Inter-
national Joint Conference on Biomedical Engineer-
ing Systems and Technologies, pages 15–24, Online
Streaming, — Select a Country —. SCITEPRESS -
Science and Technology Publications.
Lee, L., Jones, A., Hillier, L. M., Costa, A., Patel, T., and
Parikh, R. (2022). Frailty screening in older adults: Is
annual screening necessary in primary care? Family
Practice, 39(1):12–18.
BIOSIGNALS 2024 - 17th International Conference on Bio-inspired Systems and Signal Processing
644

Li, S. and Chan, A. B. (2015). 3D Human Pose Estima-
tion from Monocular Images with Deep Convolutional
Neural Network. In Cremers, D., Reid, I., Saito, H.,
and Yang, M.-H., editors, Computer Vision – ACCV
2014, Lecture Notes in Computer Science, pages 332–
347, Cham. Springer International Publishing.
Meier, M., Mason, C., Porzel, R., Putze, F., and Schultz, T.
(2018). Synchronized multimodal recording of a table
setting dataset.
Mejia-Trujillo, J. D., Casta
˜
no-Pino, Y. J., Navarro, A.,
Arango-Paredes, J. D., Rinc
´
on, D., Valderrama, J.,
Mu
˜
noz, B., and Orozco, J. L. (2019). Kinect™ and
Intel RealSense™ D435 comparison: A preliminary
study for motion analysis. In 2019 IEEE International
Conference on E-health Networking, Application &
Services (HealthCom), pages 1–4.
Mishra, A. K., Skubic, M., Despins, L. A., Popescu, M.,
Keller, J., Rantz, M., Abbott, C., Enayati, M., Shalini,
S., and Miller, S. (2022). Explainable Fall Risk Pre-
diction in Older Adults Using Gait and Geriatric As-
sessments. Frontiers in Digital Health, 4:869812.
Pedrero-S
´
anchez, J.-F., De-Rosario-Mart
´
ınez, H., Medina-
Ripoll, E., Garrido-Ja
´
en, D., Serra-A
˜
n
´
o, P., Moll
`
a-
Casanova, S., and L
´
opez-Pascual, J. (2023). The
Reliability and Accuracy of a Fall Risk Assessment
Procedure Using Mobile Smartphone Sensors Com-
pared with a Physiological Profile Assessment. Sen-
sors (Basel, Switzerland), 23(14):6567.
Reddy, T. (2015). Scipy.spatial.procrustes - SciPy v1.9.1
Manual.
Runge, M. and Hunter, G. (2006). Determinants of muscu-
loskeletal frailty and the risk of falls in old age. Jour-
nal of Musculoskeletal and Neuronal Interactions,
6(2):167.
Stone, E. E. and Skubic, M. (2012). Capturing habitual,
in-home gait parameter trends using an inexpensive
depth camera. In 2012 Annual International Confer-
ence of the IEEE Engineering in Medicine and Biol-
ogy Society, pages 5106–5109.
Sun, X., Shang, J., Liang, S., and Wei, Y. (2017). Composi-
tional Human Pose Regression. In Proceedings of the
IEEE International Conference on Computer Vision,
pages 2602–2611.
Tekscan (2019). The Gait Cycle: Phases,
Parameters to Evaluate & Technology.
https://tekscan.com/blog/medical/gait-cycle-phases-
parameters-evaluate-technology.
Viswakumar, A., Rajagopalan, V., Ray, T., and Parimi, C.
(2019). Human Gait Analysis Using OpenPose. In
2019 Fifth International Conference on Image Infor-
mation Processing (ICIIP), pages 310–314, Shimla,
India. IEEE.
Zhang, J., Tu, Z., Yang, J., Chen, Y., and Yuan, J. (2022).
MixSTE: Seq2seq Mixed Spatio-Temporal Encoder
for 3D Human Pose Estimation in Video. In 2022
IEEE/CVF Conference on Computer Vision and Pat-
tern Recognition (CVPR), pages 13222–13232, New
Orleans, LA, USA. IEEE.
Zheng, C., Wu, W., Chen, C., Yang, T., Zhu, S., Shen,
J., Kehtarnavaz, N., and Shah, M. (2022). Deep
Learning-Based Human Pose Estimation: A Survey.
APPENDIX
The code for this paper can be found here:
github.com/Saniamos/biosignals24.
Gait Parameter Estimation from a Single Privacy Preserving Depth Sensor
645
