Viewpoint Selection for Molecular Visualization: Analysis and
Applications
Vincent Larroque
1
, Maxime Maria
1
, St
´
ephane M
´
erillou
1
and Matthieu Montes
2,3
1
Laboratoire XLIM, UMR CNRS 7252, Universit
´
e de Limoges, France
2
GBCM - Laboratoire G
´
enomique, Bioinformatique et Chimie Mol
´
eculaire, EA7528,
Conservatoire National des Arts et M
´
etiers, H
´
esam Universit
´
e, France
3
Institut Universitaire de France (IUF), France
Keywords:
Molecular Visualization, Viewpoint Selection, Virtual Tours.
Abstract:
Molecular systems are often visually complex and abstract. It can be difficult, even for experts, to explore
and find meaningful viewpoints. Research in viewpoint selection methods has mainly focused on general real-
world objects and only a few works tackled molecular scenes. In this paper, we present a study of 20 state-
of-the-art viewpoint selection methods from the general field, applied to molecular visualization. Our goal is
to determine if these methods can find two important geometrical configurations for molecules. Additionally,
we propose an automatic generation of informative and visually pleasing molecular tours to help the study and
the communication around molecules.
1 INTRODUCTION
The study of molecular systems, for instance for drug
design, has been increasingly relying on computer vi-
sualization as it simplifies the exploration, analysis,
and understanding of their properties and actions. Vi-
sualization software also enables experts to share the
results of their studies more easily between them or
with the general public (Olson, 2018).
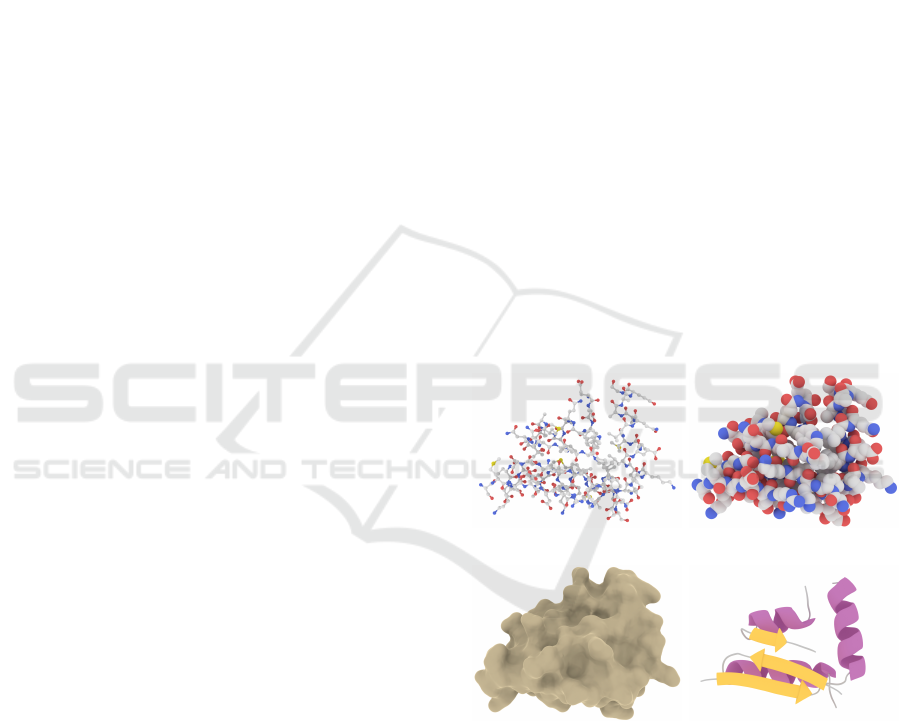
Molecules can be represented in various ways,
each providing specific information about their prop-
erties (Kozl
´
ıkov
´
a et al., 2017). Figure 1 shows the ge-
ometric diversity of representations that can be used.
Ball & Stick (figure 1a) displays the atoms and their
covalent bond as spheres and cylinders; van der Waals
(figure 1b) only shows atoms as spheres with a ra-
dius proportional to their van der Waals radius; Sol-
vent Excluded Surface (figure 1c) gives the boundary
of the molecular volume regarding a solvent; Cartoon
(figure 1d) describes the secondary structure of the
molecule with ribbons, arrows, and coils.
Molecular systems are visually complex and ab-
stract objects, whatever their representation. It is thus
difficult, even for experts, to explore them to find
meaningful points of view. An automatic viewpoint
search tool would therefore make their work easier
and increase their productivity. Despite this poten-
tially useful application, only a few works have tack-
(a) . (b)
(c) (d)
Figure 1: Different molecular representations of the same
molecule: (a) Ball & Stick; (b) van der Waals; (c) Solvent
Excluded Surface; (d) Cartoon.
led this issue.
Viewpoint selection methods have been vastly
studied to find good views of general “real-world”
objects, for instance for movies, video games, or
computer-aided design (Bonaventura et al., 2018).
However, most of these works have not been tested
for molecular visualization which makes it difficult to
develop new dedicated methods.
58
Larroque, V., Maria, M., Mérillou, S. and Montes, M.
Viewpoint Selection for Molecular Visualization: Analysis and Applications.
DOI: 10.5220/0012383300003660
Paper published under CC license (CC BY-NC-ND 4.0)
In Proceedings of the 19th International Joint Conference on Computer Vision, Imaging and Computer Graphics Theory and Applications (VISIGRAPP 2024) - Volume 1: GRAPP, HUCAPP
and IVAPP, pages 58-69
ISBN: 978-989-758-679-8; ISSN: 2184-4321
Proceedings Copyright © 2024 by SCITEPRESS – Science and Technology Publications, Lda.

In this paper, we propose a global study of previ-
ous general methods to evaluate their capacity to find
points of interest in molecular scenes. In addition, we
use the results of this analysis to propose a tool for
automatically creating tours of important features of
molecular systems.
In summary, our main contributions are:
• An analysis of general state-of-the-art viewpoint
selection methods for general objects applied to
molecular visualization.
• A benchmark of the ability of these methods
to detect specific geometrical configurations for
molecules.
• A method to generate informative tours of molec-
ular systems going through these geometrical con-
figurations.
This paper is organized as follows: section 2
presents the state-of-the-art in viewpoint selection and
automatic tour creation. Section 3 proposes an analy-
sis of previous works in the context of molecular visu-
alization. Section 4 describes the automatic tour cre-
ation process. Finally, section 5 concludes and gives
some future work directions.
2 RELATED WORK
The search for informative viewpoints is closely re-
lated to perception. Many studies have concluded
that a meaningful viewpoint tries to display most of
an object to enable quick recognition (Blanz et al.,
1999). For data visualization, domain-specific fea-
tures are important to find and display as they can
help to understand a given scene. Animation tours
are also a powerful tool to improve comprehension,
especially for complex data as in medicine. (Preim
and Meuschke, 2022).
2.1 Viewpoint Selection
One of the first works to deal with viewpoint selec-
tion was by (Kamada and Kawai, 1988). They tried
to minimize the number of visible faces with par-
allel edges using an orthographic projection to help
object understanding. However, they did not aim to
find a “good” viewpoint, i.e., bringing interest to the
viewer. (Plemenos and Benayada, 1996) presented
metrics based on the projected area of an object to
try to capture viewpoints showing most of the objects.
Finding good points of view is related to the amount
of information they provide about the scene. As such,
(V
´
azquez et al., 2001) introduced a new metric based
on (Shannon, 1948)’s information theory: Viewpoint
entropy. Information theory has subsequently been
widely used to design new metrics. The surveys of
(Secord et al., 2011) and (Bonaventura et al., 2018)
present and evaluate most of them.
Recently, deep learning has been used to find
good viewpoints for general objects. (Schelling et al.,
2021) proposed a viewpoint selection method based
on learning previous metrics which is insensitive to
model resolution, faster to compute, and as reliable as
other state-of-the-art works. (Hartwig et al., 2022)
conducted a user study on 3220 models, enabling
them to present the first view quality metric solely
based on human preferences. They also showed that
their method performs better than previous works but
requires a huge dataset of manually selected good
viewpoints.
(a) (b)
Figure 2: (a) The alignment, where only the foreground is
visible. (b) Another viewpoint of the same molecule.
(a) (b)
Figure 3: (a) The tunnel, with a hole going through the
molecule. (b) Another viewpoint of the same molecule.
Viewpoint selection for molecular systems has not
received much attention despite its potentially useful
applications. (V
´
azquez et al., 2002) adapted View-
point entropy for molecular scenes. They try to find
viewpoints where there is an alignment between el-
ements of a molecule (figure 2a), or where most el-
ements can be seen (figure 2b). This process is
done using an orthographic camera, as usual in sci-
entific visualization, and a molecule with the Ball
& Stick representation. (Doulamis et al., 2010) ex-
tended V
´
azquez’s work by adding semantic informa-
tion to the molecules in order to select more rele-
vant and informative views. They created an online
platform for experts to visualize and select the best
Viewpoint Selection for Molecular Visualization: Analysis and Applications
59

views given by a non-linear classifier which was con-
tinuously trained from their input. (Heinrich et al.,
2016) adapted Viewpoint entropy to use some infor-
mation specific to the Cartoon representation. They
conducted a quantitative study with experts and non-
experts to determine what a good viewpoint is for
molecules. They concluded that both a viewpoint
showing most of the molecule (figure 3b) and a view-
point exposing a tunnel (figure 3a), where a hole go-
ing through the molecule can be seen, are important
for improved understanding.
In this paper, we extend the preliminary study of
(Larroque et al., 2023) by adapting and analyzing
most metrics from previous works applied to molec-
ular visualization. Our goal is to find which metrics
are interesting for tunnel and alignment detection and
also evaluate their ability to be used for molecular tour
creation.
2.2 Automatic Tour Creation
Creating a good camera tour around objects is tied to
the viewpoint selection process. (Barral et al., 2000)
created an iterative algorithm using metrics from (Ple-
menos and Benayada, 1996) to generate a path from
consecutive steps that are selected according to their
view quality. However, their method resulted in a
jerky movement. (Sokolov et al., 2006) improved this
process by adding inertia factors to the camera move-
ment to smooth out sharp turns. Later (Saleem et al.,
2007) presented a method that only uses some key
viewpoints to create a smooth tour of general objects
using cubic splines. (Secord et al., 2011) maximizes
the quality of a periodic orbit using the gradient of
metrics scores.
Viewpoint selection has also been used in other
works to create complete scene tours. (Sokolov and
Plemenos, 2008) compute some key viewpoints of a
scene that are linked together using scene topologi-
cal and semantic knowledge. (Xie et al., 2018) gen-
erate paths for quadrotor videography by chaining
local moves that are computed using saliency fields
on different landmarks and global moves between
them. Both works solve a Traveling Salesman Prob-
lem (TSP) to find the shortest path connecting key
viewpoints that were computed using viewpoint qual-
ity metrics.
For molecular visualization, (Kou
ˇ
ril et al., 2021)
presented an automatic documentary creation process
for huge scenes containing thousands of individual
molecules. Their method is based on a script that
can either be written by a user or generated using on-
line available information. They then create a tour
from the script that goes through key parts of the vi-
sualized system. Occlusion issues are solved by us-
ing culling planes, trading off contextual information
for easier navigation and visualization. The tour cre-
ation process was improved by (Alharbi et al., 2021)
as they proposed a method to navigate through empty
space when possible and hide unavoidable occluding
elements instead of using culling planes like Kou
ˇ
ril.
While these works provide good results for their use
case, they do not take viewpoint quality into account
and are not designed to handle unknown molecules.
We propose to improve (Larroque et al., 2023)
work on molecular tour creation by solving a TSP
over key viewpoints and focusing on the most impor-
tant areas, similar to (Saleem et al., 2007). Addition-
ally, we take some animation principles into account
to create both an informative and visually pleasing
tour.
3 METRICS ANALYSIS AND
EVALUATION
Viewpoints are selected using metrics that give a score
according to the information visible on a given im-
age. In this section, we analyze 20 state-of-the-art
metrics from previous works to evaluate their abil-
ity to identify two specific geometrical configurations
of molecules: alignments (figure 2) and tunnels (fig-
ure 3). These metrics are divided into five categories
defined in (Bonaventura et al., 2018) and (Secord
et al., 2011): Silhouette (section 3.2), Surface (sec-
tion 3.3), Depth (section 3.4), Stability (section 3.5),
and High-level (section 3.6). More details on each
studied metric are given in the appendixes A to E.
3.1 Analysis Introduction
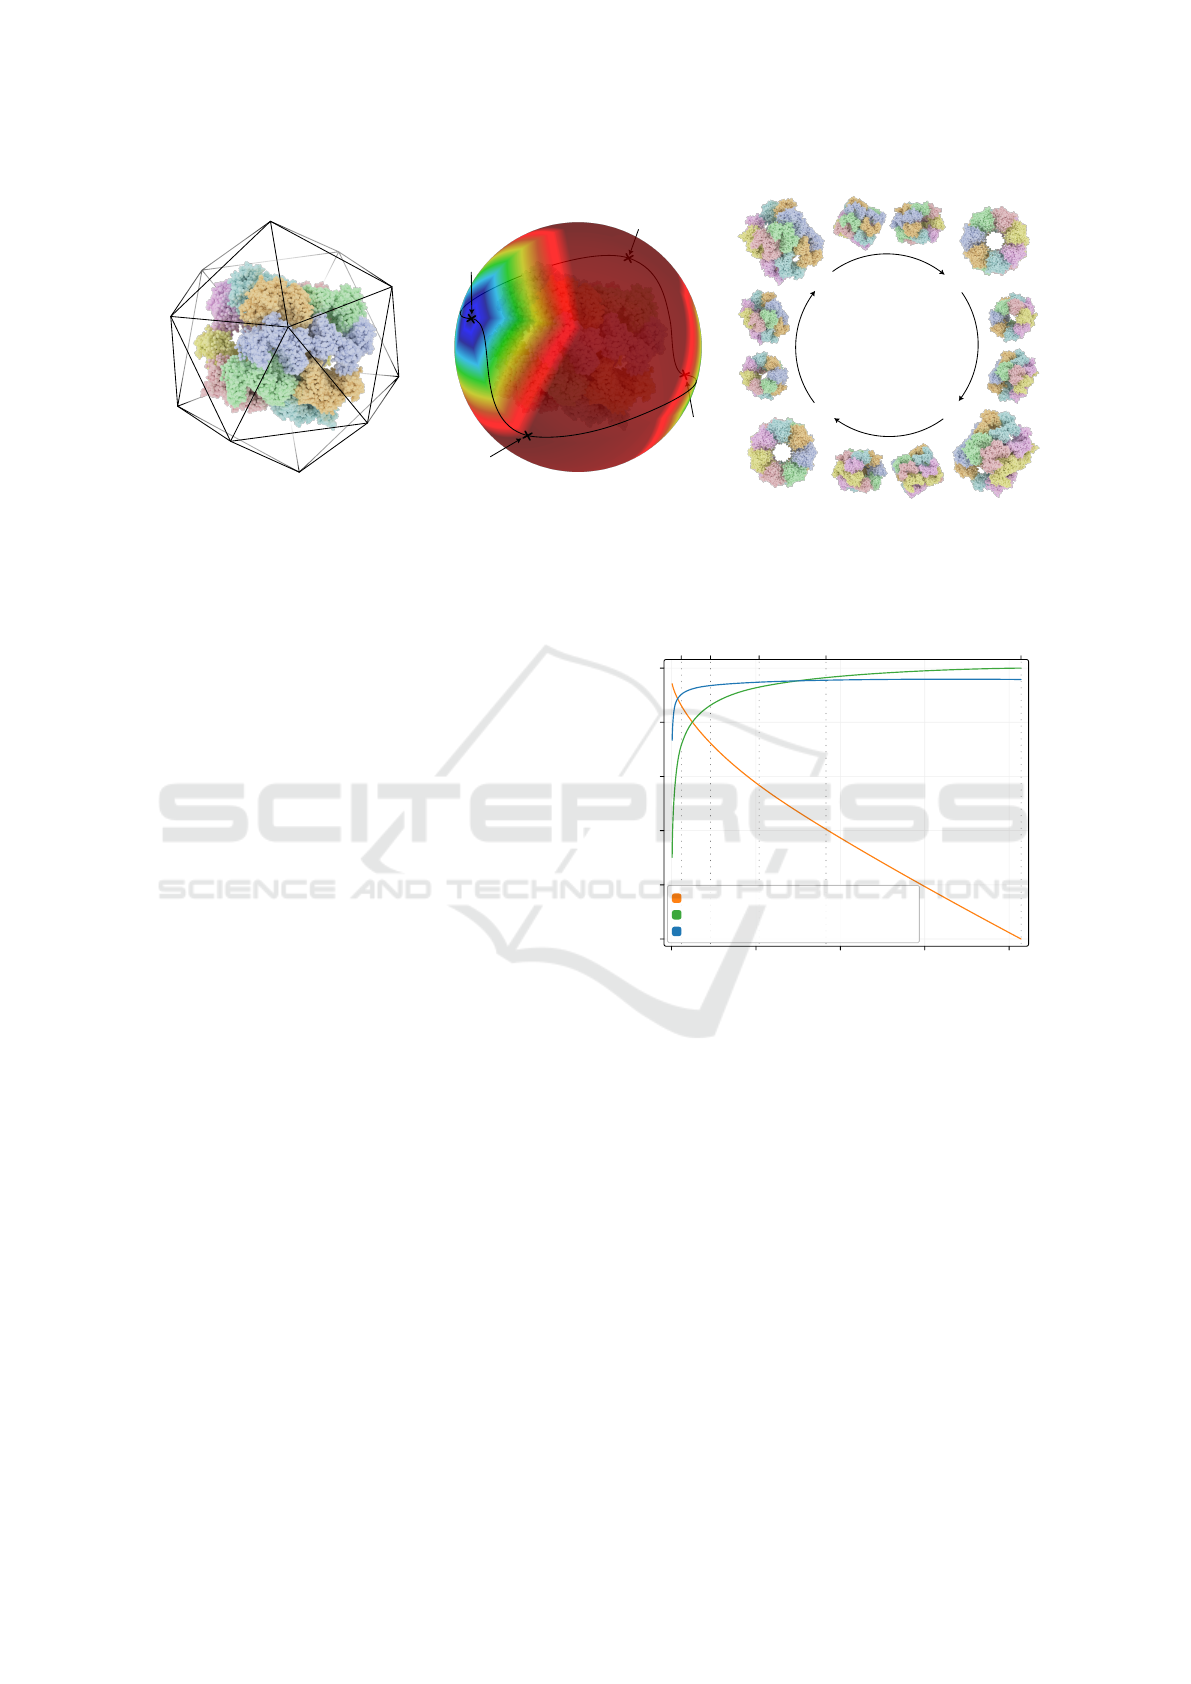
Process. Candidate viewpoints are sampled around
the molecule using a bounding icosahedron of 642
vertices as a trade-off between computation time
and covered space around the molecule (an example
icosahedron can be seen on figure 4a). Images used
to compute the metrics are rendered from each vertex
with an orthographic camera facing the center. The
viewport size is set to be able to fit the whole bound-
ing sphere of the molecule on the screen.
Image resolution has a strong impact on the
amount of visible information, and therefore on the
metrics score. Indeed, a lower image resolution leads
to more elements covering a single pixel. It is thus
important to determine the appropriate pixel count
and aspect ratio when trying to find the best view-
point. We evaluate three factors over several resolu-
tions using a common 16:9 aspect ratio. We choose
GRAPP 2024 - 19th International Conference on Computer Graphics Theory and Applications
60
.96
0.0
.99
.99
.98
.97
0.0
.93
.89
1.0
.98
(a)
→
3
2
4
1
(b)
→
1 2
3
4
(c)
Figure 4: Tour creation for a molecule: (a) the icosahedron used to sample viewpoints with computed scores; (b) the spherical
heatmap generated with scores from (a); (c) key (numbered) and intermediary viewpoints of the resulting video.
the 3840 × 2160 (2160p) resolution as a baseline for
comparisons, as it’s common for high-quality images.
The results can be seen in figure 5:
• Time gain vs 2160p is the relative rendering time,
compared to 2160p. The gain decreases almost
linearly with the resolution. This factor does not
take metrics computation into account.
• Avg. visible elements vs 2160p is the average
number of elements visible from all viewpoints,
compared to 2160p. A higher number of visible
elements per image means that metrics have more
information and provide more accurate results.
• Total visible elements % corresponds to the num-
ber of unique elements of the molecule seen at
least once. It tends to be stable after 720p.
Taking these elements into account, we choose to
render the scene with a 1280 × 720 (720p) image res-
olution, as the best trade-off between available infor-
mation and computing cost.
Evaluation. Each of the 20 studied metrics has
been tested from each viewpoint on the icosahedron
(figure 4a), using a dataset of 33 molecules for tun-
nels and 30 for alignments. The molecules PDB IDs
(Berman et al., 2000) are given in the appendix F. The
generated images were manually examined to deter-
mine if the geometrical configuration evaluated was
visible or not. We use the Ball & Stick representa-
tion to identify alignments as it helps to see repeating
patterns (V
´
azquez et al., 2002) and is thus suitable for
this feature. A viewpoint is considered valid if there is
an alignment between elements of the molecule (fig-
ure 2a). For the tunnel, we use the van der Waals rep-
resentation for its simplicity and ability to highlight
100%
2160p
1080p
360p
720p
1440p
80%
60%
40%
20%
0%
0
2 4
Pixel count (millions)
6 8
Time gain vs 2160p
Total visible elements %
Avg. visible elements vs 2160p
Figure 5: Analysis of different pixel counts for images ren-
dered with orthographic camera using a 16:9 aspect ratio.
it. A viewpoint with a tunnel is considered valid if it
is on the view axis such as on figure 3a.
To analyze the resulting data, we evaluate each
metric by measuring the following attributes:
• Accuracy: it gives the overall ability of a metric
to detect a given geometrical configuration either
on its highest or lowest scoring viewpoint.
• Consistency: the ability of a metric to reliably find
a given geometrical configuration exclusively on
its highest or lowest scoring viewpoint.
3.2 Silhouette Metrics
This category uses the silhouette of an object to
compute the score of a viewpoint and can be used
on molecules without changes, capturing its overall
Viewpoint Selection for Molecular Visualization: Analysis and Applications
61
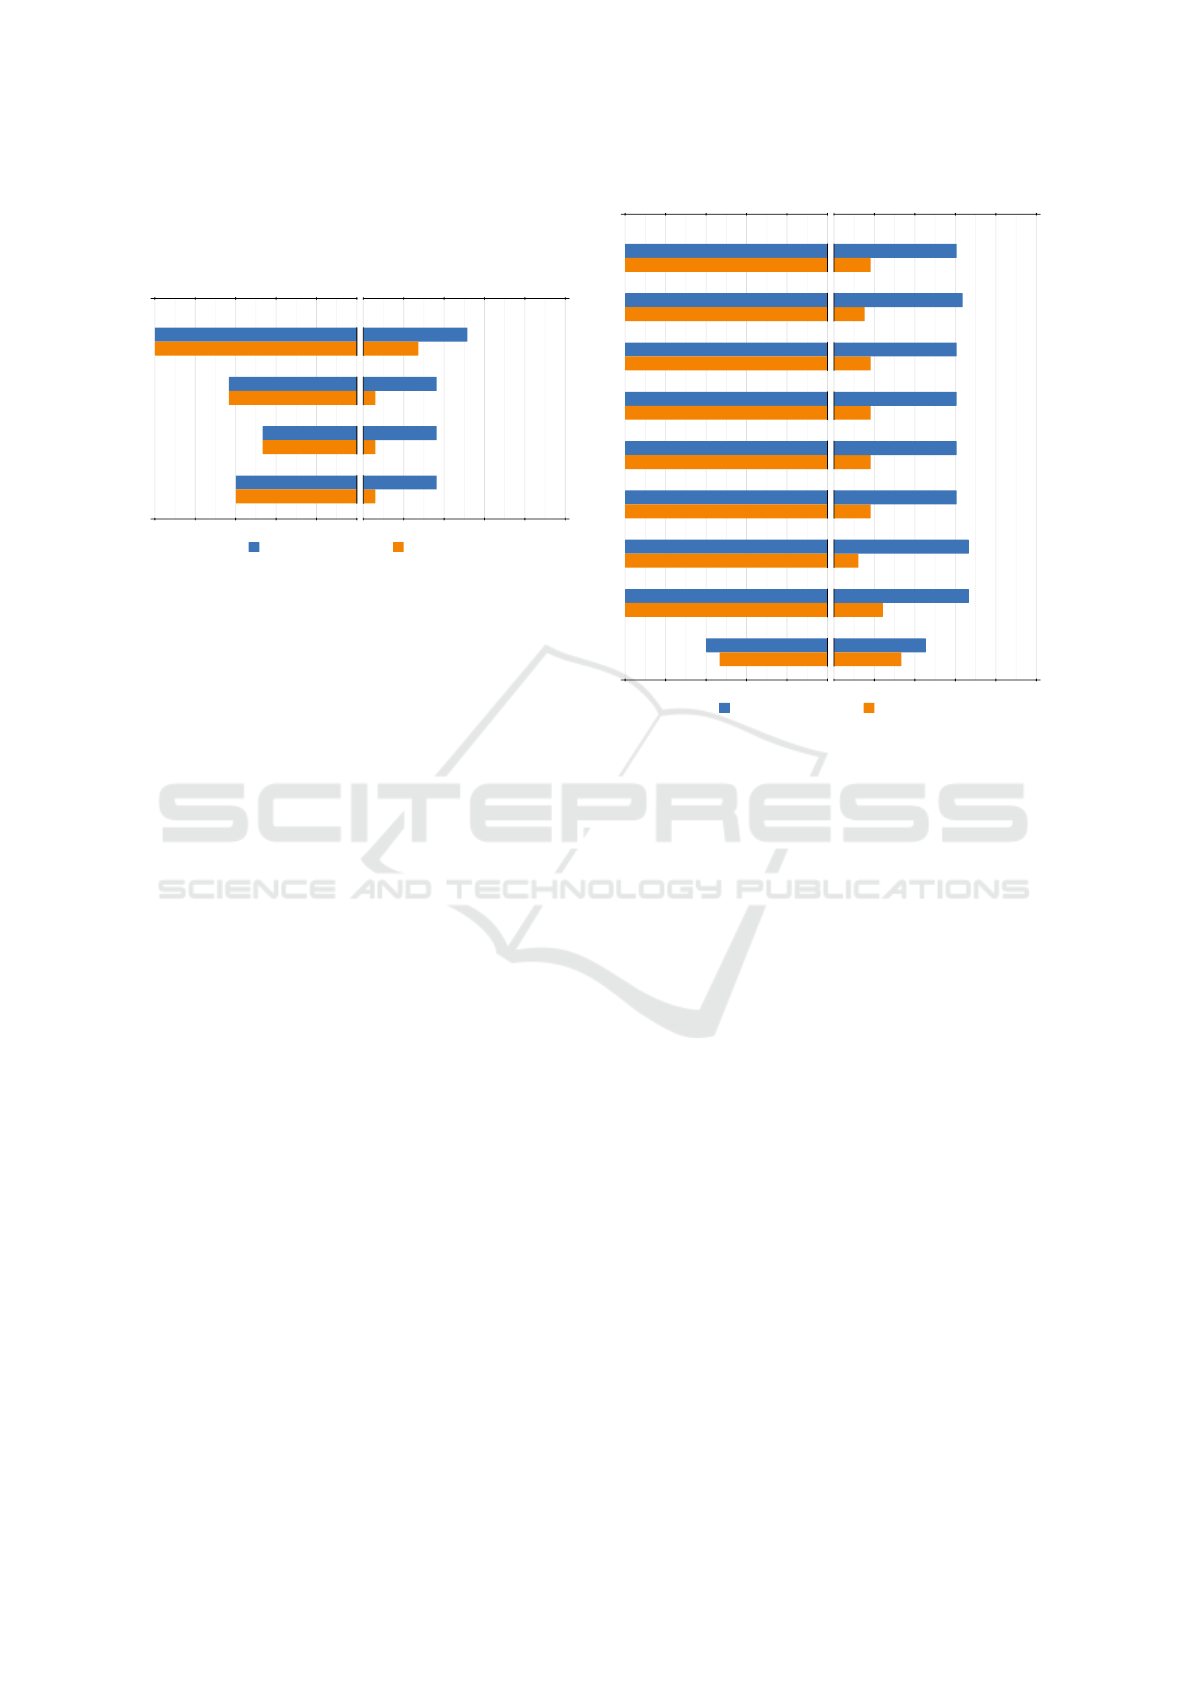
shape. Figure 6 gives the accuracy and consistency
for metrics in this category and their definition are
given in appendix A.
Silhouette length (Polonsky et al., 2005)
Silhouette entropy (Polonsky et al., 2005)
Silhouette curvature (Vieira et al., 2009)
Silhouette curvature extrema (Secord et al., 2011)
0.52
0.271.0
1.0
0.36
0.06
0.63
0.63
0.36
0.06
0.47
0.47
0.36
0.06
0.6
0.6
ConsistencyAccuracy
1.0 0.8 0.6 0.4 0.2 0.0 0.2 0.4 0.6 0.8 1.0
Alignment Tunnel
Figure 6: Results of accuracy and consistency for silhouette
metrics for both evaluated geometrical configurations.
Alignment. The only silhouette metric capable
of consistently finding the alignment is Silhouette
length. Strong alignment means fewer elements are
visible, and therefore the number of pixels making up
the silhouette is lower. The other metrics, which rely
on the turning angles between consecutive pixels, are
not accurate or consistent. This is because, as atoms
are spheres, a lot of curves are added to the silhouette
making them unable to capture the external shape.
Tunnel. Silhouette length performs better than the
others because the tunnel opening adds a big hole to
the silhouette. Thus, the number of pixels increases,
and the highest-scoring viewpoints correspond to vis-
ible tunnels. However, depending on the molecule
shape, nothing guarantees that the longest silhouette
is on the tunnel side. The other metrics perform worst
for the same reason as the alignment: the silhouette
does not capture the external shape of the molecule.
3.3 Surface Metrics
Metrics in this category initially used the surface of
the triangles in screen space to compute a score for
an object. For molecules, the projected surface of the
elements (atoms and bonds) is used. The accuracy
and consistency for metrics in this category are found
in figure 7 and they are defined in appendix B.
Alignment. Surface metrics can constantly find the
alignment. Indeed, using an orthographic camera, the
viewpoint with the alignment results in the smallest
projected surface (figure 2a). The exception is Infor-
mation I
3
which does not perform well because it tries
# of visible elements (Plemenos and Benayada, 1996)
Projected area (Plemenos and Benayada, 1996)
Plemenos and Benayada (Plemenos and Benayada, 1996)
Visibility ratio (Plemenos and Benayada, 1996)
Viewpoint entropy (V
´
azquez et al., 2002)
Kullback-Leibler distance (Sbert et al., 2005)
Viewpoint mututal information (Feixas et al., 2009)
Information I
2
(Bonaventura et al., 2011)
Information I
3
(Bonaventura et al., 2011)
0.61
0.181.0
1.0
0.64
0.15
1.0
1.0
0.61
0.18
1.0
1.0
0.61
0.18
1.0
1.0
0.61
0.18
1.0
1.0
0.61
0.181.0
1.0
0.67
0.12
1.0
1.0
0.67
0.24
1.0
1.0
0.45
0.33
0.6
0.53
ConsistencyAccuracy
1.0 0.8 0.6 0.4 0.2 0.0 0.2 0.4 0.6 0.8 1.0
Alignment Tunnel
Figure 7: Results of accuracy and consistency for surface
metrics for both evaluated geometrical configurations.
to capture viewpoints where elements are the most in-
formative (i.e., visible on many viewpoints). How-
ever, with Ball & Stick a lot of elements could be vis-
ible from many points of view.
Tunnel. Most metrics have slightly above average
accuracy but bad consistency. Indeed, they are de-
signed to identify viewpoints showing a lot of ele-
ments or with a high projected surface. This makes
them unable to generalize around tunnels, which can
be anywhere in a molecule and not only on the re-
stricted cases of surface metrics.
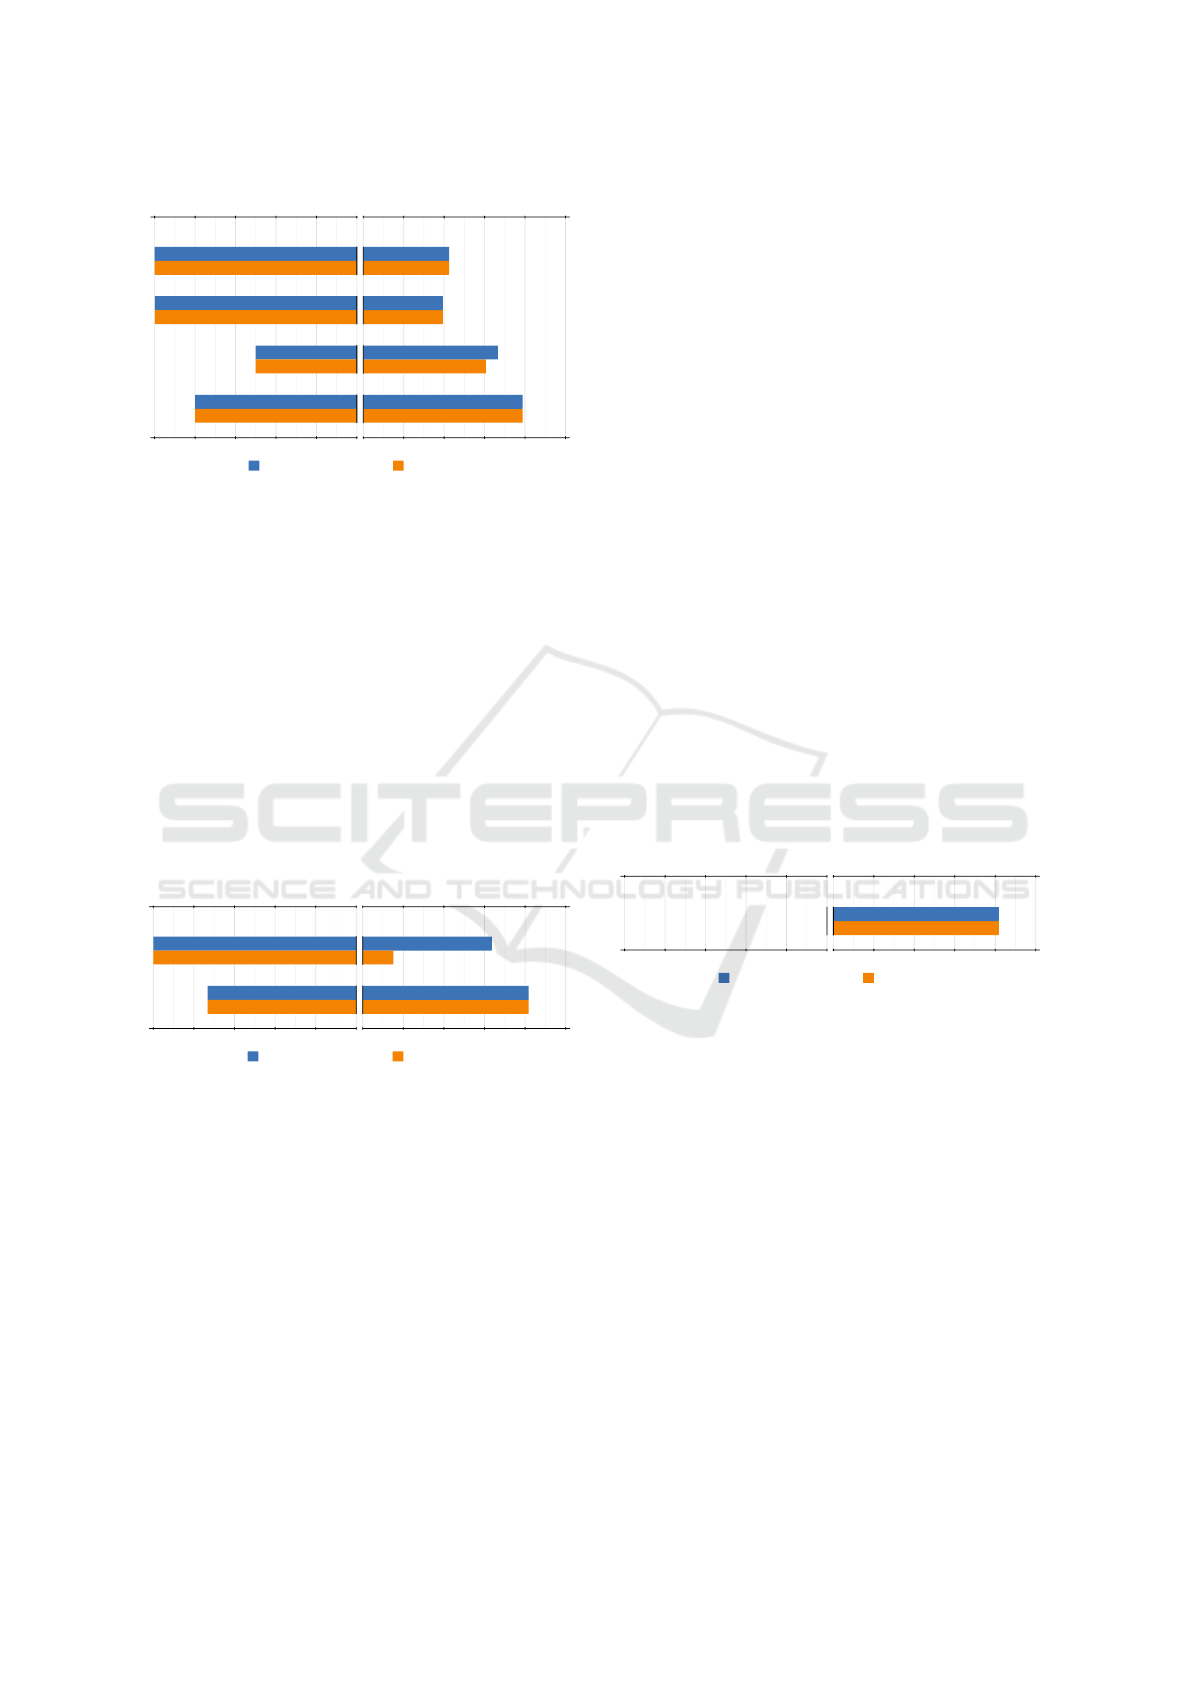
3.4 Depth Metrics
Depth metrics use the depth map of the image to char-
acterize the surface layout of the molecule. The re-
sults for metrics in this category can be found in fig-
ure 8 and their definitions are given in appendix C.
Alignment. Maximum depth performs perfectly for
alignment because the farthest elements are hidden
when a molecule is aligned. Stoev and Straßer has the
same results because it uses maximum depth and the
projected surface. The two other metrics of this cat-
egory use entropy to analyze the overall depth range.
They give the worst results because alignment does
not have a significant impact on entropy.
GRAPP 2024 - 19th International Conference on Computer Graphics Theory and Applications
62
Maximum depth (Secord et al., 2011)
Stoev and Straßer (Stoev and Straßer, 2002)
Depth distribution (Secord et al., 2011)
Depth entropy (Marsaglia et al., 2021)
0.42
0.421.0
1.0
0.39
0.39
1.0
1.0
0.67
0.61
0.5
0.5
0.79
0.79
0.8
0.8
ConsistencyAccuracy
1.0 0.8 0.6 0.4 0.2 0.0 0.2 0.4 0.6 0.8 1.0
Alignment Tunnel
Figure 8: Results of accuracy and consistency for depth
metrics for both evaluated geometrical configurations.
Tunnel. As Maximum depth and Stoev and Straßer
seek the maximum depth in an image, they only allow
finding a tunnel when it is perfectly on the view axis.
Depth distribution and Depth entropy work better as
they analyze the depth: when a tunnel is found the
range of values is balanced, making both metrics have
their lowest score.
3.5 Stability Metrics
Stability metrics compare a viewpoint to the others to
return a score based on their differences. The accu-
racy and consistency are found in figure 9 and the two
definitions are given in appendix D.
Instability (Feixas et al., 2009)
Depth-based visual stability (V
´
azquez, 2009)
0.64
0.141.0
1.0
0.82
0.82
0.73
0.73
ConsistencyAccuracy
1.0 0.8 0.6 0.4 0.2 0.0 0.2 0.4 0.6 0.8 1.0
Alignment Tunnel
Figure 9: Results of accuracy and consistency for stability
metrics for both evaluated geometrical configurations.
Alignment. An aligned viewpoint is unstable by na-
ture: a small change in camera orientation leads to a
big change on the screen. Instability thus provides
perfect results in this case. Depth-based visual sta-
bility is not as efficient because, similarly to Depth
entropy (section 3.4), it computes scores based on an
analysis of the overall depth range, so alignment does
not have much effect.
Tunnel. Instability is not consistent in this case. For
instance, when molecules have short tunnels (as in
a torus shape), most of the same elements are visi-
ble from everywhere. Longer tunnels are, however,
unstable because the neighbors will reveal hidden
elements in the tunnel interior by moving off axis.
Depth-based visual stability shares the strengths of
depth metrics (i.e., an analysis of the full range of
depth values) and compares a viewpoint to the oth-
ers so it is more accurate and consistent than other
comparable metrics.
3.6 High-Level Metrics
Based on the works of (Trellet et al., 2015) we intro-
duce a new metric: Largest cone of view. Like the
authors, we convert the atom’s positions from Carte-
sian coordinates to spherical ones, ignoring the ra-
dial distance. Finally, we compute the Vorono
¨
ı dia-
gram of these points, giving us the set of circumcir-
cles. Originally, the authors positioned the camera in
the center of the biggest circumcircle to display the
tunnel. However, viewpoint selection metrics in this
study are defined as functions that return a score for
any viewpoint. This is why we propose the formula
in appendix E, which shows tunnels on its highest
score. The accuracy and consistency for this metric
are found in figure 10.
As this metric is conceived around tunnel detec-
tion, it has the worst performance for alignment, be-
ing unable to find any. For the tunnel, it reliably finds
this configuration about 80% of the time.
Largest cone of view (Trellet et al., 2015)
0.82
0.82
0.0
0.0
ConsistencyAccuracy
1.0 0.8 0.6 0.4 0.2 0.0 0.2 0.4 0.6 0.8 1.0
Alignment Tunnel
Figure 10: Results of accuracy and consistency for high-
level metrics for both evaluated geometrical configurations.
3.7 Conclusion
For alignment, most metrics have perfect accuracy
and consistency and can be used to search for this fea-
ture. Among them, silhouette, surface and depth met-
rics are cheap to compute because they only need to
apply a formula for each pixel. In contrast, Instability
is more costly because it requires comparing view-
points between them.
In the case of tunnels, three metrics have both ac-
curacy and consistency of about 80%. Largest cone of
view is quite expensive as it needs to compute Vorono
¨
ı
diagrams. Depth-based visual stability is even more
costly as it requires compressing hundreds of depth
images to compute a score. Thus, Depth entropy is
considered the best metric to find tunnels.
Viewpoint Selection for Molecular Visualization: Analysis and Applications
63

This study also reveals that there are no metrics
able to reliably provide perfect results for both align-
ment and tunnel detection. Such metric would be in-
teresting when analyzing unknown molecules. Depth
entropy is currently the closest to achieving this goal
with around 80% consistency for both configurations.
Computing metrics for each candidate viewpoint
can be used to create a heatmap of interesting zones
around molecules (figure 4b). It could be used as a
non-intrusive way to guide the gaze of users when
they analyze molecules, helping their studies.
4 MOLECULAR TOUR
In this section, we present how we can use the re-
sults of the best viewpoint selection process to create
molecular tours.
4.1 Path Creation
To create the tour, we compute a path going through
the most meaningful viewpoints around a molecule.
We start with a set C , composed of viewpoint candi-
dates sampled around the molecule using the icosahe-
dron (figure 4a). The tour path is created following
these steps:
1. We normalize the score values in C .
2. We arbitrarily select the 20% lowest and highest
scoring candidates (according to the used metric).
3. We iteratively select key viewpoints by spreading
candidates by a φ angle in ascending or descend-
ing scores, depending on the case.
Algorithm 1 gives more details for the selection of
the highest score viewpoints. This algorithm is also
used for lowest score viewpoints by considering can-
didates with a score inferior to 0.2 and sorting them
in ascending order.
Finally, to find the shortest loop around the
molecule, we solve a TSP on the combined key can-
didate viewpoints to find the best connection between
them. An example of connected key viewpoints for a
molecule can be seen in figure 4b.
4.2 Animation
To create an informative and pleasing animation of
the computed path, we use some principles described
in the analysis of (Lasseter, 1987):
1. Slow in and out: the camera speed is animated
such as it accelerates and decelerates when going
from one point to another.
Data: Candidates set C
Result: Key candidates set K
C ← {∀c ∈ C | score(c) > 0.8};
Sort candidates set C by descending scores;
// Add highest score candidate as key.
K ← {C [0]};
C ← C \ {C [0]};
foreach c ∈ C do
valid ← true;
/* Checks if c is properly spaced
against key viewpoints. */
foreach k ∈ K do
/* Angle between c and k relative
to the icosahedron center. */
if angleBetween(c, k) < φ then
// Remove from candidates.
C ← C \ {c};
valid ← false;
break;
end
end
if valid then
// Add as key.
K ← K ∪ {c};
C ← C \ {c};
end
end
Algorithm 1: Key candidate viewpoint selection for highest
scores (> 0.8).
1. Staging: using a non-linear slow in and out,
we can fly more quickly over uninteresting areas
while slowing down to a stop at key viewpoints.
This makes the viewer implicitly informed about
what parts of the tour are more important.
2. Arcs: by running the animation on the bounding
sphere, the trajectory is naturally an arc. Also, we
get a smooth trajectory by using a Catmull-Rom
(Catmull and Rom, 1974) spline to connect the
key viewpoints.
Finally, according to (Sokolov and Plemenos, 2008),
the animation should not be very long. Our tour dura-
tion can be fully configured according to preferences
or applications by adjusting the camera speed.
4.3 Results
For this paper, we set φ = 100 in algorithm 1 to get
at most three viewpoints for high and three for low
scores, resulting in at most six key viewpoints. Fi-
nally, we set the camera speed to get an animation of
about 50 seconds.
Our analysis (section 3) shows that several metrics
have perfect results for finding alignments. However,
GRAPP 2024 - 19th International Conference on Computer Graphics Theory and Applications
64

to create tours, it is also important to have viewpoints
that display most elements of a molecule. For this
reason, metrics like Maximum depth are not adapted.
For the tunnel, two of the three best metrics are
computationally expensive without giving much bet-
ter results. We thus choose Depth entropy to create
molecular tours of this feature.
Figure 4c shows several frames extracted from a
molecular tour. The tour goes through key viewpoints
that either show the tunnel or most elements of the
molecule. Additionally, we provide videos of tours
for the two geometrical configurations studied (i.e.,
tunnel and alignment) in supplemental materials.
5 CONCLUSION AND FUTURE
WORKS
This article proposes an analysis of general state-of-
the-art viewpoint selection methods applied to molec-
ular visualization. Metrics from these works are ana-
lyzed on their ability to consistently find the tunnel or
alignment geometrical configurations of molecules.
This study reveals that for the alignment, most sur-
face metrics can be used as they are perfectly accu-
rate and consistent. For the tunnel, Depth entropy is
the best trade-off between computation time and the
ability to consistently show the tunnel. Finally, our
study reveals that there is no existing metric capable
of identifying both configurations reliably.
We also propose a simple method to create tours
of interesting points around the molecules. With care-
ful selection of candidate viewpoints, and by using
splines to obtain a smooth path we can create an infor-
mative and visually pleasing tour respecting some im-
portant animation principles. These molecular tours
can help users identify key areas and improve their
understanding of such complex objects.
An interesting future work could focus on creat-
ing specific metrics to detect other important features
of molecules, geometrical or not. Combining metrics
and studying their behavior for molecular visualiza-
tion could also be valuable. According to the appli-
cation, a user study may be necessary to assess the
relevance of the designed metric. Finally, our tour
only shows the exterior of the molecule. Creating a
view quality-based tour for the whole molecular sys-
tem would help to understand the visualized scene
better.
ACKNOWLEDGMENTS
Vincent Larroque is supported by institutional grants
from the National Research Agency under the Invest-
ments for the future program with the reference ANR-
18-EURE-0017 TACTIC and a fellowship from Qubit
Pharmaceuticals. Matthieu Montes is supported by
the European Research Council Executive Agency
under grant numbers 640283 and 101069190.
REFERENCES
Alharbi, R., Strnad, O., Luidolt, L. R., Waldner, M.,
Kou
ˇ
ril, D., Bohak, C., Klein, T., Gr
¨
oller, E., and Vi-
ola, I. (2021). Nanotilus: Generator of Immersive
Guided-Tours in Crowded 3D Environments. IEEE
Transactions on Visualization and Computer Graph-
ics, 29(3):1860–1875.
Barral, P., Dorme, G., and Plemenos, D. (2000). Scene un-
derstanding techniques using a virtual camera. In Eu-
rographics 2000 - Short Presentations. Eurographics
Association.
Berman, H. M., Westbrook, J., Feng, Z., Gilliland, G., Bhat,
T. N., Weissig, H., Shindyalov, I. N., and Bourne, P. E.
(2000). The Protein Data Bank. Nucleic Acids Re-
search, 28(1):235–242.
Blanz, V., Tarr, M. J., and B
¨
ulthoff, H. H. (1999). What
Object Attributes Determine Canonical Views? Per-
ception, 28(5):575–599.
Bonaventura, X., Feixas, M., and Sbert, M. (2011). View-
point Information. 21st International Conference on
Computer Graphics and Vision, GraphiCon’2011 -
Conference Proceedings.
Bonaventura, X., Feixas, M., Sbert, M., Chuang, L., and
Wallraven, C. (2018). A Survey of Viewpoint Se-
lection Methods for Polygonal Models. Entropy,
20(5):370.
Catmull, E. and Rom, R. (1974). A Class of Local In-
terpolating Splines. In Barnhill, R. E. and Riesen-
feld, R. F., editors, Computer Aided Geometric De-
sign, pages 317–326. Academic Press.
Doulamis, N., Chronis, E., Doulamis, A., Miaoulis, G.,
and Plemenos, D. (2010). Incorporating Viewpoint
Entropy into the S-PDB viewer for Selecting Opti-
mal 3D object Views. International Conference on
Computer Graphics and Artificial Intelligence (3ia),
Athens, Greece.
Feixas, M., Sbert, M., and Gonz
´
alez, F. (2009). A Uni-
fied Information-Theoretic Framework for Viewpoint
Selection and Mesh Saliency. ACM Transactions on
Applied Perception, 6(1).
Hartwig, S., Schelling, M., v. Onzenoodt, C., V
´
azquez, P.-
P., Hermosilla, P., and Ropinski, T. (2022). Learning
Human Viewpoint Preferences from Sparsely Anno-
tated Models. Computer Graphics Forum, 41(6):453–
466.
Heinrich, J., Vuong, J., Hammang, C. J., Wu, A., Ritten-
bruch, M., Hogan, J., Brereton, M., and O’Donoghue,
Viewpoint Selection for Molecular Visualization: Analysis and Applications
65

S. I. (2016). Evaluating Viewpoint Entropy for Rib-
bon Representation of Protein Structure. Computer
Graphics Forum, 35(3):181–190.
Kamada, T. and Kawai, S. (1988). A simple method
for computing general position in displaying three-
dimensional objects. Computer Vision, Graphics, and
Image Processing, 41(1):43–56.
Kou
ˇ
ril, D., Strnad, O., Mindek, P., Halladjian, S., Isenberg,
T., Gr
¨
oller, M. E., and Viola, I. (2021). Molecumen-
tary: Scalable Narrated Documentaries Using Molec-
ular Visualization. IEEE Transactions on Visualiza-
tion and Computer Graphics, pages 1–1.
Kozl
´
ıkov
´
a, B., Krone, M., Falk, M., Lindow, N., Baaden,
M., Baum, D., Viola, I., Parulek, J., and Hege, H.-
C. (2017). Visualization of Biomolecular Structures:
State of the Art Revisited. Computer Graphics Forum,
36(8):178–204.
Larroque, V., Maria, M., M
´
erillou, S., and Montes, M.
(2023). Automatic Molecular Tour Creation: A Study.
In Singh, G. and Chu, M. R., editors, Eurographics
2023 - Posters. The Eurographics Association.
Lasseter, J. (1987). Principles of traditional animation ap-
plied to 3D computer animation. In Proceedings of
the 14th Annual Conference on Computer Graphics
and Interactive Techniques, SIGGRAPH ’87, pages
35–44, New York, NY, USA. Association for Com-
puting Machinery.
Marsaglia, N., Kawakami, Y., Schwartz, S. D., Fields, S.,
and Childs, H. (2021). An Entropy-Based Approach
for Identifying User-Preferred Camera Positions. In
2021 IEEE 11th Symposium on Large Data Analysis
and Visualization (LDAV), pages 73–83.
Olson, A. J. (2018). Perspectives on Structural Molecular
Biology Visualization: From Past to Present. Journal
of Molecular Biology, 430(21):3997–4012.
Plemenos, D. and Benayada, M. (1996). Intelligent Display
in Scene Modeling. New Techniques to Automatically
Compute Good Views. In In Proceedings of the Inter-
national Conference GraphiCon’96, St Petersbourg,
Russia.
Polonsky, O., Patan
´
e, G., Biasotti, S., Gotsman, C., and
Spagnuolo, M. (2005). What’s in an image? The
Visual Computer, 21(8):840–847.
Preim, B. and Meuschke, M. (2022). A survey of medical
animations. Computers & Graphics, 107:304–328.
Saleem, W., Song, W., Belyaev, A., and Seidel, H.-P.
(2007). On computing best fly. In Proceedings of
the 23rd Spring Conference on Computer Graphics,
SCCG ’07, pages 115–121, New York, NY, USA. As-
sociation for Computing Machinery.
Sbert, M., Plemenos, D., Feixas, M., and Gonz
´
alez, F.
(2005). Viewpoint quality: Measures and appli-
cations. In Proceedings of the First Eurographics
Conference on Computational Aesthetics in Graph-
ics, Visualization and Imaging, Computational Aes-
thetics’05, pages 185–192, Goslar, DEU. Eurograph-
ics Association.
Schelling, M., Hermosilla, P., V
´
azquez, P.-P., and Ropinski,
T. (2021). Enabling Viewpoint Learning through Dy-
namic Label Generation. Computer Graphics Forum,
40(2):413–423.
Secord, A., Lu, J., Finkelstein, A., Singh, M., and Nealen,
A. (2011). Perceptual Models of Viewpoint Prefer-
ence. ACM Transactions on Graphics, 30(5):1–12.
Shannon, C. E. (1948). A mathematical theory of communi-
cation. The Bell System Technical Journal, 27(3):379–
423.
Sokolov, D. and Plemenos, D. (2008). Virtual world explo-
rations by using topological and semantic knowledge.
The Visual Computer, 24(3):173–185.
Sokolov, D., Plemenos, D., and Tamine, K. (2006). Meth-
ods and data structures for virtual world exploration.
The Visual Computer, 22(7):506–516.
Stoev, S. and Straßer, W. (2002). A case study on automatic
camera placement and motion for visualizing histor-
ical data. In IEEE Visualization, 2002. VIS 2002.,
pages 545–548.
Trellet, M., Ferey, N., Baaden, M., and Bourdot, P. (2015).
Content and task based navigation for structural bi-
ology in 3D environments. In 2015 IEEE 1st Interna-
tional Workshop on Virtual and Augmented Reality for
Molecular Science (VARMS@IEEEVR), pages 31–36.
V
´
azquez, P.-P. (2009). Automatic view selection through
depth-based view stability analysis. The Visual Com-
puter, 25(5):441–449.
V
´
azquez, P.-P., Feixas, M., Sbert, M., and Heidrich, W.
(2001). Viewpoint Selection Using Viewpoint En-
tropy: Automatic View Selection. In Proceedings
of the Vision Modeling and Visualization Conference
2001, volume 22 of VMV ’01, pages 273–280. Aka
GmbH.
V
´
azquez, P.-P., Feixas, M., Sbert, M., and Llobet, A. (2002).
Viewpoint entropy: A new tool for obtaining good
views of molecules. In Proceedings of the Symposium
on Data Visualisation 2002, VISSYM ’02, pages 183–
188, Goslar, DEU. Eurographics Association.
Vieira, T., Bordignon, A., Peixoto, A., Tavares, G., Lopes,
H., Velho, L., and Lewiner, T. (2009). Learning good
views through intelligent galleries. Computer Graph-
ics Forum, 28(2):717–726.
Xie, K., Yang, H., Huang, S., Lischinski, D., Christie,
M., Xu, K., Gong, M., Cohen-Or, D., and Huang,
H. (2018). Creating and chaining camera moves for
quadrotor videography. ACM Transactions on Graph-
ics, 37(4):88:1–88:13.
GRAPP 2024 - 19th International Conference on Computer Graphics Theory and Applications
66

APPENDIX
Table A1 gives the symbols used to define the metrics
presented in sections A to E.
Table A1: Common symbols for presented metrics.
Notation Description
VQ
n
(v) Viewpoint quality (of
viewpoint) v
v a viewpoint
V the set of viewpoints
c a turning angle of the sil-
houette
C
v
the set of turning angles of
the silhouette seen from v
N
c
the size of C
v
e an element (atom or bond)
E a set of elements
a
e
(v) projected surface of e on v
a
t
(v) projected surface of the vi-
sualized molecule on v
A
e
(v) real surface of element e
A
t
(v)
real surface of the visual-
ized molecule
p(e|v) =
a
e
(v)
a
t
(v)
probability of a element e
to appear on v
p(e) =
∑
v∈V
p(v)p(e| v) probability of element e
p(v) =
a
t
(v)
∑
v∈V
a
t
(v)
probability of viewpoint v
D
v
the set of depth seen from
viewpoint v
A Silhouette Metrics
Some metrics of this category use symbols defined in
table A1.
Silhouette Length. (Polonsky et al., 2005)
VQ
1
(v) = slength(v)
With slength(v) the number of pixels of the silhouette
of the molecule seen from v.
Silhouette Entropy. (Polonsky et al., 2005)
VQ
2
(v) = −
∑
α∈A
c
h(α)logh(α)
With A
c
the classes from the turning angle histogram
h. At its maximum, this metric captures a highly
curved silhouette.
Silhouette Curvature. (Vieira et al., 2009)
VQ
3
(v) =
∑
c∈C
v
|c|
π
2
N
c
This metric is maximized when the silhouette is
highly curved and minimized with a flat silhouette.
Silhouette Curvature Extrema. (Secord et al.,
2011)
VQ
4
(v) =
∑
c∈C
v
|c|
π
2
2
N
c
This metric amplifies curved silhouettes even more
than Silhouette curvature because of the squared fac-
tor.
B Surface Metrics
Most surface metrics use the common symbols in ta-
ble A1.
# of Visible Elements. (Plemenos and Benayada,
1996)
VQ
5
(v) =
∑
e∈E
vis
e
(v)
With vis
e
(v) = 1 if e is visible from v else 0. Corre-
sponds to the total number of atoms or bonds visible
from v.
Projected Surface. (Plemenos and Benayada,
1996)
VQ
6
(v) = a
t
(v)
The projected surface of the visualized molecule on
viewpoint v.
Plemenos and Benayada. (Plemenos and Be-
nayada, 1996)
VQ
7
(v) =
VQ
5
(v)
N
e
+
VQ
6
(v)
R
With N
e
the total number of elements and R the total
number of pixels of the input image. This metric is
the combination of ratios of visible elements and total
projected surface.
Visibility Ratio. (Plemenos and Benayada, 1996)
VQ
8
(v) =
∑
e∈E
vis
e
(v)A
e
A
t
The ratio of the real area of visible elements and the
total real surface of the molecule.
Viewpoint Selection for Molecular Visualization: Analysis and Applications
67

Viewpoint Entropy. (V
´
azquez et al., 2002)
VQ
9
(v) = −
∑
e∈E
p(e|v)log p(e| v)
The entropy of probabilities that an element is visible
on viewpoint v. Most entropy-based metrics are sen-
sitive to the number of elements that are visible from
the evaluated viewpoint. This is because when there
are a lot of smaller elements on an image their proba-
bilities to appear on v decreases.
Kullback-Leibler Distance. (Sbert et al., 2005)
VQ
10
(v) =
∑
e∈E
p(e|v)log
p(e|v)
A
e
A
t
The Kullback-Leibler divergence between the visible
surface and the real surface of elements visible from
v.
Viewpoint Mutual Information. (Feixas et al.,
2009)
VQ
11
(v) =
∑
e∈E
p(e|v)log
p(e|v)
p(e)
This metric seeks to expose viewpoints where ele-
ments are exclusive to it on its high scores. On low
scores, it gives viewpoints with elements representa-
tive of the observed molecule.
Information I
2
. (Bonaventura et al., 2011)
VQ
12
(v) = −
∑
e∈E
p(e)log p(e) −VQ
9
(v)
This metric compares the entropy of all elements of
the molecule and the entropy of the current viewpoint.
Because the information of all elements is constant
for a given molecule, this metric depends on View-
point entropy. Both metrics have the same general
behavior but Information I
2
is more stable when visu-
alizing more elements.
Information I
3
. (Bonaventura et al., 2011)
VQ
13
(v) =
∑
e∈E
p(e|v)I
2
(V ; e)
I
2
(V ; e) = −
∑
v∈V
p(v)log p(v) +
∑
v∈V
p(v|e)log p(v| e)
With p(v | e) =
p(v)p(e|v)
p(e)
. When maximized, this met-
ric shows the maximum number of most informative
elements which are elements that can be seen from
many viewpoints.
C Depth Metrics
Some depth metrics use symbols defined in table A1.
Maximum Depth. (Secord et al., 2011)
VQ
14
(v) = max
d ∈D
v
d
The maximum depth value from a viewpoint v.
Stoev and Straßer. (Stoev and Straßer, 2002)
VQ
15
(v) = α p(v) + β d(v) + γ(1 − |d(v) − p(v)|)
With p(v) the normalized projected surface and d(v)
the maximum normalized depth from v. The authors
recommend α = β = γ =
1
3
for general purposes.
Depth Distribution. (Secord et al., 2011)
VQ
16
(v) = 1 −
∑
d ∈D
c
h(d)
2
With D
c
the classes from the depth histogram h. This
metric has a viewpoint with a big range of depth vis-
ible on its high score and a viewpoint with balanced
depth values on low scores.
Depth Entropy. (Marsaglia et al., 2021)
VQ
17
(v) = −
∑
d ∈D
v
p(d) log p(d)
With p(d) the probability of depth d. It has the same
behavior as Depth distribution.
D Stability Metrics
Instability. (Feixas et al., 2009)
VQ
18
(v) =
1
N
v
N
v
∑
j = 1
JS(w
i
, w
j
; p(E|v), p(E|v
j
))
w
i
=
p(v)
p(v) + p(v
j
)
w
j
=
p(v
j
)
p(v) + p(v
j
)
With JS the Jensen-Shannon divergence, N
v
is the
number of neighboring viewpoints of v and p(E|v)
the probabilities of all elements E on v. This metric
measures the distance of the distribution of elements
between v
i
and v
j
. Instability shows a viewpoint with
the most similar neighbors when minimized.
GRAPP 2024 - 19th International Conference on Computer Graphics Theory and Applications
68

Depth-Based Visual Stability. (V
´
azquez, 2009)
VQ
19
(v) =
1
#V
∑
v
j
∈V \{v}
NCD(v, v
j
)
NCD(v
i
, v
j
) =
L(v
i
v
j
) − min{L(v
i
), L(v
j
)}
max{L(v
i
), L(v
j
)}
With NCD the normalized compression distance, #V
the number of viewpoints, L(v) the size of the com-
pressed image of viewpoint v, v
i
v
j
the concatenated
image of viewpoint v
i
and v
j
. We observed that us-
ing threshold values as (V
´
azquez, 2009) recommends
to compute the number of similar viewpoints leads to
many viewpoints with the same score for molecules.
This is why we instead opted to use the mean of the
NCDs to avoid this issue. Viewpoints with a lot of
similar viewpoints have higher scores.
E High-Level Metrics
Largest Cone of View.
VQ
20
(v) = max
c∈C
(r
c
− ||pos
c
− pos
v
||)
With r
c
and pos
c
respectively, the radius and cen-
ter of circumcircle c from the circumcircle set C and
pos
v
the position of viewpoint v. This formulation,
inspired by (Trellet et al., 2015), gives higher scores
to viewpoints close to large cones of view.
F Molecular Dataset
The table A2 gives the PDB IDs (Berman et al., 2000)
of molecules used in this study.
Table A2: Molecules PDB IDs (Berman et al., 2000) used
in this study.
Tunnel dataset (33 elements)
1A0S, 1A2V, 1A6R, 1AON, 1AW5, 1BHC,
1CGM, 1EI7, 1GRL, 2GTL, 2X2C, 4V4K,
5CQF, 6QZ9, 6U42, 6U5F, 6X62, 6X63, 6X6K,
6ZW7, 7AX3, 7AZD, 7LER, 7MUS, 7PKR,
7Q4U, 7QXF, 7R5J, 7SN9, 7SP4, 7SQC, 7T7C,
7TBI
Alignment dataset (30 elements)
1A3J, 1AGA, 2ONX, 3DG1, 3FPO, 3FVA,
3NVG, 3OVL, 4NIO, 4QXX, 4R0P, 4RIL,
4W5M, 4W71, 4XFO, 5E5Z, 5I55, 5K2E,
5TXD, 6BZM, 6C3F, 6C3S, 6C4O, 6DIY,
6FGR, 6FHD, 6NB9, 6RHB, 7LTU, 8DDG
Viewpoint Selection for Molecular Visualization: Analysis and Applications
69
