
Enhancing Breast Cancer Diagnosis: Automated Segmentation and
Detection with YOLOv8
Farag H. Alhsnony
1
and Lamia Sellami
2
1
Electrical Engineering Department National Board for Technical and Vocational Education, TOBRUK, Libya
2
National School of Engineering, University of Sfax, Sfax, Tunisia
Keywords:
Breast Cancer, Computer Vision, Healthcare, YOLO, Deep Learning.
Abstract:
Breast cancer is a pervasive global health concern, demanding precise and timely diagnosis for effective treat-
ment. In this research, we present an innovative approach to breast cancer segmentation using YOLOv8x-seg,
a specialized variant of the YOLO (You Only Look Once) model optimized for semantic segmentation. The
methodology commences with comprehensive data collection from the Curated Breast Imaging Subset of
DDSM (CBIS-DDSM) dataset, which encompasses various breast conditions, and meticulous data annotation
facilitated by Roboflow. The YOLOv8x-seg model is trained to achieve an F1-score of 95.27% and an IoU (In-
tersection over Union) of 89.51%. These metrics are indicative of the model’s ability to accurately identify and
segment breast cancer anomalies within mammography images. The anticipated outcome is a model poised to
significantly improve the efficiency and accuracy of breast cancer diagnosis, offering a valuable contribution
to the field of medical image analysis.
1 INTRODUCTION
Artificial Intelligence (AI) is driving transformative
innovations in various fields, including Natural Lan-
guage Processing (NLP) (Mahdhaoui et al., 2023)
and Computer Vision. Beyond these domains, AI is
making significant strides in fields such as healthcare.
AI’s broad applicability extends to critical areas, in-
cluding the early detection and diagnosis of diseases
like breast cancer. These advancements highlight AI’s
profound impact on technology and its diverse appli-
cations in our daily lives. Breast cancer is a malig-
nant tumor that arises from the ab- normal breast cells
and it is one of the dangerous diseases that threaten
women worldwide. Worldwide, breast cancer is the
most common non-cutaneous cancer in women, with
over two million annual diagnoses. According to the
American Cancer Society, over 279,0 0 0 cases were
reported in the United States in 2020 and it is esti-
mated that 43,600 women will die from breast can-
cer in 2021 (Cokkinides et al., 2005) .Mammography
screening is one of the effective medical imaging tools
for early breast cancer detection and diagnosis, and it
can lower rates of advanced and fatal breast cancer
in its early stages (Duffy et al., 2020).Mammography
is a breast imaging method that uses ionizing radia-
tion (X-rays). In the older method, SFM (screen-film
mammography), the mammogram is obtained by ex-
posing the film to the radiation produced by an X-
ray tube. The modern method, FFDM (full-field dig-
ital mammography or digital mammography), has re-
placed the film with a digital receptor that converts the
residual radiation into an electrical signal. FFDM is
the only method approved for mammographic screen-
ing performance. Transition to FFDM has revealed
that it performs as well as SFM (Vinnicombe et al.,
2009). Observational studies show a mortality re-
duction of about 40% after mammography screening.
Computer-aided detection systems (CAD) emerged in
the 1990s to automatically detect and classify breast
lesions in mammograms. Still, these traditional CAD
systems fail to significantly improve screening perfor-
mance, mainly due to their low specificity [8,9].The
primary role of a CAD system is to resolve the chal-
lenge of interpreting DMs. The goals of the system
include effectively diagnose cancer and correctly in-
terpret DMs. The CAD structures were developed to
resolve the reliance of the operator in terms of diag-
nosis and decrease the cost of medical complemen-
tary technology. Typically, CADs are developed to
localize suspicious regions of lesions that exist in the
screened mammograms. The CAD approach is usu-
ally based on extracting image characteristics such as,
gray levels, texture, and shape to identify regions of
Alhsnony, F. and Sellami, L.
Enhancing Breast Cancer Diagnosis: Automated Segmentation and Detection with YOLOv8.
DOI: 10.5220/0012382500003636
Paper published under CC license (CC BY-NC-ND 4.0)
In Proceedings of the 16th International Conference on Agents and Artificial Intelligence (ICAART 2024) - Volume 3, pages 665-672
ISBN: 978-989-758-680-4; ISSN: 2184-433X
Proceedings Copyright © 2024 by SCITEPRESS – Science and Technology Publications, Lda.
665

interest (ROI) via simple machine learning techniques
.With the continuous increase of mammography data
availability and the existing large computational com-
puters, deep learning algorithms have been imple-
mented to alleviate the radiologists’ effort in reading
and assessing mammography images. To save con-
siderable time required for mammographic screening
presents opportunities for computer diagnostic assis-
tance tools. If these tools can achieve comparable or
superior results to those of radiologists, it may be pos-
sible to conduct double reading with the aid of a tool
and a single radiologist.
2 MAMMOGRAM IMAGES
Mammography uses low-dose X-ray for breast exam-
ination and it is routinely exploited for breast cancer
screening (Tang et al., 2009). With high sensitivity to
calcification, mammographic examination is far bet-
ter at detecting micro-calcifications and clusters of
calcifications, which are very important characteriza-
tions of breast cancer(Horsch et al., 2006).
Mammography is, essentially, the only widely
used Imaging modality for breast cancer screening.
Several large randomized clinical trials have shown
that mammography reduces mortality from breast
cancer.
Extensive investigations on radiation dose to the
breast and its dependence on breast composition,
breast thickness, and X-ray spectral characteristics
have been documented.
There are two imaging modalities of mammo-
grams: digital mammogram and screen-film mam-
mography. The screen-film mammography (SFM)
contains conventional analog mammography films.
Usually, SFM contains labels and markers in the
background, which considered as noise and need to
be removed. The digital mammograms are also called
Full-Field Digital Mammography (FFDM) images.
The FFDM is more recent and does not include la-
bels.
2.1 Views of Mammograms
There are multiple views for mammograms that
are used to provide more information before detec-
tion/diagnosis. A CC view mammogram is taken hor-
izontally from an upper projection at C-arm angle 0°;
the breast is compressed between two paddles to re-
veal the glandular tissue, and the surrounding fatty
tissue, also the right position of a CC view shows
the outermost edge of the chest muscle. MLO view
mammography is captured at a C-arm angle of 45°
from the side; the breast is diagonally compressed be-
tween the paddles and accordingly this allows imag-
ing a larger part of the breast tissue compared to other
views. In addition to that, the MLO projection allows
the pectoral muscles to appear in the mammographic
image.
Breast cancer typically presents itself in mammo-
grams in the form of masses, calcifications, asym-
metrical features or architectural distortions in the
breasts. Masses are three-dimensional tumors in the
breast and they can be either spherical or irregular in
shape. Irregularly shaped masses in mammography
are typically malignant, while elliptical and transpar-
ent masses are usually benign (Mustonen, 2022). Cal-
cifications are typically found in groups and they ap-
pear in mammography images as bright texture. Most
of the calcifications are benign and the differences be-
tween malignant and benign calcifications are subtle
(Mustonen, 2022).
Breast calcifications can be categorized into
macro-calcifications and micro-calcifications
(Nalawade, 2009).
Macro-calcifications appear as large white dots
on the mammogram and spread randomly over the
breast, and are considered as non-cancerous cells.
The micro-calcifications seem as small calcium spots
that look like white specks in the mammogram and
they often appear in clusters. Micro-calcification usu-
ally is considered as a primary indication for early
breast cancer or a sign of existing precancerous cells.
All of these aforementioned findings can be benign
or malignant. Benign findings are usually harmless,
since they do not grow fast nor do they spread outside
the tumor area. Malignant findings can metastasise
and grow faster.
2.2 Tumor Classifications of
Mammograms
Breast Imaging- Reporting and Data System (BI-
RADS) is used to classify the severity of the findings
in the breast from mammograms. The scale goes from
zero to six, six being the most severe and one meaning
that the breast is healthy. In Finland a similar scale is
used, without the third BI-RADS category and a dif-
ferent naming scheme (Table 1).The classification is
done by the radiologist after viewing the images and
if the finding is suspicious and further diagnosis is re-
quired then a biopsy is taken and the breast is reclas-
sified.
ICAART 2024 - 16th International Conference on Agents and Artificial Intelligence
666

2.3 Breast Density in Mammogram
Image
Breast density plays a significant role in determining
the likelihood and risk of breast cancer. Breast den-
sity describes the amount of fibrous and glandular tis-
sue compared with the amount of fatty tissue in the
breast. Breast density is categorized using a system
called the ACR BI-RADS. The ACR assigns breast
density to one of four classes. In class A, breasts are
almost entirely fatty. In class B, scattered areas of
fibro-glandular density appear in the breasts. In class
C, the breasts are heterogeneously dense. In class D,
the breasts are extremely dense.
3 PUBLIC MAMMOGRAM
DATASETS
There are several mammogram datasets publicly
available. Following is a brief description of the most
used datasets , which will be referenced in many re-
cent research.
3.1 Mammographic Image Analysis
Society (MIAS)
The Mammographic Image Analysis Society (MIAS)
is a research group from the UK interested in studying
mammograms. This group generated a small mam-
mogram database in 1994 called mini-MIAS or MIAS
for short. The mini-MIAS consists of 322 digitized
films stored in the PGM image format. Every im-
age has a resolution equal to 1024 × 1024 pixels.
The dataset contains annotations for background tis-
sue type (dense/fatty), the abnormality present in the
breast (masses, asymmetry), and the abnormality’s
severity (benign/malignant). Mammograms with le-
sions have recorded X and Y coordinates. It also
contains labels regarding MCs, ADs, asymmetry, and
healthy images.
3.2 Digital Database for Screening
Mammography (DDSM)
For DDSM, all images are 299×299. The DDSM
project is a collaborative effort at the Massachusetts
GeneralHospital (D.Kopans,R.Moore), the University
of South Florida (K. Bowyer), and Sandia National
Laboratories (P. Kegelmeyer). Additional cases from
Washington University School of Medicine were pro-
vided by Peter E. Shile, MD, Assistant Professor of
Radiology, and Internal Medicine.
The dataset includes 2620 cases. A case consists
of between 6 and 10 files. These are an ‘ics’ file, an
overview ”16-bit PGM” file, four image files com-
pressed with lossless JPEG encoding, and zero to four
overlay files.
3.3 In-Breast
IN-breast is a full-field digital mammographic
database. The cases were collected from Centro Hos-
pitalar de S. Joao (CHSJ), Breast Centre in Portu-
gal, in 2011. Largest publicly available dataset with
ground-truth annotations of breast cancer abnormali-
ties (i.e., benign and malignant).
It has 410 mammograms (i.e., normal, benign,
and malignant) including views of both MLO and CC
from 115 patients (Al-Antari et al., 2018). To evaluate
our CAD system, we include all cases having masses
in both views of the mammograms in a total of 107
cases. Some of these cases have more than one mass,
thereby, a total of 112 masses were collected accord-
ing to the Breast Imaging Reporting and Data System
(BI-RADS).
BI-RAD is standard criteria developed by the
American College of Radiology (ACR) to assign sus-
picious lesions into one of six categories (Al-Antari
et al., 2018). Benign cases are assigned to the cat-
egories 2 and 3, while malignant cases are in cate-
gories 4, 5, and 6. The resolution of images was 3328
4084 or 2560 3328 pixels and saved in the DICOM
format. The region of interest (ROI) was annotated
by two specialists and stored in separate .roi and xml
files (39).
3.4 Curated Breast Imaging Subset of
DDSM (CBIS-DDSM)
CBIS-DDSM is an updated and standardized version
of the Digital Database for Screening Mammography
(DDSM) stored in the DICOM file format.
The images in the CBIS-DDSM (Curated Breast
Imaging Subset of DDSM) are divided into three cat-
egories: normal, benign, and malignant cases. This
data set contains a total of 4067 images. The CBIS-
DDSM collection includes a subset of the DDSM data
selected and curated by a trained mammographer. The
images have been decompressed and converted to DI-
COM format(Zhu et al., 2023).
A subset of the DDSM is the curated breast
imaging subset of the DDSM (CBIS-DDSM), and
it includes well-annotated and labeled images. The
dataset includes information related to bounding
boxes for region of interests (ROIs), as well as de-
tailed pathological information regarding breast mass
Enhancing Breast Cancer Diagnosis: Automated Segmentation and Detection with YOLOv8
667

type, tumor grade, and stage. The dataset consists pri-
marily of scanned film-screen mammography, far be-
hind most advanced imaging techniques like FFDM
and DBT[36].
3.5 OPTIMAM Mammography
Database (OMI-DB)
The OMI-DB (Halling-Brown et al., 2014) is an
extensive mammography image database of over
145,000 cases (over 2.4 million images) comprised
of unprocessed and processed FFDMs from the UK’s
National Health Service Breast Screening Program.
It also contains expert’s determined ground truths and
associated clinical data linked to the images. As part
of the data sharing agreement with the Royal Surrey
County Hospital (UK) in 2017, we obtained a subset
of this database (4750 cases with 80,000 processed
and unprocessed FFDMs). The database contains im-
ages from different manufacturers, particularly Ho-
logic Inc, Marlborough, Massachusetts, USA (Ho-
logic Lorad Selenia and Selenia Dimensions Mam-
mography Systems), and General Electric (GE) Med-
ical Systems, Chicago, Illinois, USA (Senograph DS
and Senographe Essential), referred to as OMI-H and
OMI-G, respectively. For each case, two views of
each breast, i.e. medio-lateral oblique (MLO) and
cranio-caudal (CC) are available, together with sev-
eral other views for cases with suspected abnormali-
ties. The OMI-H and OMI-G dataset contained, re-
spectively 2042 and 103 positive cases, with abnor-
malities in either one of the mammography views (CC
and MLO), and 842 and 104 normal cases, i.e. with-
out any abnormalities.
3.6 University of Connecticut Center
(UCHC)
Named UCHC Digi-Mammogram (UCHCDM)
database (Zheng et al., 2016) . The dataset contains
screening mammograms of 230 patients, where each
case had an initial screening, called Prior exam,
and a second follow-up screening between 1 to 6
years, called the Current exam. Each screening
in the dataset acquires two different views, CC
and MLO. All images were saved with the Digital
Imaging and Communications in Medicine (DICOM)
format, and were annotated by expert radiologists in
a description text file with corresponding pathology
of a mammographic finding (i.e. Mass, Calcification,
Architectural Distortion, Normal), . Pixel-level
ground-truth images were also provided separately
where suspicious locations were circulated. A total
of 413.
3.7 The Chinese Mammography
Database (CMMD)
The authors of this dataset the volunteers from the
School of Computer Science and Engineering, South
China University of Technology for assisting to tidy
the clinical and imaging data. This work was sup-
ported by the grant from the National Natural Science
Foundation of China.
built a database conducted on 1,775 patients from
China with benign or malignant breast disease who
underwent mammography examination between July
2012 and January 2016. The database consists of
3,728 mammographies from these 1,775 patients,
with biopsy confirmed type of benign or malignant
tumors. For 749 of these patients (1,498 mammogra-
phies) we also include patients’ molecular subtypes.
Image data were acquired on a GE Senographe DS
mammography system.
4 TRADITIONAL CAD SYSTEMS
Numerous trials and research endeavors have been
initiated to develop Computer-Aided Diagnosis
(CAD) systems designed to serve as supplementary
tools for radiologists. These initiatives initially relied
on conventional computer vision techniques rooted
in traditional machine learning and image processing
methods. This section highlights some of these stud-
ies in detail.
In 2010, Ke, Li, et al.(Ghosh and Ghosh, 2022)
created a system for detecting masses in mammo-
grams using texture analysis and SVM classification,
achieving 85.11% sensitivity with 106 mammograms.
In 2015, Dong, Min, et al.(Min Dong, 2015) de-
veloped an automated system for classifying breast
masses, using techniques like chain codes, Rough
Set method, and Vector Field Convolution Snake,
with an optimized SVM and random forest classi-
fiers. Their method attained 97.73% accuracy on the
DDSM dataset. Both studies highlight the importance
of further research with larger datasets for more ro-
bust validation.
In 2015, Rouhi, Rahimeh, et al.(Rouhi R, 2015)
presented two novel approaches for mass segmenta-
tion in mammograms. They identified Regions of
Interest (ROIs) using chain codes from the DDSM
dataset and reduced noise with histogram equaliza-
tion and median filtering. The segmentation was per-
formed using two methods: region-growing and cel-
lular neural-based techniques. They applied a Ge-
netic Algorithm (GA) for feature selection, vary-
ing the chromosome structures and fitness func-
ICAART 2024 - 16th International Conference on Agents and Artificial Intelligence
668

tions. For classifying masses into benign or malig-
nant, they used multiple classifiers including Multi-
Layer Perceptron (MLP), Random Forest (RF), Na
¨
ıve
Bayes (NB), Support Vector Machine (SVM), and K-
Nearest Neighbor (KNN). Their experiments on both
DDSM and MIAS datasets showed that the second
segmentation technique achieved a high sensitivity of
96.87%, although results varied as detailed in their
study.
5 THE DEEP LEARNING-BASED
CAD SYSTEM
In recent times, there have been notable advance-
ments in the field of Computer-Aided Diagnosis
(CAD) systems, particularly driven by the remarkable
performance improvements of deep-learning mod-
els in computer vision. Convolutional Neural Net-
works (CNNs), transfer learning techniques, and deep
learning-based object detection models have played
a pivotal role in enhancing the performance of CAD
systems. Numerous algorithms have emerged that
harness the potential of deep learning models.
For instance, Dhungel Neeraj et al. (2017) (Dhun-
gel N, 2017) introduced a CAD tool designed for
mass detection, segmentation, and classification in
mammographic images, with minimal user interven-
tion. They employed a combination of random for-
est and a cascade of deep learning models for mass
detection, followed by a hypothesis refinement step.
The detected masses were further segmented using
active contour models, and a deep learning model,
pre-trained on hand-crafted feature values, was used
for classification. This system was tested on the IN-
Breast dataset, where it exhibited impressive results,
detecting nearly 90% of masses with a false-positive
rate of 1 per image. Additionally, the segmentation
accuracy reached 0.85 (as measured by the Dice in-
dex), and the model achieved a sensitivity of 0.98 for
classification.
Similarly, in the same year, Geras et al. (2017)
(Geras et al., 2017) developed a Deep Convolutional
Network (DCN) capable of handling multiple views
of screening mammography, specifically the CC and
MLO views for each breast side of a patient. This
model was designed to predict the radiologist’s as-
sessment and classify images based on the Breast
Imaging-Reporting and Data System (BI-RADS) cri-
teria, categorizing them as ”incomplete,” ”normal,”
or ”benign.” Their research delved into the impact of
dataset size and image resolution on screening per-
formance. The findings revealed that increased train-
ing set size led to improved performance, and the
model performed optimally at the original resolution.
In a reader study conducted on a random subset of
their private dataset (Liberman and Menell, 2002), the
model achieved a macUAC of 0.688, while a commit-
tee of radiologists achieved a slightly higher macUAC
of 0.704.
These studies exemplify the remarkable progress
in CAD systems driven by deep learning techniques,
showcasing their potential in enhancing the accuracy
and efficiency of breast cancer detection in mammo-
grams.
6 DEEP LEARNING-BASED
OBJECT DETECTION
In the realm of computer vision, the ascendancy of
deep learning has rendered the manual crafting of fea-
tures obsolete, as it now autonomously learns and
extracts the most pertinent image characteristics tai-
lored to specific tasks. Object detection, a crucial do-
main within computer vision, has seen remarkable ad-
vancements thanks to the integration of deep learning
techniques. These object detection methods primarily
fall into two categories: one-stage detectors, which
rely on regression or classification, and two-stage de-
tectors, which employ regional proposals (Zhao et al.,
2019). A fundamental element influencing the perfor-
mance of both these techniques is the concept of an-
chor boxes, which significantly impacts the accuracy
of object identification within images.
In 2018, Ribli Dezs
˝
o et al. (Ribli et al., 2018) em-
ployed the Faster R-CNN detector for mammogram
analysis. They modified pixel values for better im-
age quality and used INbreast and DDSM datasets
for testing and training. Their model could classify
masses as benign or malignant with high accuracy,
achieving an AUC score of 0.95 and detecting 90% of
malignant masses with a low false-positive rate. How-
ever, the study’s limited scope due to scarce datasets
with detailed annotations calls for further validation
on larger datasets.
7 METHODOLOGY
7.1 Methodology Overview
Our research endeavors to revolutionize breast can-
cer diagnosis by employing advanced deep learning
techniques, particularly focusing on the utilization
of YOLOv8x-seg. The methodology begins with an
exhaustive data collection process from the CBIS-
Enhancing Breast Cancer Diagnosis: Automated Segmentation and Detection with YOLOv8
669

DDSM dataset, followed by meticulous data annota-
tion using Roboflow. We employ the YOLOv8x-seg
model, a specialized variant optimized for semantic
segmentation, which combines real-time performance
with high accuracy. The annotated dataset is split
into training, validation, and testing subsets, ensur-
ing model robustness. After training, we assess the
model’s performance and fine-tune as necessary. Sub-
sequently, the YOLOv8x-seg model is deployed for
real-time breast cancer segmentation, swiftly and ac-
curately identifying and delineating regions of inter-
est within mammography images. Our ultimate ob-
jective is to contribute to improved breast cancer di-
agnosis, with YOLOv8x-seg serving as a pivotal tool
in enhancing the efficiency and accuracy of the diag-
nostic process. (See Figure 1 for an illustration of our
methodology process.)
7.2 Data Collection
In the initial phase of our research, we focus on
data collection. We acquire a curated dataset of
1400 mammography images from the CBIS-DDSM
database, which contains a diverse range of breast
conditions, both normal and cancerous. This dataset
selection ensures that our research is based on a bal-
anced mix of cases and is both diverse and represen-
tative. These images are drawn from the database
without any preprocessing, maintaining their original
quality, resolution, and format. This step is essential
for the subsequent use of the YOLOv8 model in de-
tecting and segmenting breast cancer anomalies accu-
rately.
7.3 Data Annotation
For the accurate and efficient annotation of the
dataset, we turn to Roboflow, a versatile data anno-
tation platform. Through Roboflow, we meticulously
annotate the regions of interest (ROIs) in the mam-
mography images, specifically marking the locations
of breast lesions, masses, or anomalies. These anno-
tations are represented as bounding boxes, precisely
delineating the boundaries of the anomalies within the
images. The result is a thoroughly annotated dataset,
primed for use with the YOLOv8 model.
7.4 Model Selection and Real-Time
Segmentation
In the subsequent phase of our methodology, we in-
tegrate the YOLOv8x-seg model. This model is a
highly specialized variant, particularly fine-tuned for
intricate semantic segmentation tasks, with a strong
emphasis on applications in breast cancer detection.
The YOLOv8x-seg is celebrated for its prowess in
real-time object detection, offering an optimal blend
of precision and speed. This balance is critical in
medical image analysis, where both accuracy and
timely results are paramount. The configuration of the
YOLOv8x-seg model is meticulously tailored to en-
hance its efficiency and accuracy in segmenting breast
cancer indicators in medical imagery.
Upon training, the YOLOv8x-seg model under-
goes application on a designated test dataset, marking
the commencement of real-time segmentation tasks
specific to breast cancer. The model’s architecture
and training enable it to deeply understand and rec-
ognize the nuanced features of breast cancer lesions.
This proficiency allows the YOLOv8x-seg to swiftly,
yet accurately, identify and outline the critical areas
within mammography images. These areas are po-
tential sites of abnormalities or lesions indicative of
breast cancer. The model’s ability to perform such
precise and rapid segmentation is crucial in delineat-
ing regions of interest that are essential for a thorough
and accurate diagnosis.
The integration of this combined phase of apply-
ing the trained YOLOv8x-seg model to real-time data
analysis significantly elevates the process of breast
cancer diagnosis. It ensures that the model not only
provides real-time segmentation but also maintains a
high level of precision in its analysis. This dual ca-
pability of the YOLOv8x-seg model positions it as a
fundamental tool in revolutionizing the efficiency and
accuracy of breast cancer diagnosis, potentially lead-
ing to earlier detection and better patient outcomes.
8 EVALUATION
In the evaluation phase of our research, we aim
to comprehensively assess the performance of the
YOLOv8x-seg model in breast cancer segmenta-
tion. The dataset, after meticulous annotation using
Roboflow, was thoughtfully split into two subsets:
80% for training and 20% for testing, ensuring a ro-
bust assessment of the model’s capabilities.
Training was conducted on a high-performance
computing platform, specifically Google Colab, har-
nessing the benefits of its GPU acceleration. This
allowed us to expedite the training process and en-
sure the model could efficiently process a consider-
able amount of data.
The training process spanned 80 epochs, with the
objective of achieving the following metrics:
F1-Score: The F1-score is a measure of a test’s
accuracy. It balances precision and recall and is cal-
ICAART 2024 - 16th International Conference on Agents and Artificial Intelligence
670
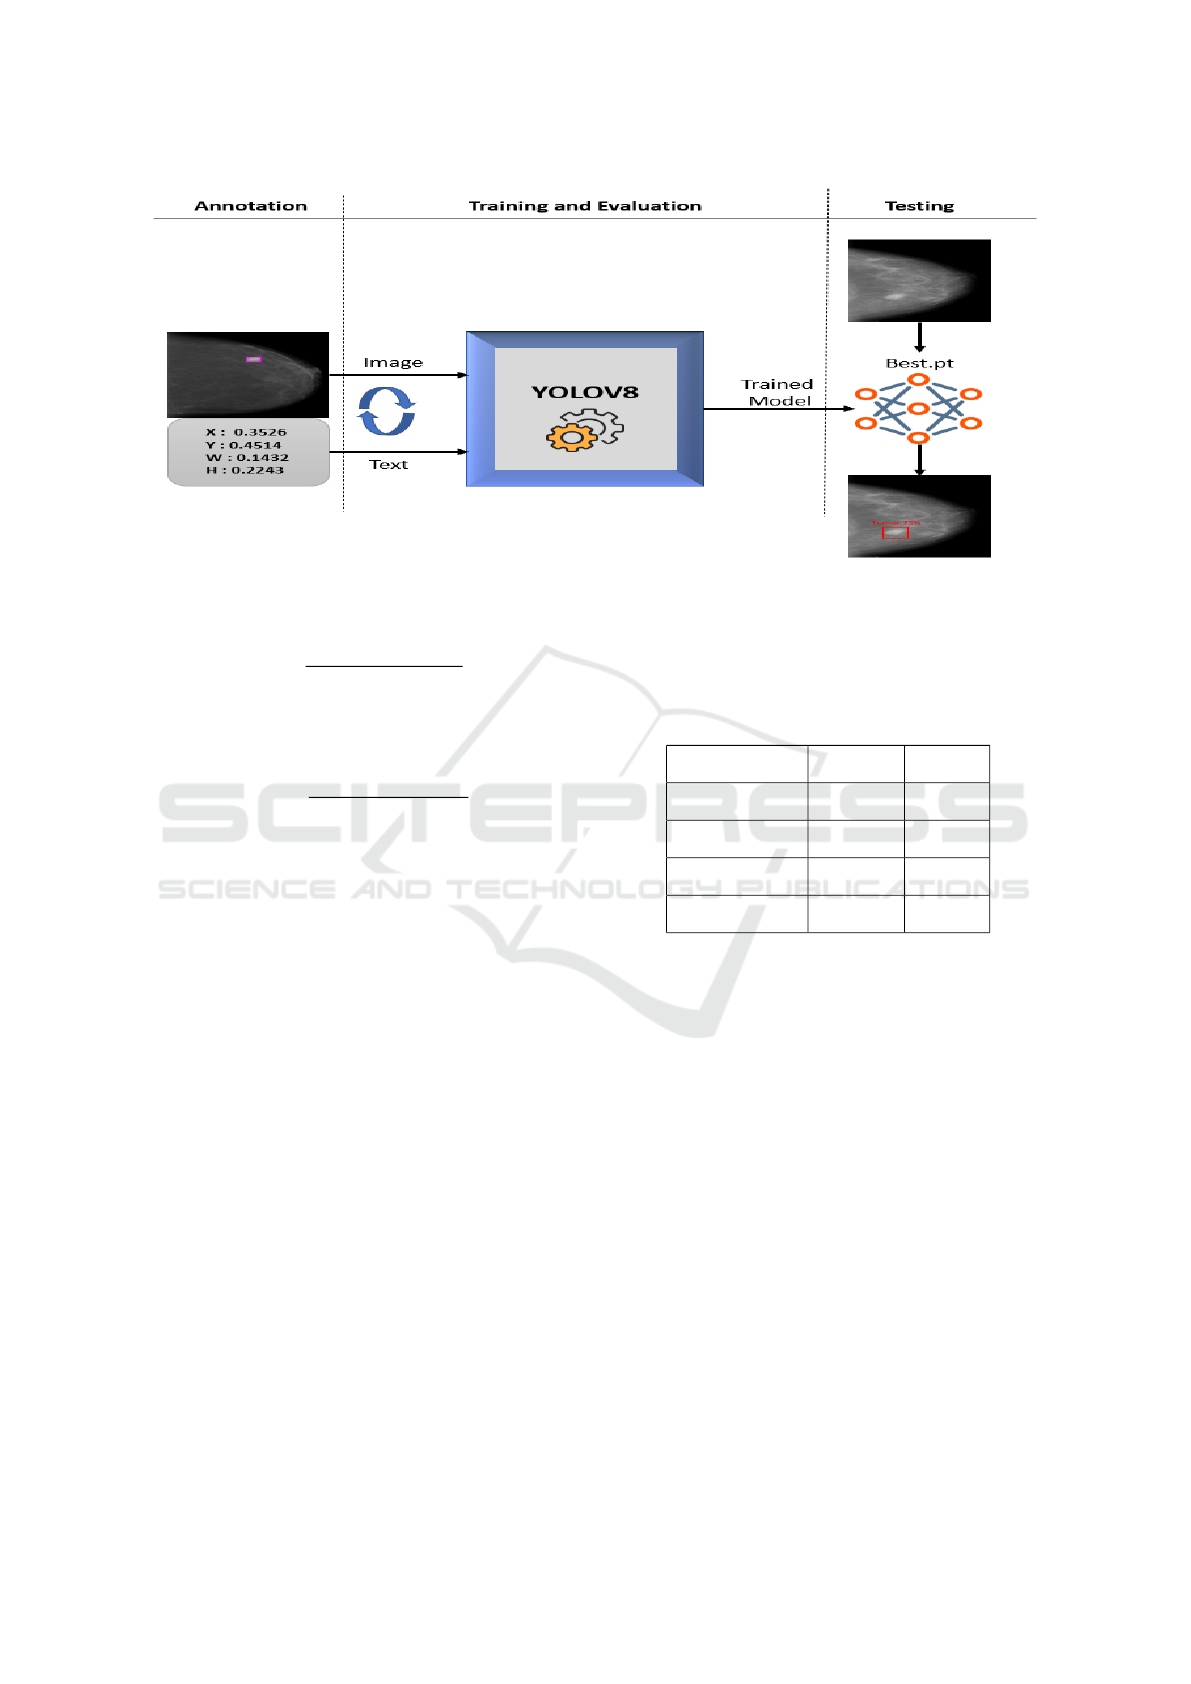
Figure 1: Methodology Overview.
culated using the formula:
F1 =
2 · Precision · Recall
Precision + Recall
Intersection over Union (IoU): The IoU is a metric
that assesses the spatial overlap between the predicted
region and the ground truth region. It is calculated as:
IoU =
Area of Intersection
Area of Union
These metrics, in addition to precision, recall, and
overall accuracy, will be rigorously assessed, and the
results will be crucial in determining the YOLOv8x-
seg model’s readiness for real-world clinical applica-
tions and its potential to enhance the accuracy and ef-
ficiency of breast cancer diagnosis.
In a comparative analysis of the different YOLO
architectures from YOLOv5 to YOLOv8 for segmen-
tation tasks, various key aspects and evolutionary ad-
vancements become evident. YOLOv5, as the base-
line, offers efficient and straightforward architecture,
ideal for a broad range of applications. Progressing to
YOLOv6 and YOLOv7, there are marked improve-
ments in accuracy and complex segmentation capa-
bilities, thanks to advanced features and optimiza-
tions. YOLOv8 represents the pinnacle of this evolu-
tion, with a design finely tuned for precision-intensive
tasks such as medical image segmentation, blending
real-time performance with high accuracy and supe-
rior semantic segmentation abilities. This version is
particularly adept at applications like breast cancer
detection, where precise lesion delineation is criti-
cal. Each iteration of the YOLO architecture builds
upon the strengths of its predecessors, with YOLOv8
epitomizing the optimal balance of speed, accuracy,
and detailed segmentation capabilities. The table be-
low 1 provides a detailed comparison of these YOLO
architectures, highlighting their specific features and
performance metrics in the context of segmentation
tasks.
Table 1: Comparative Analysis of YOLO Architectures for
Breast Cancer Segmentation.
Model F1-score IoU
YOLOv5x-seg 93.98% 88.02%
YOLOv6x-seg 94.32% 88.76%
YOLOv7x-seg 94.45% 89.11%
YOLOv8x-seg 95.27% 89.51%
The YOLOv8 model, achieving a 95.27% F1-
score, demonstrates exceptional accuracy in identify-
ing and segmenting breast cancer anomalies in mam-
mography images. This high F1-score reflects its ef-
fective balance between precision and recall. Addi-
tionally, YOLOv8’s impressive 89.51% Intersection
over Union (IoU) score underlines its capability for
precise localization and segmentation. These high
metrics highlight YOLOv8’s reliability and precision
in medical imaging, making it a crucial tool for ac-
curate diagnosis and effective treatment planning in
breast cancer care.
9 CONCLUSIONS
In this research, we’ve harnessed advanced deep
learning techniques, particularly YOLOv8x-seg, to
enhance breast cancer diagnosis. Through meticu-
lous data annotation and robust model training, we’ve
achieved an F1-score of 95.27% and an IoU of
Enhancing Breast Cancer Diagnosis: Automated Segmentation and Detection with YOLOv8
671

89.51%, indicating the model’s remarkable precision
and accuracy in breast cancer anomaly detection and
segmentation. These results hold great promise for
more accurate and efficient breast cancer diagnosis,
with the potential to positively impact clinical prac-
tices and patient outcomes. Our research underscores
the value of deep learning in healthcare and the con-
tinuous pursuit of innovation for saving lives and im-
proving patient care.
REFERENCES
Al-Antari, M. A., Al-Masni, M. A., Choi, M.-T., Han,
S.-M., and Kim, T.-S. (2018). A fully integrated
computer-aided diagnosis system for digital x-ray
mammograms via deep learning detection, segmenta-
tion, and classification. International journal of med-
ical informatics, 117:44–54.
Cokkinides, V., Albano, J., Samuels, A., Ward, M., and
Thum, J. (2005). American cancer society: Cancer
facts and figures. Atlanta: American Cancer Society,
2017.
Dhungel N, Carneiro G, B. A. (2017). A deep learning ap-
proach for the analysis of masses in mammograms
with minimal user intervention. Med Image Anal,
132:114—-128.
Duffy, S. W., Tab
´
ar, L., Yen, A. M.-F., Dean, P. B., Smith,
R. A., Jonsson, H., T
¨
ornberg, S., Chen, S. L.-S., Chiu,
S. Y.-H., Fann, J. C.-Y., et al. (2020). Mammog-
raphy screening reduces rates of advanced and fatal
breast cancers: Results in 549,091 women. Cancer,
126(13):2971–2979.
Geras, K. J., Wolfson, S., Shen, Y., Wu, N., Kim, S., Kim,
E., Heacock, L., Parikh, U., Moy, L., and Cho, K.
(2017). High-resolution breast cancer screening with
multi-view deep convolutional neural networks. arXiv
preprint arXiv:1703.07047.
Ghosh, D. and Ghosh, D. (2022). An overview and study of
cad systems for mass detec-tion and classification and
mammography for the detection of breast cancer. In
Acta Biol. Forum, pages 27–39.
Halling-Brown, M. D., Looney, P., Patel, M., Warren, L.,
Mackenzie, A., and Young, K. (2014). The oncology
medical image database (omi-db). In Medical Imag-
ing 2014: PACS and Imaging Informatics: Next Gen-
eration and Innovations, volume 9039, pages 25–31.
SPIE.
Horsch, K., Giger, M. L., Vyborny, C. J., Lan, L., Mendel-
son, E. B., and Hendrick, R. E. (2006). Classification
of breast lesions with multimodality computer-aided
diagnosis: observer study results on an independent
clinical data set. Radiology, 240(2):357–368.
Liberman, L. and Menell, J. H. (2002). Breast imaging re-
porting and data system (bi-rads). Radiologic Clinics,
40(3):409–430.
Mahdhaoui, H., Mars, A., and Zrigui, M. (2023). Active
learning with aragpt2 for arabic named entity recog-
nition. In International Conference on Computational
Collective Intelligence, pages 226–236. Springer.
Min Dong, Xiangyu Lu, Y. M. Y. G. Y. M. K. W. (2015). An
efficient approach for automated mass segmentation
and classification in mammograms. In Digit Imaging
28, pages 613—-625.
Mustonen, H. (2022). Breast mass segmentation from mam-
mograms with deep transfer learning. Master’s thesis,
H. Mustonen.
Nalawade, Y. V. (2009). Evaluation of breast calcifications.
Indian Journal of radiology and imaging, 19(04):282–
286.
Ribli, D., Horv
´
ath, A., Unger, Z., Pollner, P., and Csabai,
I. (2018). Detecting and classifying lesions in mam-
mograms with deep learning. Scientific reports,
8(1):4165.
Rouhi R, Jafari M, K. S. K. P. (2015). Benign and ma-
lignant breast tumors classification based on region
growing and cnn segmentation. In Expert Syst Appl,
pages 990––1002.
Tang, J., Rangayyan, R. M., Xu, J., El Naqa, I., and Yang,
Y. (2009). Computer-aided detection and diagno-
sis of breast cancer with mammography: recent ad-
vances. IEEE transactions on information technology
in biomedicine, 13(2):236–251.
Vinnicombe, S., Pinto Pereira, S. M., McCormack, V. A.,
Shiel, S., Perry, N., and dos Santos Silva, I. M. (2009).
Full-field digital versus screen-film mammography:
comparison within the uk breast screening program
and systematic review of published data. Radiology,
251(2):347–358.
Zhao, Z.-Q., Zheng, P., Xu, S.-t., and Wu, X. (2019). Ob-
ject detection with deep learning: A review. IEEE
transactions on neural networks and learning systems,
30(11):3212–3232.
Zheng, Y., Yang, C., Merkulov, A., and Bandari, M. (2016).
Early breast cancer detection with digital mammo-
grams using haar-like features and adaboost algo-
rithm. In Sensing and Analysis Technologies for
Biomedical and Cognitive Applications 2016, volume
9871, pages 117–126. SPIE.
Zhu, Z., Wang, S.-H., and Zhang, Y.-D. (2023). A survey of
convolutional neural network in breast cancer. Com-
puter modeling in engineering & sciences: CMES,
136(3):2127.
ICAART 2024 - 16th International Conference on Agents and Artificial Intelligence
672
