
Automatic Scoring of Shulman’s Clock Drawing Dementia Test
Bianca Suermann
1
, Miguel Schulz
1
, Klaus Brinker
1
and Markus Weih
2
1
Hamm-Lippstadt University of Applied Sciences, Marker-Allee 76-78, 59063 Hamm, Germany
2
Department of Neurology, University of Erlangen–Nuremberg, 91054 Erlangen, Germany
Keywords:
Clock Drawing Test, Dementia, Machine Learning.
Abstract:
With dementia currently being one of the biggest healthcare challenges, an improvement in diagnosis repre-
sents a substantial improvement for the patients and medical experts. A frequently used diagnosis tool is the
clock drawing test (CDT), cognitive short test typically conducted with pencil and paper and manually scored
by a medical professional. This paper introduces a transparent approach for software-assisted scoring and
screening of CDT, using a combination of deep learning elements and standard image recognition techniques.
Unlike an end-to-end approach, our strategy involves dividing the process into distinct subprocesses. This
division ensures that intermediate results are readily available throughout, establishing a robust and transpar-
ent foundation for the diagnostic process. A dataset containing 1236 CDT-scans is used for evaluating our
algorithm’s ability to score the result into a category from 1 to 6 and the ability to classify pass or fail is
assessed. Based on the results a component-wise software-assisted approach to CDT scoring seems to be a
viable alternative to end-to-end systems.
1 INTRODUCTION
Dementia is one of the biggest healthcare challenges
in out society affected by global ageing, with more
than 55.2 million people worldwide suffering from it
in 2019 and up to 139 million estimated cases in 2050
(World Health Organization, 2021).
It is a syndrome consisting of symptoms like
cognitive impairment, mood and behavioral changes.
These symptoms can be caused by several diseases,
namely Alzheimer’s disease, vascular dementia re-
sulting from a stroke and Lewy bodies. Abusive use
of alcohol or an unhealthy lifestyle can promote the
development of dementia. (World Health Organiza-
tion, 2023)
In Germany it is recommended to diagnose de-
mentia in two steps: Base diagnosis where the pa-
tients medical history is recorded and cognitive short
tests are conducted. One commonly used short test
is the so-called clock drawing test with an evalua-
tion scheme proposed by psychiatrist Shulman (Shul-
man et al., 1986). Following the base diagno-
sis, the next step, known as the differential diag-
nosis, involves investigating the severity and under-
lying causes through further medical examinations
(DGPPN, 2017).
Although previous attempts to automatically eval-
uate the clock drawing test using end-to-end deep
learning (DL) approaches have shown promising re-
sults, these methodologies often lack transparency
and explainability in their decision-making processes.
This limitation poses a significant impediment to their
practical application within the domain of diagnostics
(Holzinger et al., 2019). Consequently, the primary
objective of this study is to divide the CDT into trans-
parent subproblems presented to the medical expert
by applying a hybrid approach incorporating deep
learning and image recognition techniques, while try-
ing to achieve high accuracy in evaluating the clock
drawing test. The feasibility is evaluated based on
a reference dataset of scans, including the ground
truth scores provided by medical experts (Chen et al.,
2020).
This paper is structured as follows: We discuss
the clock drawing test in section 2 and summarize the
underlying image recognition methods in section 3.
After that, we introduce the scoring algorithm in sec-
tion 4, which is evaluated using the real-world dataset
presented in section 5 and the corresponding metrics
in section 6. In section 7, the experimental results of
evaluating of our algorithm’s ability to score and clas-
sify a CDT-scan as pass or fail are presented, followed
by a discussion in section 8. Finally, we provide a
summary of our findings and an outlook on improve-
ments and further research in section 9.
474
Suermann, B., Schulz, M., Brinker, K. and Weih, M.
Automatic Scoring of Shulman’s Clock Drawing Dementia Test.
DOI: 10.5220/0012382000003657
Paper published under CC license (CC BY-NC-ND 4.0)
In Proceedings of the 17th International Joint Conference on Biomedical Engineering Systems and Technologies (BIOSTEC 2024) - Volume 2, pages 474-481
ISBN: 978-989-758-688-0; ISSN: 2184-4305
Proceedings Copyright © 2024 by SCITEPRESS – Science and Technology Publications, Lda.

2 CLOCK DRAWING TEST
The clock drawing test (CDT) is a valuable tool in de-
mentia diagnosis, due to the fact that it involves mul-
tiple cognitive functions and behaviors. In this as-
sessment, patients are instructed to complete a given
circle so that it resembles a clock face, and then
draw clock hands indicating the time ’11:10’. Subse-
quently, a trained professional assigns a score ranging
from 1 to 6, with categories 1 and 2 denoting pass and
categories 3 to 6 fail.
According to Shulman, this test offers several ad-
vantages that make it an effective instrument for cog-
nitive screening (Shulman, 2000). Alongside other
cognitive short tests, for example the Mini-Mental-
Status test (MMST), the task engages various cog-
nitive functions, including abstract thinking, visual
memory, motor skills, and hand-eye coordination.
The execution of the task provides insight into a pa-
tient’s capacity to cope with frustration and chal-
lenges. Moreover, the test is cost-effective, easy to
administer, and independent of speech or educational
background. Siu et al. (Siu, 1991) reported a high
likelihood ratio of 24 (7.5-74) for an abnormal result
in the clock drawing test, indicating that an unfavor-
able test outcome allows for conclusions on the pa-
tient’s cognitive state.
Nonetheless, practical application challenges have
been noted by Chen et al. (Chen et al., 2020). These
challenges include difficulties in getting appointments
with specialists, high inter-rater variability, and po-
tential biases that human raters may develop with re-
spect to a patient’s appearance, status, or family back-
ground. These limitations emphasize the need for
software-assisted scoring to mitigate potential issues
in the test’s evaluation.
There are multiple kinds of scoring systems com-
monly used for the CDT, among those are the Sunder-
land (Sunderland et al., 1989) and the Agrell (Agrell
and Dehlin, 1998) schemes. This study uses the Shul-
man scheme as it is often applied in dementia diagno-
sis in Germany. Furthermore the experimental CDT
data was created and prelabeled with respect to the
Shulman scheme.
3 IMAGE RECOGNITION
In the following, we briefly revisit the essential im-
age analysis techniques which form building blocks
for our image recognition pipeline. Specifically, the
Hough transformations for line and circle detection.
Other techniques applied in the algorithm are standard
intensity-based segmentation, providing linked edge-
points forming contours and Gaussian blur-filtering
for filling gaps in the contours.
The Hough transformation is used to detect simple
geometrical shapes in images. First of all, geometri-
cal shapes such as lines or circles can be described
by a set parameters. To determine the parameters de-
scribing the shapes a so-called Hough-space can be
created. An edge detection is applied to compute all
points resembling an edge. For every edge point a set
of lines that pass through the point is calculated. After
all edge points are processed, a peak detection process
determines the set of parameters corresponding to pa-
rameters of the shapes. (Gonzalez and Woods, 2018)
4 SCORING ALGORITHM
The algorithm contains four processing stages.
(i) preprocessing
(ii) digit recognition
(iii) clock hand recognition
(iv) final scoring
The input consists of a CDT-result scan and the algo-
rithm’s output is an ordinal score from 1 to 6 and a
pass or fail classification.
The initial preprocessing step for a CDT-scan con-
sists of clock face identification using Hough trans-
formation for circle detection. Subsequently, the scan
is cropped to simplify the analysis process. The pre-
processing stage produces three distinct outputs: one
featuring thickened lines designed for clock hand de-
tection, another one with gaps filled using Gaussian
filtering, facilitating continuous contour detection in
digit recognition. Additionally, a cropped variant is
generated to provide feedback during the evaluation
phase
In the initial phase of digit recognition, a contour
detection process is employed to identify and extract
all contours within the image using an algorithm that
returns connected edge points as a contour (Suzuki
et al., 1985). The identified contours are subsequently
pre-sorted based on criteria such as size, aspect ra-
tio, and proximity to the center of the image in or-
der to identify potential digit candidates. Following
this preliminary selection, the contours are cropped
from the original image and these extracted images
are classified utilizing a model trained on the MNIST
dataset
1
of handwritten digits, that can accurately
classify inputs into the range of digits from 0 to 9.
Post-classification, further processing is done to iden-
tify double-digit sequences (ranging from 10 to 12) by
1
http://yann.lecun.com/exdb/mnist/
Automatic Scoring of Shulman’s Clock Drawing Dementia Test
475
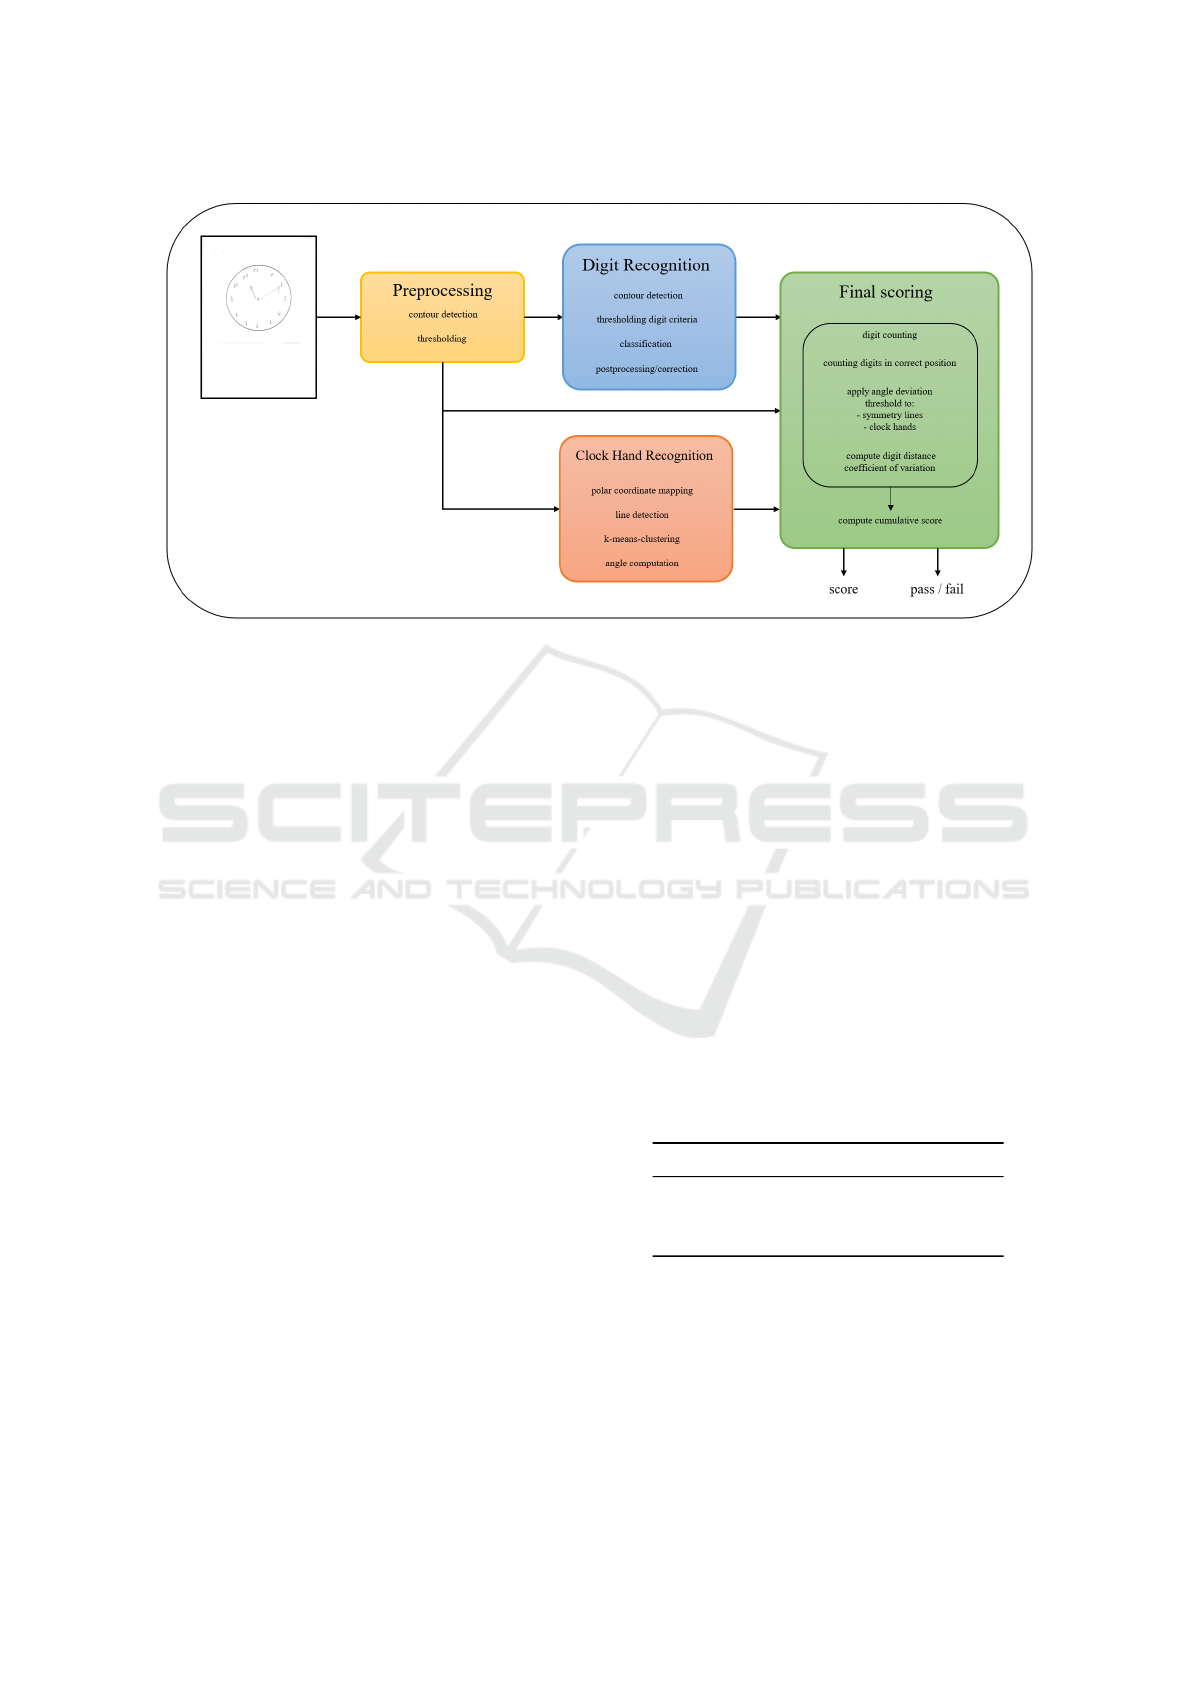
Figure 1: Schematic representation of the CDT-scoring algorithm.
evaluating the proximity between contours classified
as 0, 1, or 2. Additionally, certain classifications will
be corrected based on their position on the clock face.
For instance, misclassifying a ’1’ as a ’7’ can be cor-
rected, as there is no digit that resembles a ’7’ in the
upper half of the clock. The digit classification model
is a simple convolutional neural network (CNN) with
three convolution-pooling blocks and several process-
ing layers, accepting a 28×28 input and capable of
classifying inputs into the range of digits from 0 to 9.
For clock hand recognition, the preprocessed im-
age is mapped into a Cartesian coordinate system us-
ing a polar coordinate transform. Subsequently, a
Hough transformation, specialized for line detection,
is applied. The output of this transformation is then
filtered to identify horizontal lines, given that the po-
lar coordinate mapping tends to represent lines ra-
diating from the center as horizontal lines. The y-
coordinates of the extracted horizontal lines are sub-
jected to clustering via the k-means algorithm. This
clustering process, with parameter k set to 2, identifies
two centroids, which, in turn, allows for the precise
calculation of the two clock hands’ angles.
In the process of scoring, all subtask outputs, de-
rived from clock hand recognition and digit recog-
nition, are combined and used for computing a final
overall score based on a set of established scoring cri-
teria designed for the clock drawing test. This com-
prehensive evaluation encompasses various aspects:
First, from the digit recognition component, key pa-
rameters are considered, including the total count of
correctly identified digits, the number of digits accu-
rately positioned (as depicted in Figure 2), the pres-
ence of both vertical and horizontal symmetry lines,
as well as the alignment with the reference lines cor-
responding to the hour and minute clock hands. It is
noteworthy that suitable criteria for symmetry, clock
hand angles, and distance variation coefficient have
been derived from a preparatory study and are delin-
eated in Table 1. Additionally, the variation coeffi-
cient for the spacing between the digits (v) is com-
puted as part of the scoring process, where a v ≤ 0.295
is rated as perfect and 0.295 < v ≤ 0.44 is rated as
okay. Each of these criteria is assigned a specific
number of points, contributing to an overall cumula-
tive score, i.e. all individual scores are added together.
Notably, special emphasis is placed on the evaluation
of the clock hands, as their absence or inaccuracies
serve as crucial indicators or features for high point
ratings within the scoring system.
Table 1: Angle deviation thresholds for the scoring criteria
clock hands and symmetry lines.
Criteria ∆α Perfect ∆α Okay
Clock hand ±30.0
◦
±45.0
◦
Vertical line ±7.5
◦
±15.0
◦
Horizontal line ±20.0
◦
±40.0
◦
Finally, an overall score is computed as the output
of the analysis process. It is important to emphasize
that, due to splitting the process and the utilization
of predetermined criteria for decision-making, the
scoring process ensures a high level of transparency.
Preliminary outputs are accessible at every stage of
the process, promoting clarity and facilitating a more
HEALTHINF 2024 - 17th International Conference on Health Informatics
476

Figure 2: These figures illustrate the valid ranges for the
positions of the digits.” The height and width of the boxes
each make up one third of the clock’s diameter. The colors
are for illustration purposes only and have no scoring im-
pact.
thorough understanding of the assessment. Moreover,
the performance of individual sub-tasks can be as-
sessed and compared to optimize the complete algo-
rithm’s output.
5 DATA
The dataset used to test and develop the algorithm
was collected by (Chen et al., 2020) for developing
an end-to-end deep learning based approach to CDT-
scoring. It contains 1393 scans of results produced by
patients conducting the clock drawing test in the Shul-
man system. The data was collected from July 2018
on in the clinic for neurology in N
¨
urnberg, Germany.
Within this dataset, the average age is 69 ± 14.7 years
with 58.1 % are male and 41.9 % female patients.
The images are assigned into six categories on an
ordinal scale (1-6), where categories 1 and 2 are con-
sidered as pass and categories 3-6 as fail, by medi-
cal experts as ground truth. Additionally, there are
46 images in a validation folder. After reviewing the
dataset, 11.27 % clocks were removed across all cat-
egories because they contained contours outside the
given circle. Due to the design of the algorithm pro-
posed in this paper, with scans being cropped to the
given circle, a valuation of these clocks is not in-
tended. The remaining subset of the data contains
1236 clocks across all six categories. Sample diag-
nostic drawings for all six categories can be found in
(Chen et al., 2020).
6 EVALUATION METRICS
The underlying problem of assigning scores 1 to 6
to CDT-scans is an ordinal regression problem (OR),
whereas the problem of categorizing scans into pass
or fail can be considered a straightforward binary
classification problem. In the following, we discuss
appropriate evaluation metrics for both settings.
Ordinal Regression involves classifying an object
into one of several ordered classes, denoted as Y , sub-
ject a distinct ordered structure: Y = ⟨y
1
≺ . . . ≺ y
n
⟩.
Notably, despite the prevalence of ordinal regres-
sion in computer science, there is no consensus on
how it should be evaluated (Baccianella et al., 2009).
A widely employed metric is the mean absolute er-
ror (MAE), which calculates the differences between
a classification and its corresponding ground truth
across all elements (n) within a given category:
MAE =
1
n
n
∑
i=1
|y
i
− ˆy
i
| (1)
Baccianella et. al (2009) advocate for the adoption of
the macroaveraged mean absolute error (MAE
M
) in
the context of imbalanced datasets. This metric en-
sures that each prediction contributes equal weight in
the evaluation process, mitigating the impact of class
imbalance. To calculate the macroaveraged MAE, the
MAE of every category is computed and divided by
the number of categories (C):
MAE
M
=
1
C
C
∑
i=1
MAE
i
(2)
For the evaluation of the screening component, we
consider the application of well-established metrics,
specifically accuracy, precision, recall, and the F1-
score. Additionally, in the evaluation of screening,
scoring, and the digit recognition process, confusion
matrices are computed to provide a fine-grained pre-
diction representation.
7 RESULTS
The experimental results were computed using the
real-world dataset introduced in section 5. The result
assesses the performance of the algorithm explained
in section 4. Three subcomponents of the algorithm
are evaluated: Assigning a score to a CDT-scan (scor-
ing) is an ordinal regression problem and examining
how well the algorithm distinguishes between pass
and fail (screening) is evaluated using binary metrics.
To get a better understanding of possible underlying
issues in approach, the subprocess “digit recognition”
Automatic Scoring of Shulman’s Clock Drawing Dementia Test
477

Table 2: Result of the evaluation of digit recognition. The evaluation is conducted using digits from the clock dataset and
the MNIST dataset. The classification accuracy before and after position correction (PC) was calculated for each category.
Additionally, the percentage of discarded digits is reported.
dataset
score
accuracy -
w/o PC [%]
accuracy -
PC [%]
discarded
digits [%]
digits
CDT-scan digits 1 93.17 96.10 9.21 226
2 88.94 95.48 9.13 219
3 84.0 88.94 20.95 253
4 83.3 83.41 24.12 286
5 83.2 80.8 39.81 211
6 82.14 82.14 76.6 120
1-6 89.64 89.31 28.37 1195
MNIST 99.35 / 0 10000
is evaluated separately. This evaluation is of crucial
importance, as the results of digit recognition serve
as the foundation for both the scoring and screening
processes.
7.1 Model Performance on Clock Digits
The model’s digit classification performance is as-
sessed by extending the original dataset and labeling
digits originating from 15 CDT-scans across all cat-
egories and evaluating the model’s prediction perfor-
mance before and after position correction (cf. digit
recognition in section 4) is applied. Contours, that
don’t resemble a digit, and still passed the criteria de-
scribed in section 4, were sorted out in the labeling-
process, as the model is only capable of predicting
digits from 0 to 9.
On the extended subdataset the digit classification
model yields an accuracy of 89.64 % across all digits
and scores. With the best accuracy in categories 1 and
2 with 93.17 % and 88.94 %, and intermediate results
in categories 3 to 6 with an accuracy of around 83.3
%.
Regarding the position correction, this processing
step has a positive effect on the classification accu-
racy for digits in clock scans from categories 1 to 3,
while it has a negative or no effect in categories 4 to 6,
which makes sense, as these categories are typically
characterized by the absence of a normal clock struc-
ture.
We have observed that several contours (digit can-
didates) that are not actual digits are incorrectly clas-
sified as a digit and have a negative impact on the eval-
uation. If they are taken into consideration, the overall
accuracy evaluatesto 70.79 % before, and to 72.71 %
after position correction. The best prediction perfor-
mance is achieved for digits originating from clocks
with score 1, and the worst accuracy in category 6
digits with 19.17 % since 76.6 % of the contours were
excluded or removed.
7.2 Scoring
The scoring process pertains to an ordinal classifi-
cation regression, and its evaluation is based on the
mean absolute error (MAE), as expounded in section
6. Therefore, the mean absolute error of the classi-
fication outcomes within each category is calculated
for the considered dataset. Table 3 presents the ob-
tained evaluation results. Notably, a minimal MAE
of 0.2171 characterizes the classification of score 3
as the most accurate, whereas scores 5 and 6 exhibit
MAE values close to 1.1. On average, the dataset
yields a MAE of 0.7209. It is essential to emphasize
that the mean absolute error approximates 1, further
reinforced by an off-diagonal confusion matrix (Fig-
ure 3b) for classification (Chen et al., 2020). This ma-
trix accounts for cases where misclassifications dif-
fering by a single unit only from the correct classifica-
tion are considered as correct. Furthermore, a detailed
representation of the scoring performance is provided
through the confusion matrix, as depicted in Figure
3a, which offers insights into the clock drawing test
scoring process.
Comparing the two confusion matrices, it is appar-
ent that the result with confusion matrix 3a having a
accuracy for correctly classifying a CDT-scan into the
categories 1 to 6 of only 51.46 % and 93.47% from the
off-diagonal 3b. Showing there are inaccuracies that
need to be solved.
Table 3: Mean-Absolute-Error per score and macroaver-
aged Mean-Absolute-Error across all scores.
score MAE
1 0.8738
2 0.6624
3 0.2171
4 0.8450
5 1.0909
6 1.0606
MAE
M
(1 − 6) 0.7209
HEALTHINF 2024 - 17th International Conference on Health Informatics
478
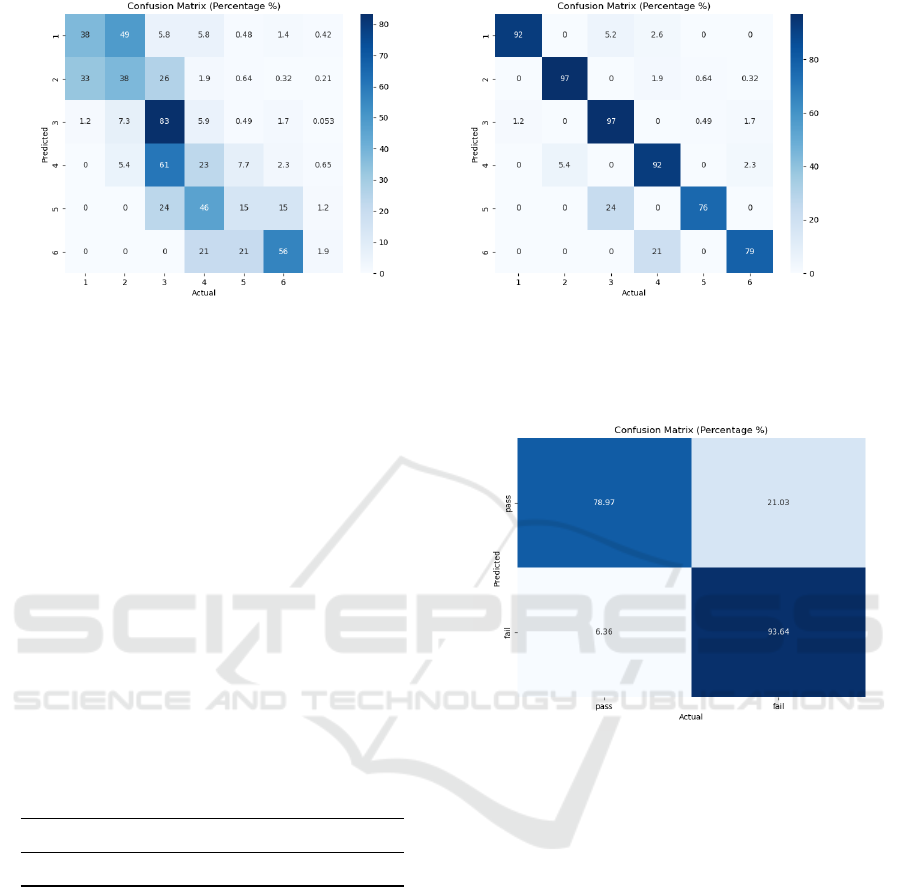
(a) CDT-scoring results (b) off-diagonal CDT-scoring results
Figure 3: Normalized confusion matrix depiction of the scoring result, presented in percentages [%]. Confusion matrix (a)
shows the raw scoring outputs and (b) shows an off-diagonal representation of the results, where misclassifications, that are
off by one unit are considered correctly classified.
7.3 Screening
Evaluating the algorithm’s capability to decide if a
CDT-result is considered pass and fail leads to the
results in Table 4 and Figure 4. To facilitate this
evaluation, the classifications for categories 1 and 2
are merged, and similarly, the classifications for cat-
egories 3 to 6 are combined, effectively establishing
the binary pass and fail classes for analysis. The al-
gorithm classifies the CDT-scans with an accuracy of
87.31 %. The precision amounts to 85.35 %, whereas
the recall amounts to 93.64 %, indicating a high level
of accuracy for correctly classifying negative result as
such.
Table 4: Results of screening. The accuracy [%], precision
[%], recall [%] and F1-score are computed.
Accuracy Precision Recall F1-Score
87.31 85.35 93.64 0.8931
8 DISCUSSION
Our empirical results show that it is possible to evalu-
ate results of the clock drawing test using the Shulman
scoring scheme with the transparent component-wise
approach of combining image recognition techniques
and deep learning.
It is evident that the pure multiclass classification
performance with a low classification accuracy of 51
% is neither satisfactory nor robust. The confusion
matrix in Figure 3b, shows potential for achieving
better results with improved subtask prediction per-
formance. In this discussion, we will investigate po-
Figure 4: Normalized confusion matrix depiction of the
screening result, presented in percentages [%].
tential sources of inaccuracy and errors, and explore
potential counter corrective measures that could ulti-
mately enhance the accuracy and effectiveness of both
the scoring and screening processes.
The primary source of inaccuracy most likely
stems from using a deep learning model for digit
recognition, which is only capable of classifying dig-
its from 0 to 9. Classifying double-digits is a chal-
lenge handled by a heuristic digit preprocessing. A
conceptual issues poses the input of non-digit con-
tours and the incorrect classification as digit between
0 and 9, because the model is only capable of clas-
sifying between 0 and 9. This has a negative effect
on the whole final scoring of the CDT scan and the
basis of all scoring aspects. Firstly, the model’s out-
put contains the number of digits and can also have
an impact on counting the digits, that are in the cor-
rect position (criteria in scoring), since non-digits in-
puts are often simple lines misclassified as ’1’. Addi-
tionally, the digit recognition output serves as the ref-
Automatic Scoring of Shulman’s Clock Drawing Dementia Test
479

erence for determining symmetry lines. These lines
are calculated based on the centers of the topmost and
bottommost digits for vertical symmetry and the left-
most and rightmost digits for horizontal symmetry.
Furthermore, it impacts the distance variation coef-
ficient as artifacts or additional lines are frequently
unevenly distributed across the scan. Lastly, for in-
stances where the algorithm identifies a 2 and an 11
it uses their centers as references for calculating the
optimal angle for the clock hand evaluation. There-
fore, the accuracy and reliability of the digit recogni-
tion component significantly influence the entire CDT
scoring process.
Another critical aspect regarding the digit clas-
sification model is that it is trained using data from
the MNIST dataset and subsequently applied to clas-
sify digits within CDT-scans without further trans-
fer learning on these specific digits. The handwritten
digits in the MNIST dataset, were mostly created by
young American highschool students and employees
of the National Institute for Standards and Technol-
ogy, whereas the scans were conducted in Germany.
This raises the possibility that there are differences
how Americans and Germans write digits. Also peo-
ple suffering from dementia are typically older, an-
other aspect distinguishing the clock digits from the
training data.
Another potential difference between the ground
truth and model’s prediction could stem from the dis-
cretion that a human rater can perform case-by-case
decisions. It is possible for a medical expert to assign
a perfect rating to clock hands that are drawn as a di-
rect line between 2 and 11 without touching the center
the clock face, as it is clear that the patient correctly
identifies the correct time. Our detection algorithm
on the other hand is not capable of doing that, as it is
looking for lines originating in the center of the clock,
which might not always align with human evaluative
criteria.
Reevaluating the exact criteria for the final scoring
within the algorithm might be necessary on a techno-
logical level to provide both transparent and accurate
predictions in scoring. However a thorough study by
Mainland et al. (2014) implies that, in the medical
context, it is more important to correctly assess be-
tween pass or fail, than to increase the complexity of
scoring criteria, to depict the cognitive state a person.
(Mainland et al., 2014).
Our algorithm evaluates a scan of CDT result, per-
formed on paper with a pen. Information about the
patients behaviour and the time taken for completing
the test is lost in this form of evaluation.
To conclude this discussion there are some inac-
curacies in the current algorithm, especially regard-
ing the digit recognition. However the results show
the potential of an automatic evaluation of the CDT,
especially when it comes to binary classification as
pass and fail.
9 CONCLUSION
This paper examines the feasibility of scoring and
screening the clock drawing test with a transparent,
component-wise approach of combining traditional
image detection methods and deep learning. The pro-
posed algorithm yields good prediction accuracy for
screening, where a CDT-scan is classified as pass or
fail. Especially in correctly classifying true-negative
results, which is of particular relevance in practical
dementia diagnosis, only 6.36 % of failed CDT-scans
are misclassified as pass.
The MAE from scoring and the confusion matri-
ces in Figure 3 suggest that there are some issues in
precise ordinal regression prediction. However incor-
rect predictions are off by a score of 1 and resolv-
ing the issues discussed in section 8 could lead to im-
provements of the accuracy.
Future advancements of the algorithm should pri-
oritize more precise digit recognition, such as the im-
plementation of a non-digit-class for input training.
Moreover, it is imperative to engage in a comprehen-
sive review and standardization of the digital scor-
ing criteria, involving a multidisciplinary team of ex-
perts encompassing the fields of dementia, neurology,
clock drawing testing and computer science. This col-
laborative effort will ensure that the scoring criteria
are transparent, robust and universally accepted.
Part of the preparatory work has been creating an
app
2
for digitally performing the clock drawing test
on an iPad. The result is scored with a variant of the
algorithm, described in this paper and showed good
results, that are of clinical significance.
REFERENCES
Agrell, B. and Dehlin, O. (1998). The clock-drawing test.
Age and ageing, 27(3):399–404.
Baccianella, S., Esuli, A., and Sebastiani, F. (2009). Evalu-
ation Measures for Ordinal Regression. In 2009 Ninth
International Conference on Intelligent Systems De-
sign and Applications, pages 283–287.
Chen, S., Stromer, D., Alabdalrahim, H. A., Schwab, S.,
Weih, M., and Maier, A. (2020). Automatic dementia
2
https://apps.apple.com/gb/app/clock-drawing-test/id
1594273677
HEALTHINF 2024 - 17th International Conference on Health Informatics
480

screening and scoring by applying deep learning on
clock-drawing tests. Scientific Reports, 10(1):20854.
DGPPN (2017). S3-Leitlinie Demenzen. Interdiszi-
plin
¨
are S3-Praxisleitlinien. Springer Berlin / Heidel-
berg, Berlin, Heidelberg.
Gonzalez, R. C. and Woods, R. E. (2018). Digital Image
Processing. Pearson, New York.
Holzinger, A., Langs, G., Denk, H., Zatloukal, K., and
M
¨
uller, H. (2019). Causability and explainability of
artificial intelligence in medicine. Wiley Interdisci-
plinary Reviews: Data Mining and Knowledge Dis-
covery, 9(4):e1312.
Mainland, B. J., Amodeo, S., and Shulman, K. I. (2014).
Multiple clock drawing scoring systems: simpler is
better. International journal of geriatric psychiatry,
29(2):127–136.
Shulman, K. I. (2000). Clock-drawing: is it the ideal cogni-
tive screening test? International journal of geriatric
psychiatry, 15(6):548–561.
Shulman, K. I., Shedletsky, R., and Silver, I. L. (1986). The
challenge of time: clock-drawing and cognitive func-
tion in the elderly. International journal of geriatric
psychiatry, 1(2):135–140.
Siu, A. L. (1991). Screening for dementia and investigating
its causes. Annals of Internal Medicine, 115(2):122–
132.
Sunderland, T., Hill, J. L., Mellow, A. M., Lawlor, B. A.,
Gundersheimer, J., Newhouse, P. A., and Grafman,
J. H. (1989). Clock drawing in Alzheimer’s disease:
a novel measure of dementia severity. Journal of the
American Geriatrics society, 37(8):725–729.
Suzuki, S. et al. (1985). Topological structural analy-
sis of digitized binary images by border following.
Computer vision, graphics, and image processing,
30(1):32–46.
World Health Organization (2021). Global status report on
the public health response to dementia.
World Health Organization (2023). Dementia. https://ww
w.who.int/news-room/fact-sheets/detail/dementia.
(accessed on 15.10.2023).
Automatic Scoring of Shulman’s Clock Drawing Dementia Test
481
