Most Relevant Viewpoint of an Object:
A View-Dependent 3D Saliency Approach
Marie Pelissier-Combescure
a
, Sylvie Chambon
b
and G
´
eraldine Morin
c
University of Toulouse, IRIT, Toulouse INP, France
Keywords:
View-Dependent Saliency, Best View Selection, 3D Models/2D Images, User Study Evaluation.
Abstract:
A viewpoint of a 3D object is the position from which we observe the object. A viewpoint always highlights
some 3D parts and discards other parts of an object. Here, we define a good viewpoint as offering a relevant
view of the object: a view that best showcases the object and that is the most representative of the object. Best
view selection plays an essential role in many computer vision and virtual reality applications. In this paper,
given a model and a particular viewpoint, we want to quantify its relevance -not aesthetics. We propose a
geometric method for selecting the most relevant viewpoint for a 3D object by combining visibility and view-
dependent saliency. Evaluating the quality of an estimated best viewpoint is a challenge. Thus, we propose an
evaluation protocol that considers two different and complementary solutions: a user study with more than 200
participants to collect human preferences and an analysis of image dataset picturing objects of interest. This
evaluation highlights the correlation between our method and human preferences. A quantitative comparison
demonstrates the efficiency of our approach over reference methods.
1 INTRODUCTION
In video games, guiding players through a 3D envi-
ronment via a 2D screen is a challenge. Techniques
from movies, such as sound, lighting, and camera an-
gles, are used to convey information without extra text
or signs. The viewpoint of an object has a similar ef-
fect: a well-highlighted and easily recognizable angle
makes an object more attractive. As (Fabricatore and
et al. , 2002) notes, clear understanding of object se-
mantics is crucial for good player interaction. This
aligns with the main subject of this paper: best view
selection.
(a) (b) (c)
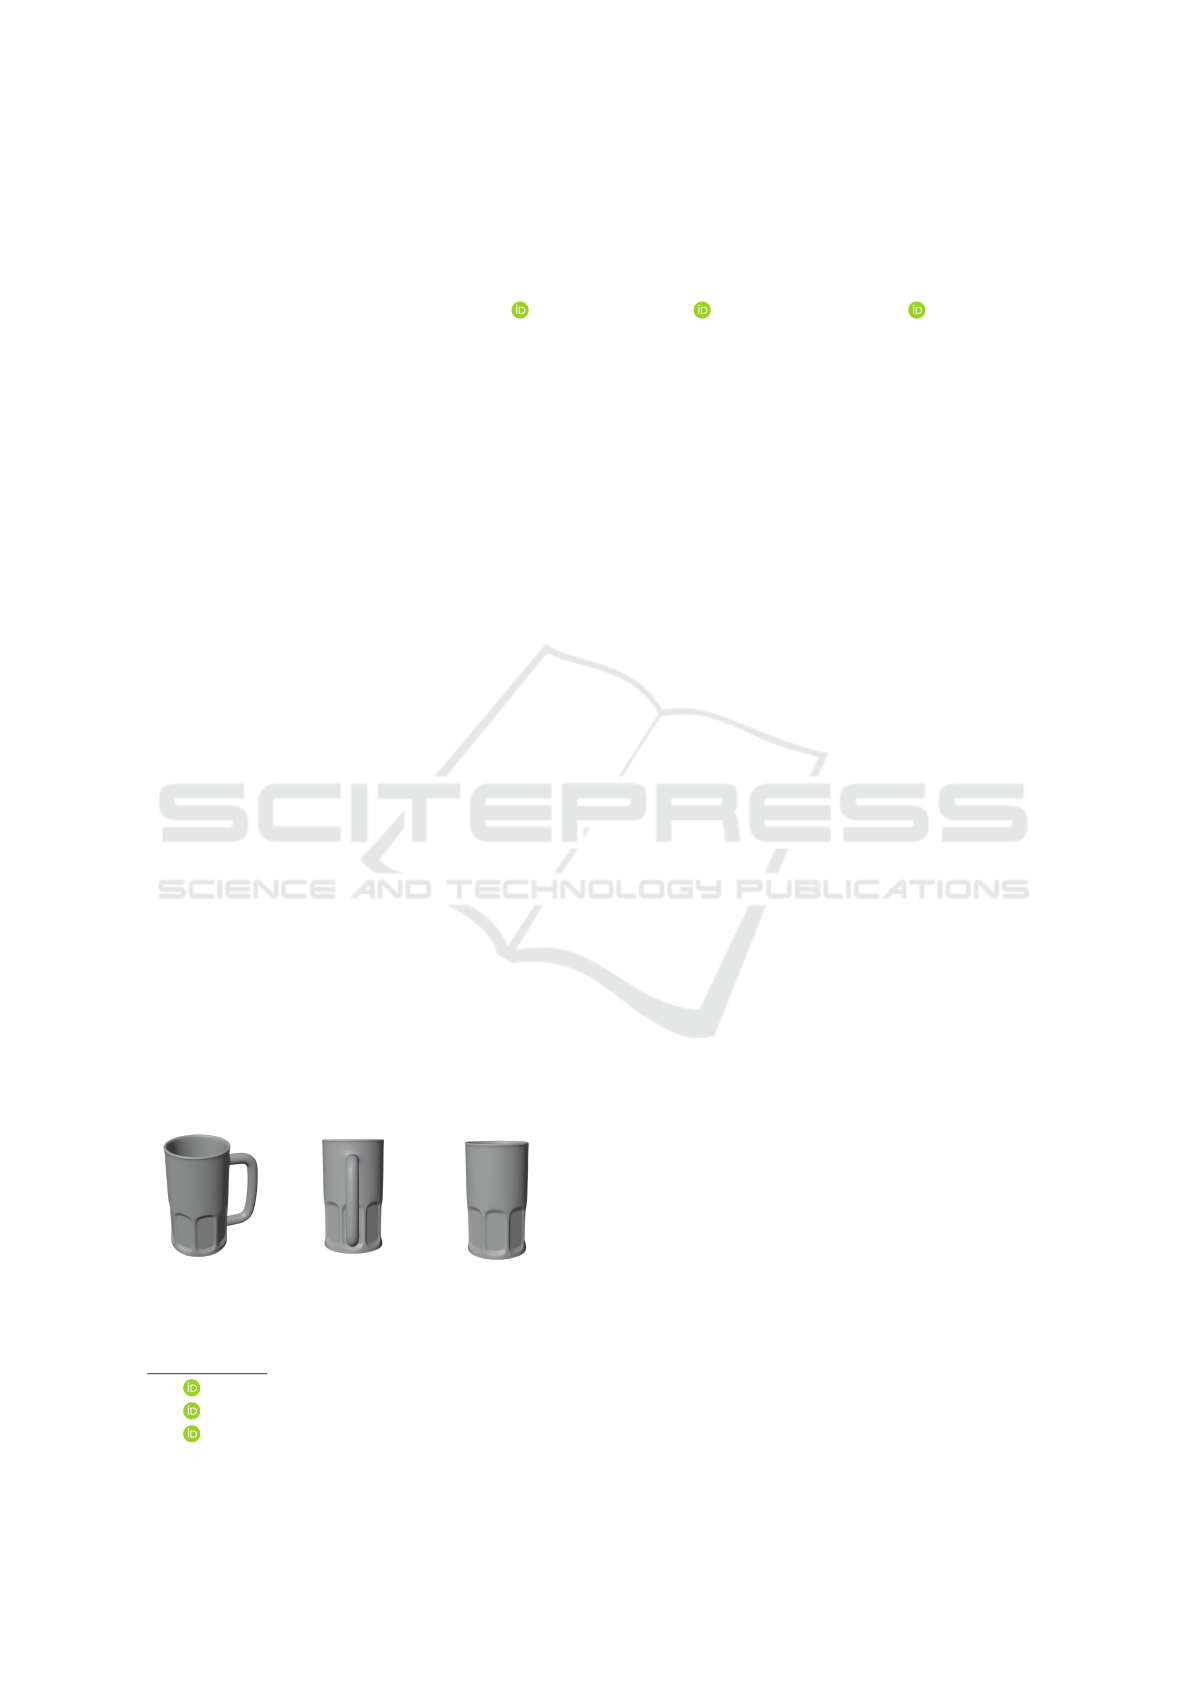
Figure 1: Three examples of viewpoints for a cup: a relevant
view (a), an accidental view (b) and an occluded view (c).
a
https://orcid.org/0009-0004-2797-462X
b
https://orcid.org/0000-0001-8104-1637
c
https://orcid.org/0000-0003-0925-3277
In our work, accurately place and well-highlight
3D features in 2D interfaces is essential to get the best
understanding of the object. To assess the relevance
of a viewpoint, we measure the essential 3D informa-
tion it contains. In Figure 1, there are multiple view-
points of a cup. Figure 1a presents an relevant view-
point where all representative parts are visible with-
out any ambiguity. However, Figure 1b depicts an so-
called accidental view (Blanz and Tarr, 1999), caus-
ing a perspective issue that reduces the global under-
standing. Moreover, obscured views, like Figure 1c,
hides some characteristic parts, leading to misinter-
pretation; in this case, the cup could be mistaken for
a glass
Traditionally, given a 3D object, in order to evalu-
ate the quality of a point of view, two aspects can be
considered: the amount of visible features (Plemenos
and Sokolov, 2006) or its saliency (Leifman and et al.
, 2016). Our first contribution consists in proposing
an original measure of the viewpoint relevance that
combines several efficient view-dependent 3D char-
acteristics, see Figure 2 (inside the blue box).
To evaluate our method, we establish an origi-
nal evaluation protocol: we compare our best view-
point with viewpoints chosen explicitly or implicitly
by users, as illustrated in Figure 2 (inside the purple
box). More precisely, we have carried out a user study
482
Pelissier-Combescure, M., Chambon, S. and Morin, G.
Most Relevant Viewpoint of an Object: A View-Dependent 3D Saliency Approach.
DOI: 10.5220/0012379500003660
Paper published under CC license (CC BY-NC-ND 4.0)
In Proceedings of the 19th International Joint Conference on Computer Vision, Imaging and Computer Graphics Theory and Applications (VISIGRAPP 2024) - Volume 3: VISAPP, pages
482-491
ISBN: 978-989-758-679-8; ISSN: 2184-4321
Proceedings Copyright © 2024 by SCITEPRESS – Science and Technology Publications, Lda.

Figure 2: Three terms (surface visibility S, eyes surface visibility S
e
, and saliency of visible vertices S
a
) are computed for
each viewpoint (blue box) from a 3D model. The view with the highest score is selected as the best viewpoint. Evaluation
(purple box) is based on user study.
on 3D objects to collect human preferences, and we
also analysed 2D images relative to the same 3D ob-
jects to extract reference viewpoints. Finally, we also
compare our method with state of the art best view-
point selection approaches.
After presenting a review of methods for best view
selection, in Section 2, we introduce our approach
based on a view-dependent 3D saliency, in Section 3.
In Section 4, for validation, we conduct a rigorous
user study to capture human preferences and present
an original metric to assess the similarity between a
proposed viewpoint and this ground truth. Based on
this evaluation, we analyse the proposed score and
include an ablation study, in Section 5, and finally
present comparisons in Section 6, before concluding.
2 SELECTING THE BEST
VIEWPOINT
The purpose of best view selection is to optimize
the visual experience by identifying the most suitable
viewpoint for a given, application, or user interaction,
like for example when visualising a 3D object within
a 3D virtual environment (Habibi and et al. , 2015)
or for choosing among multiple videos capturing an
object of interest during the same event (Rudoy and
Zelnik-Manor, 2012). Different methods have been
proposed for taking advantage of the geometric model
attributes, which can be classified into two categories.
Face-Based Methods. (V
´
azquez and et al. , 2001)
introduce the concept of viewpoint entropy which uses
the projected face areas to determine the amount of in-
formation in a given view. Unfortunately, this method
is dependent on the initial scene subdivision. To ad-
dress this limitation, (Sokolov and Plemenos, 2005)
propose to rather use a measure based on curvature.
Vertex-Based Methods. Methods can be split into
two stages: the first step involves calculating the 3D
intrinsic saliency of every vertex, followed by selec-
tion of the best view.
For the best view selection, (Nouri and et al. ,
2015) associate to each viewpoint, a score that corre-
sponds to the sum of the intrinsic saliencies of the vis-
ible vertices. (Leifman and et al. , 2016) and (Feixas
and et al. , 2009) incorporate a weighted sum based
on the angle between the surface normal at the vertex
and the viewing direction.
For the use of the saliency, some best view selec-
tion methods attempt to combine different features of
models. (Secord and et al. , 2011) proposes a lin-
ear combination of criteria, related to different as-
pects of a view such as surface or silhouettes that
closely aligns with human preferences according to
view goodness. (An and et al. , 2016) propose a
method that computes an independent hybrid saliency
for each vertex based on geometric and color informa-
tion of the input mesh. Then, (Wu and et al. , 2013)
present an approach that take into account both local
contrast and global rarity.
All these methods aim to mimic human aesthetic
preferences. In a complementary manner, in our
work, we want to determine the most relevant view
of an object: the most representative, the view that
presents the most informative parts of the object in
order to understand how it works or to recognize it
unambiguously. In other words, the selected views
should be similar to those that a human might have
chosen, relative to its needs for a given task, and, so,
coherent with our goal: measuring relevance, not aes-
thetic. To ensure this condition, we use the results
of our user study to evaluate our method and others.
Now, we will describe the details of our proposed ge-
ometric method for best view selection.
Most Relevant Viewpoint of an Object: A View-Dependent 3D Saliency Approach
483

3 PROPOSED BEST VIEW
SELECTION
Our proposed Point Of View pov score, that automat-
ically selects the best point of view, is based on 3D
saliency relative to a chosen view. A first step to con-
sider viewpoint dependency is to determine the vis-
ibility of a vertex (Lee and et al. , 2005) or a face
(Plemenos and et al. , 2004). We further weight ver-
tex saliency by the layout of a visible vertices relative
to the viewpoint.
3.1 Viewpoint Score
We introduce three different terms: visible surface
size for the whole model and for the eyes (when
applicable) and intrinsic saliency of the model. Given
a 3D model M and a particular pov :
• Surface Visibility S(pov): quantifies the
amount of surface visibility according to a point of
view, i.e. the ratio between the visible 3D surface and
the total 3D surface of the model. (Secord and et al. ,
2011) has shown that the single-attribute method that
best matches human preferences is the one based on
surface visibility, so we keep that term to respect this
observation.
• Eyes Surface Visibility S
e
(pov): indicates the
amount of surface visibility of the eyes, i.e. the ra-
tio between the visible 3D surface and the total 3D
surface of the eyes. This choice is motivated by the
conclusion of the work of (Secord and et al. , 2011)
that points out the importance of the visibility of the
eyes. In our work, we manually annotated the faces
of the 3D models corresponding to the eyes.
• Saliency of Visible Vertices S
a
(pov): repre-
sents the amount of 3D saliency relative to the view-
point. Like (Leifman and et al. , 2016), we sum the
saliencies of visible vertices, weighted by a function
f dependent on the angle α
v
between visible vertices
and the camera.
S
a
(pov) =
∑
v∈V
S
i
(v). f (α
v
), (1)
with S
i
(v) the saliency of a visible vertex v and V the
set of visible vertices from pov. We consider different
possibilities for f (α
v
), see section 3.2. This saliency
term is normalized by dividing by the maximum value
obtained over all the saliencies computed for all view-
points.
Finally, the pov score is determined by the sum of
these three terms and the best viewpoint
g
pov
M
of the
mesh M is the one maximising this score:
g
pov
M
= argmax
pov ∈ P
(S(pov)+ S
e
(pov)+ S
a
(pov)) (2)
where P is the set of the available viewpoints. Details
of the computation of visible vertices and angles from
a viewpoint are detailed in the appendix.
3.2 Saliency of Visible Vertices
In the proposed formula, the term assigned to the
saliency S
a
depends on the choice of two parameters:
an intrinsic saliency method S
i
and an angle function
f . We detail these two aspects.
Vertex 3D Saliency. 3D saliency are used to high-
light regions of interest and to guide visual attention
to the most important features. Some methods deter-
mine the two principal curvatures of model vertices
to highlight these areas, for example: (Taubin, 1995),
(Meyer and et al. , 2003), and (Rusinkiewicz, 2004).
Others may be multi-resolution by varying neigh-
bour sizes and merging values from different scales,
as (Lee and et al. , 2005), (Miao and Feng, 2010),
(Wang and et al. , 2015), (Jeong and Sim, 2017) and
(Meynet and et al. , 2019).
In this paper, we focus on three different salient
features already identified in the literature, namely:
(Song and et al. , 2014), (Tasse and et al. , 2015) and
(Limper and et al. , 2016). More precisely, (Tasse
and et al. , 2015) propose an approach that leverages
cluster uniqueness and spatial distribution to formu-
late the final saliency detection results. In contrast to
previous methods, (Song and et al. , 2014) do not
use local geometric cues: they analyse the spectral at-
tributes of the log-Laplacian spectrum to detect the
irregularities of a 3D model. Then, (Limper and et
al. , 2016) provides a multi-scale saliency value at
each vertex based on Shannon entropy by using mean
curvature.
Finally, for the vertex 3D saliency S
i
, we have
tested five different methods based on technique from
classical mean curvature to entropy: (Lee and et al. ,
2005), (Song and et al. , 2014), (Tasse and et al. ,
2015), (Leifman and et al. , 2016) and (Limper and et
al. , 2016)
1
.
Visibility Weighting. For the angle function f , five
different expressions depending on the angle α
v
of
view between the vertices and the camera are tested:
1. To favor the vertices facing the camera (with α
v
=
0) we used: cos(α
v
) and
p
cos(α
v
).
2. Inversely, to highlight the vertices on the sihouette
we tested : 1 −cos(α
v
) and 1 −
p
cos(α
v
).
1
Thanks to the dataset of (Lavou
´
e and et al. , 2018), 26
models are supplied with saliency values for four methods
and (Limper and et al. , 2016) provide their own code.
VISAPP 2024 - 19th International Conference on Computer Vision Theory and Applications
484

(a) Graphical interface of the user study (b) Set of camera positions (c) Examples of 3D models used
Figure 3: Illustrations of the technical aspects of the user study interface.
3. Finally, to take into account both the vertices fac-
ing the camera and those on the sihouette, we have
tried: 0.5 +
1−
√
cos(α
v
)
2
.
In conclusion, we have twenty five different vari-
ants of the proposed score. In order to evaluate the
interest of each proposition, we have investigated a
user study, completed by analysis of real images. The
proposed validation protocol is developed in the next
section by distinguishing how we collect datasets and
how we evaluate the quality of a selected viewpoint.
4 EVALUATION PROTOCOL
After reviewing existing evaluation methods, we
present our user study, consolidated by the use of an
image database well-known in the literature, before
introducing a new quantitative evaluation metric.
4.1 Existing Validation Protocols
Validation of the best view selection methods is cru-
cial to demonstrate the relevance of the selected views
for an object or scene. Some methods rely on a
qualitative evaluation shared by observers. These ap-
proaches do not involve external data or comparisons
with other geometric methods (V
´
azquez and et al. ,
2001), (Feixas and et al. , 2009), (Rudoy and Zelnik-
Manor, 2012) and (Habibi and et al. , 2015). Oth-
ers methods, such as (Plemenos and Sokolov, 2006),
(Lee and et al. , 2005) and (Nouri and et al. , 2015),
compare their results with those obtained from other
methods, but the evaluation remains qualitative.
In our paper, we aim to provide quantitative ev-
idence that the selected views correspond to human
preferences. To achieve this, we conducted our own
user study, collecting human preferences on a set of
3D models, see Section 4.2. Previous users study have
been done using 3D data (Blanz and Tarr, 1999), or
using comparison of two images (Secord and et al. ,
2011), or more (Leifman and et al. , 2016) but unfor-
tunately their results are not available anymore.
This kind of user evaluation is complex and ex-
pensive. In order to augment it, we propose in a sec-
ond stage to also rely on the extraction of the best
viewpoints from 2D images collected about the same
3D objects studied, see Section 4.3. Adding these im-
ages allows us to complete our evaluation by consid-
ering 3D textured objects in a particular context.
4.2 Proposed User Study
The 3D model database used in this work consists of
44 regular models. More precisely, we use 26 models
from (Lavou
´
e and et al. , 2018), and the other 18 are
freely available on the web. A subset is illustrated in
Figure 3c.
After recalling the main definitions about what is
a viewpoint and what we define as a good viewpoint,
the main question of the study is asked to the user:
Which viewpoint do you prefer to both showcase and
recognize this object? Then, each user has to study
ten different 3D models, and to choose and order three
best viewpoints to independently and positively an-
swer the main question of the study. The ten models
are randomly selected from the dataset and displayed
from a starting random viewpoint. The part of the in-
terface related to this step of the study is shown in
Figure 3a. We register one JSON file
2
per user.
The Appendix section details the recruiting pro-
cess carried out with the crowd-sourcing service of-
fered by the Prolific
3
site. We want to obtain char-
acteristic views of the objects, while minimizing the
impact of aesthetic biases inherent in individual users.
We achieve this by providing clear and precise in-
structions that emphasise relevance over aesthetics.
2
Gitlab link : https://gitlab.irit.fr/bvs-study/data.git
3
https://www.prolific.co/
Most Relevant Viewpoint of an Object: A View-Dependent 3D Saliency Approach
485

Figure 4: Statistical data of proximity score PS obtained by the ten best versions of our formula
2, specifying the intrinsic saliency method S
i
and the angle function f used in the S
a
term.
Proximity scores are computed on the 26 models of (Lavou
´
e and et al. , 2018).
Figure 5: Representation
of the 3D normal dis-
tribution centered in ma-
genta camera and associ-
ated with the term C of
the proximity score for-
mula (3).
Models are presented without textures, placed in a
neutral environment (a black screen), and initially dis-
played in random positions.
In order to harmonise the treatment of the models,
they are positioned with the Y axis running from bot-
tom to top: gravitational upwards (when it is mean-
ingful). To minimise redundancy and to maximise the
possible choices, we chose a compromise where the
user can switch between 26 different camera positions
distributed over a sphere centered on the mesh, as il-
lustrated in Figure 3b.
Each camera has a label which depends on the
value of two angles: (α, β), as illustrated in Figure
3b. For example, in the Figure 3b, the label for the
red camera is Top, that of the yellow camera is Bot-
tom and the label for the light blue camera is Face.
Cameras clusters can be made according to the val-
ues of the angle α
j
: the pink cameras form part of
the Top-Middle set of cameras, then the blue cameras
form the Middle set, and, finally the green cameras
form the Bottom-Middle set. The results of the user
study are represented by an histogram per 3D model
indicating the popularity of the 26 viewpoints by a
weight
4
, see examples in Figure 7 and Figure 8.
4.3 Consolidation with Images
We have also collected images from the Object-
net3D (Xiang and et al. , 2016) database. Among
our models, 22 correspond to a category in Object-
net3D where each image is associated a viewpoint.
We have projected the different viewpoints of a given
object category onto the study sphere. Then, as in the
post-processing of the user study, (described in the
appendix section), we have computed the distribution
of the image views on the 26 study viewpoints. In
4
The appendix section details the computation of 26
viewpoints positions and weights for each 3D model.
this way, we determine which viewpoints are the most
used when users take a photo, results are explained in
Section 6.2.
4.4 New Evaluation Metric
To evaluate coherence with respect to user viewpoint
selection, we defined a metric to determine a prox-
imity score PS that represents the closeness between
a given point of view and the one chosen by users.
Given a mesh M, a determined best viewpoint
g
pov
M
X
by a geometric method X and the best viewpoint
g
pov
M
U
chosen by users, this metric is defined by:
PS
M
X
= max(C(
g
pov
M
X
,
g
pov
M
U
),W(
g
pov
M
X
)) (3)
More precisely:
• C(
g
pov
M
X
,
g
pov
M
U
) is the 3D normal distribu-
tion (Chave, 2015), centered in
g
pov
M
U
, with support
σ = 1.3 and translated to range [0,1]. This term
measures the amount of information common to two
viewpoints i.e. quantifies the information they share.
The impact of the numeric value chosen for σ is illus-
trated in the Figure 5.
• W(
g
pov
M
X
) is the weight associated with the
g
pov
M
X
in the histogram of model i, divided by the
maximum weight of the histogram to range [0, 1].
This term takes into account the views of all users,
not just a single view.
In the case where
g
pov
M
X
does not correspond ex-
actly to
g
pov
M
U
, there are two situations in which
g
pov
M
X
is considered relevant to human opinion. First,
it is possible that
g
pov
M
X
is a viewpoint that is not
very popular with users but is semantically very close
to
g
pov
M
U
: two juxtaposed viewpoints on the sphere
can share a large number of visible features. Thus
VISAPP 2024 - 19th International Conference on Computer Vision Theory and Applications
486
a viewpoint contained within the close neighborhood
of the user viewpoint will be considered as accept-
able proportionally to its distance from the exact po-
sition. Second,
g
pov
M
X
can be a viewpoint almost as
popular as
g
pov
M
U
, which corresponds to a meaningful
viewpoint. After several empirical tests with different
combinations, the use of the maximum allows us to
consider these two situations. This evaluation metric
is used in the rest of the paper both to choose the best
configuration of the proposed method and to compare
to state of the art approaches.
5 EVALUATION FOR PROPOSED
METHOD
5.1 Saliency of Visible Vertices
In order to choose among the vertex saliency mea-
sures S
i
and the angle function f discussed in Section
3.2, we compute the proximity score for each avail-
able version of our formula, for all models. Our for-
mula has to provide best viewpoints that make sense
to humans and are aligned with human reasoning.
According to the Figure 4, which summarized the
results in the form of a box-and-whisker diagrams,
the proposed point of view score best performs us-
ing (Limper and et al. , 2016)
5
for computing S
i
and
cos(α
v
) for the angle function f . The angle functions
in the top 10 are those that highlight the vertices fac-
ing the camera. We could expect the silhouette to give
important information, but favouring silhouette prob-
ably also favours accidental views (Figure 1b).
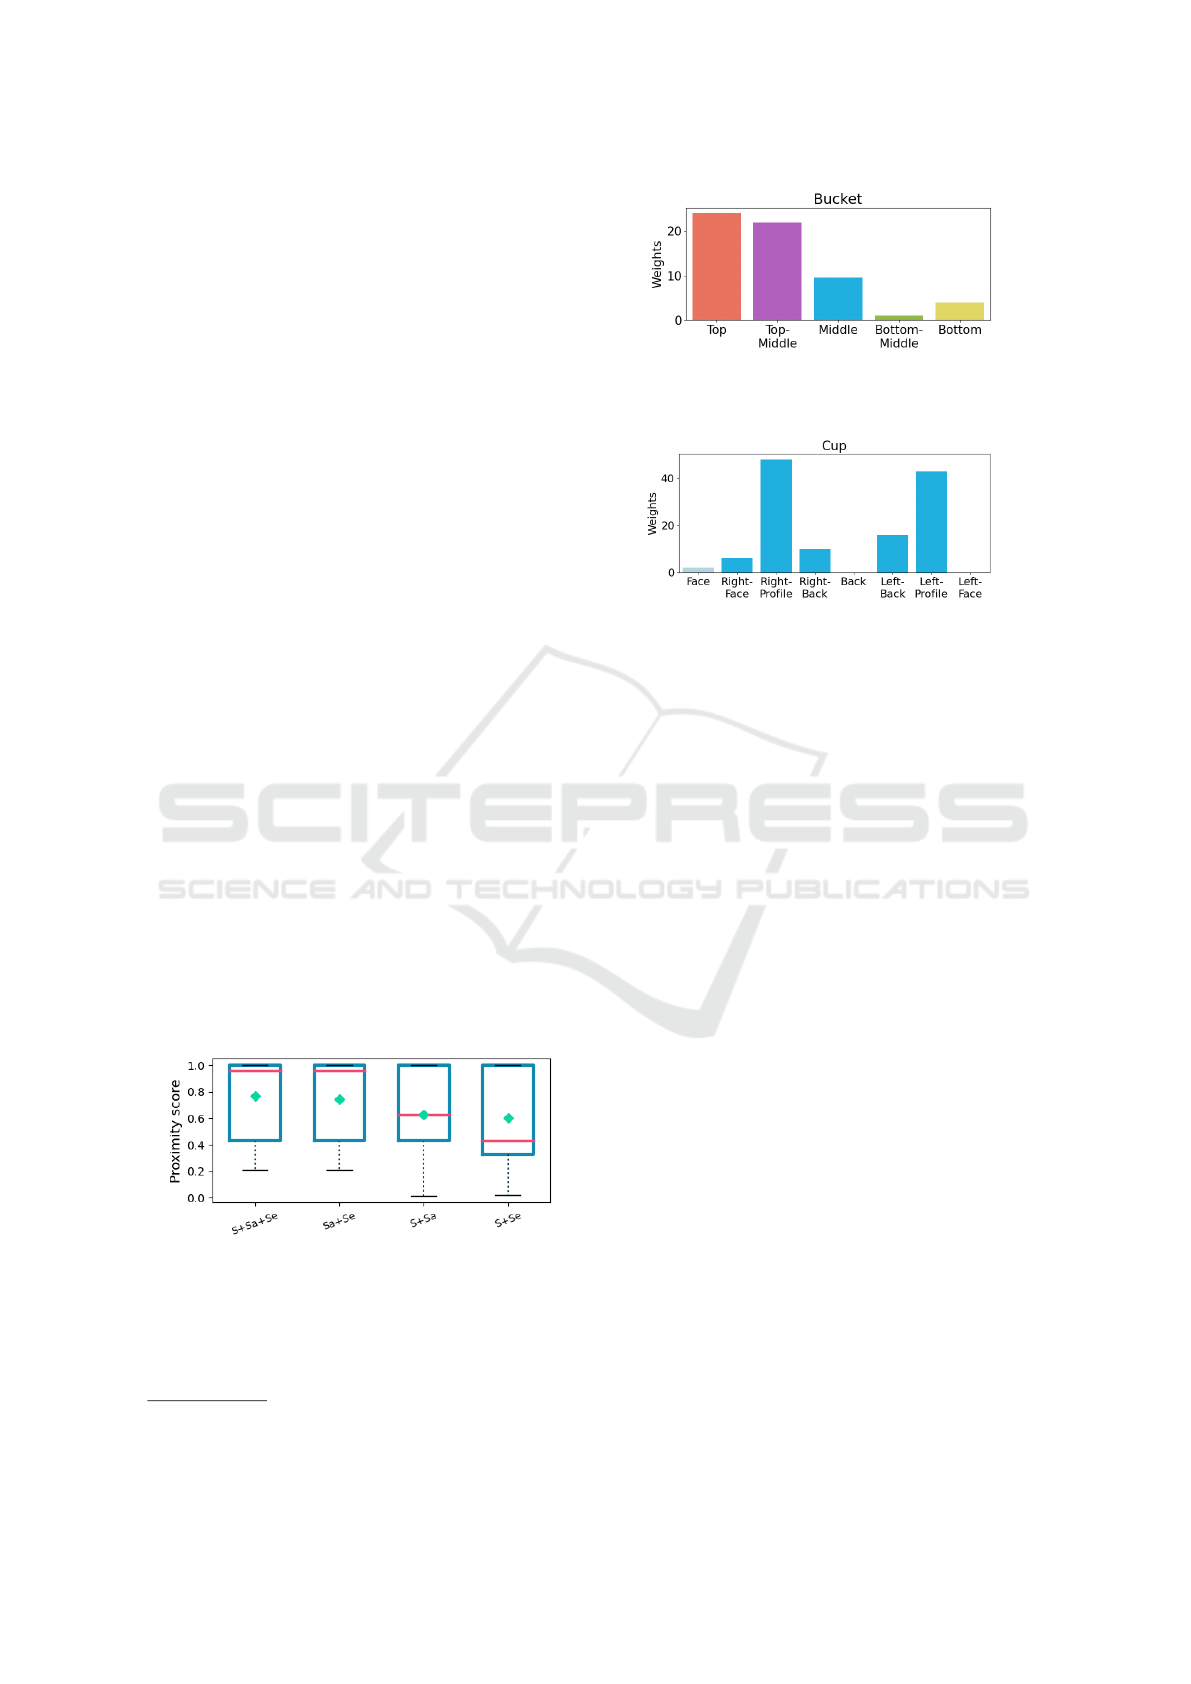
5.2 Ablation Study
Figure 6: The ablation study highlights that the three terms
S, S
e
and S
a
are contributing and, in particular, S improves
the average by ∼ 0.02.
To show the importance of each term in our for-
mula 2, we perform an ablation study. The contribu-
tion of each term is displayed in Figure 6. The left box
5
(Limper and et al. , 2016) proposed a 3D saliency not
a best view selection method.
(a) Example of a container object: comparing the lati-
tude of the selected views, we see that most views are
from above.
(b) Object with accidental and occlusion views: com-
paring the longitude of the selected views on the equa-
tor, we see that accidental and occlusion views are
avoided.
Figure 7: Histogram of weights from different viewpoints
(user study). In (a), cameras are arranged in clusters like
the camera color code shown in Figure 3b whereas in (b),
the histogram displays only the 8 blue cameras positioned
on the equator of the sphere.
(three terms sum S +S
a
+S
e
) has an average of 0.765
whereas the second one (S
a
+ S
e
) has an average of
0.746. So, the surface visibility S does contribute but
S
a
and S
e
have a stronger impact. Even if S
a
is more
important in average, note that only the models with
a face (with eyes) have their proximity score changed
by S
e
. With S
e
, the median rose from 0.627 to 0.955.
6 RESULTS AND COMPARISONS
To be able to compare with the human preferences
collected during the user study, we only consider the
26 viewpoints previously mentioned for each of the
44 meshes studied.
6.1 Analysis of User Study
Now that we know which viewpoint users prefer, we
can examine whether or not our observations are in
agreement with those of (Blanz and Tarr, 1999) and
(Secord and et al. , 2011):
• According to (Blanz and Tarr, 1999) : ”Most
participants preferred off-axis views to straight front-
or side-views”. Based on our observations, it depends
Most Relevant Viewpoint of an Object: A View-Dependent 3D Saliency Approach
487
(a) (b)
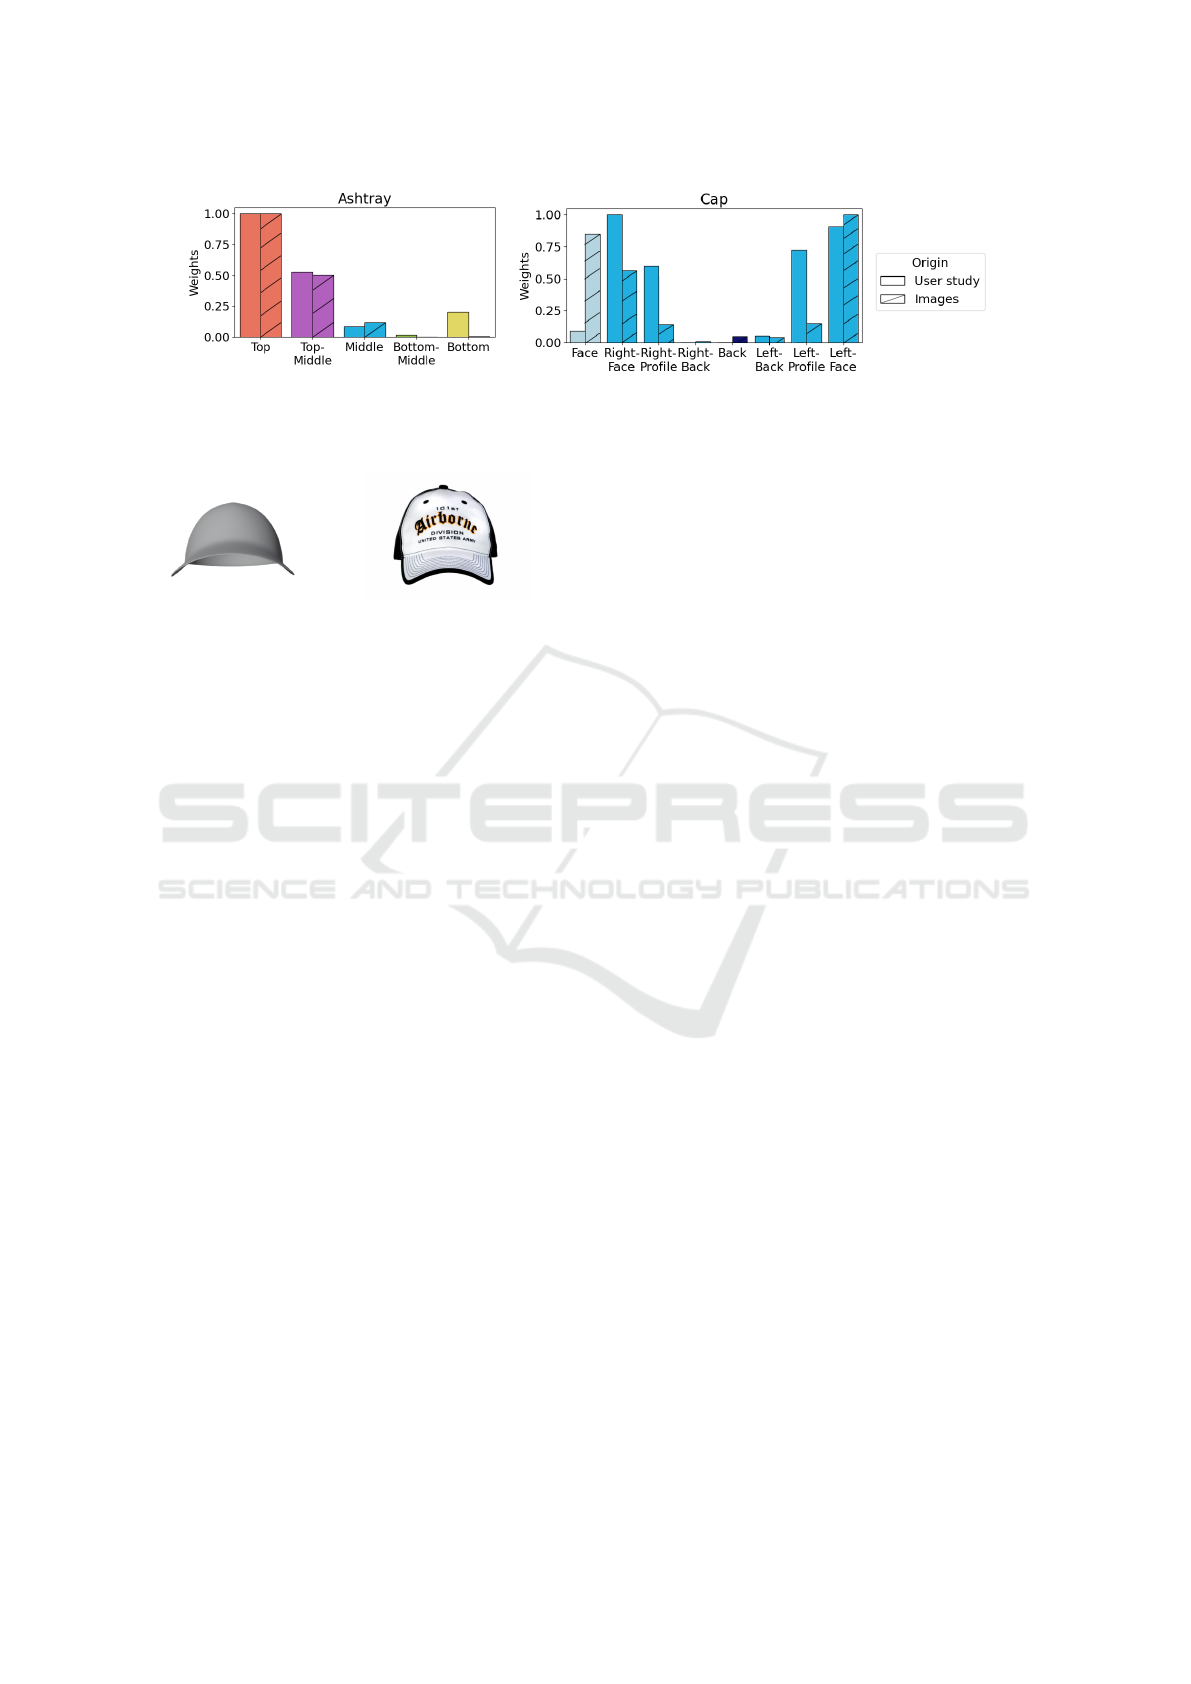
Figure 8: Comparisons of human preferences between two pairs of non-textured 3D objects and 2D image of theses objects,
like in Figure 9.
Figure 9: Non-textured 3D object (left) and an image (right)
of a cap from the viewpoint Face.
on the nature of the object. Indeed, for models rep-
resenting humans, the preferred viewpoints are those
from the front, whereas for animals or creatures, off-
axis and side views are strongly selected. Finally, for
objects, this strongly depends on their functionality,
contrary to (Blanz and Tarr, 1999) analysis. For ex-
ample, top views are largely selected for objects that
are containers. Figure 7a illustrates the distribution
of viewpoints for the Bucket model (the colors match
those of Figure 3b). The Top and Top-middle view-
points have the greatest impact.
• Like in the observations of (Blanz and Tarr,
1999), accidental views are avoided. These are the
types of view where there is a perspective problem:
for example, in Figure 1b, the handle of the cup corre-
sponds to a thick line. Figure 7b shows that this view
for the cup, labelled Back, has never been chosen by
users.
• Viewpoints where the model hides some of its
parts, as in the Figure 1c with the cup hiding his han-
dle, are also avoided. This observation is similar to
that made by (Blanz and Tarr, 1999). In the case of
the cup, this Face viewpoint is very rarely chosen, as
shown in the histogram of Figure 7b.
• We integrate unfamiliar models into our study:
mechanical parts and a protein. As in (Blanz and Tarr,
1999), these novel objects have no preferred view: all
views have been selected for the protein. But acciden-
tal views are always avoided.
• For symmetrical objects, the left-hand view was
as often selected as the right-hand view, see histogram
in Figure 7b.
• In (Secord and et al. , 2011), the importance
of the attribute that quantifies the presence of eyes in
a viewpoint is high. This means that humans prefer
to see models in the eyes, whenever possible. This
hypothesis is confirmed by the fact that users chose
frontal views when observing a human and slightly
profile views for animals and creatures.
6.2 Comparisons with Real-Life
Conditions
We analyse the best viewpoints extracted from the 2D
images collection and viewpoints presented in Section
4.3. In most cases, the most frequently used view-
points for taking pictures are similar to those selected
in the user study. For example, Figure 8a shows the
distribution of viewpoints used in the two situations:
in our experimental conditions and in real-life con-
ditions. In the case of the ashtray, the Top and Top-
Middle views are largely selected. The main factor in-
fluencing the choice of viewpoint is the functionality
of the object. However, the ashtray is often a neutral
object in terms of texture. If we take the example of
the cap, we can see that the most popular views are the
Right-Face and Left-Face views, see Figure 8b. How-
ever, the Face viewpoint is much more chosen in real
life than in the study. Indeed, logos are often visible
on the front of caps, as in Figure 9. There is a desire
to showcase the logo. In this case, texture needs to be
considered and not only geometry.
6.3 Comparisons with Studied Methods
To compare the efficiency of our formula 2, we con-
sidered two state-of-the-art geometric methods: (Lee
and et al. , 2005) and (Leifman and et al. , 2016).
Then, as previously mentioned, the dataset (Lavou
´
e
and et al. , 2018) provided the vertex saliency val-
ues for 26 models from two different methods: (Tasse
and et al. , 2015) and (Song and et al. , 2014). We
decided to use them in the two best view selection for-
mulas proposed by (Lee and et al. , 2005) and (Leif-
man and et al. , 2016), since the subject of their work
VISAPP 2024 - 19th International Conference on Computer Vision Theory and Applications
488
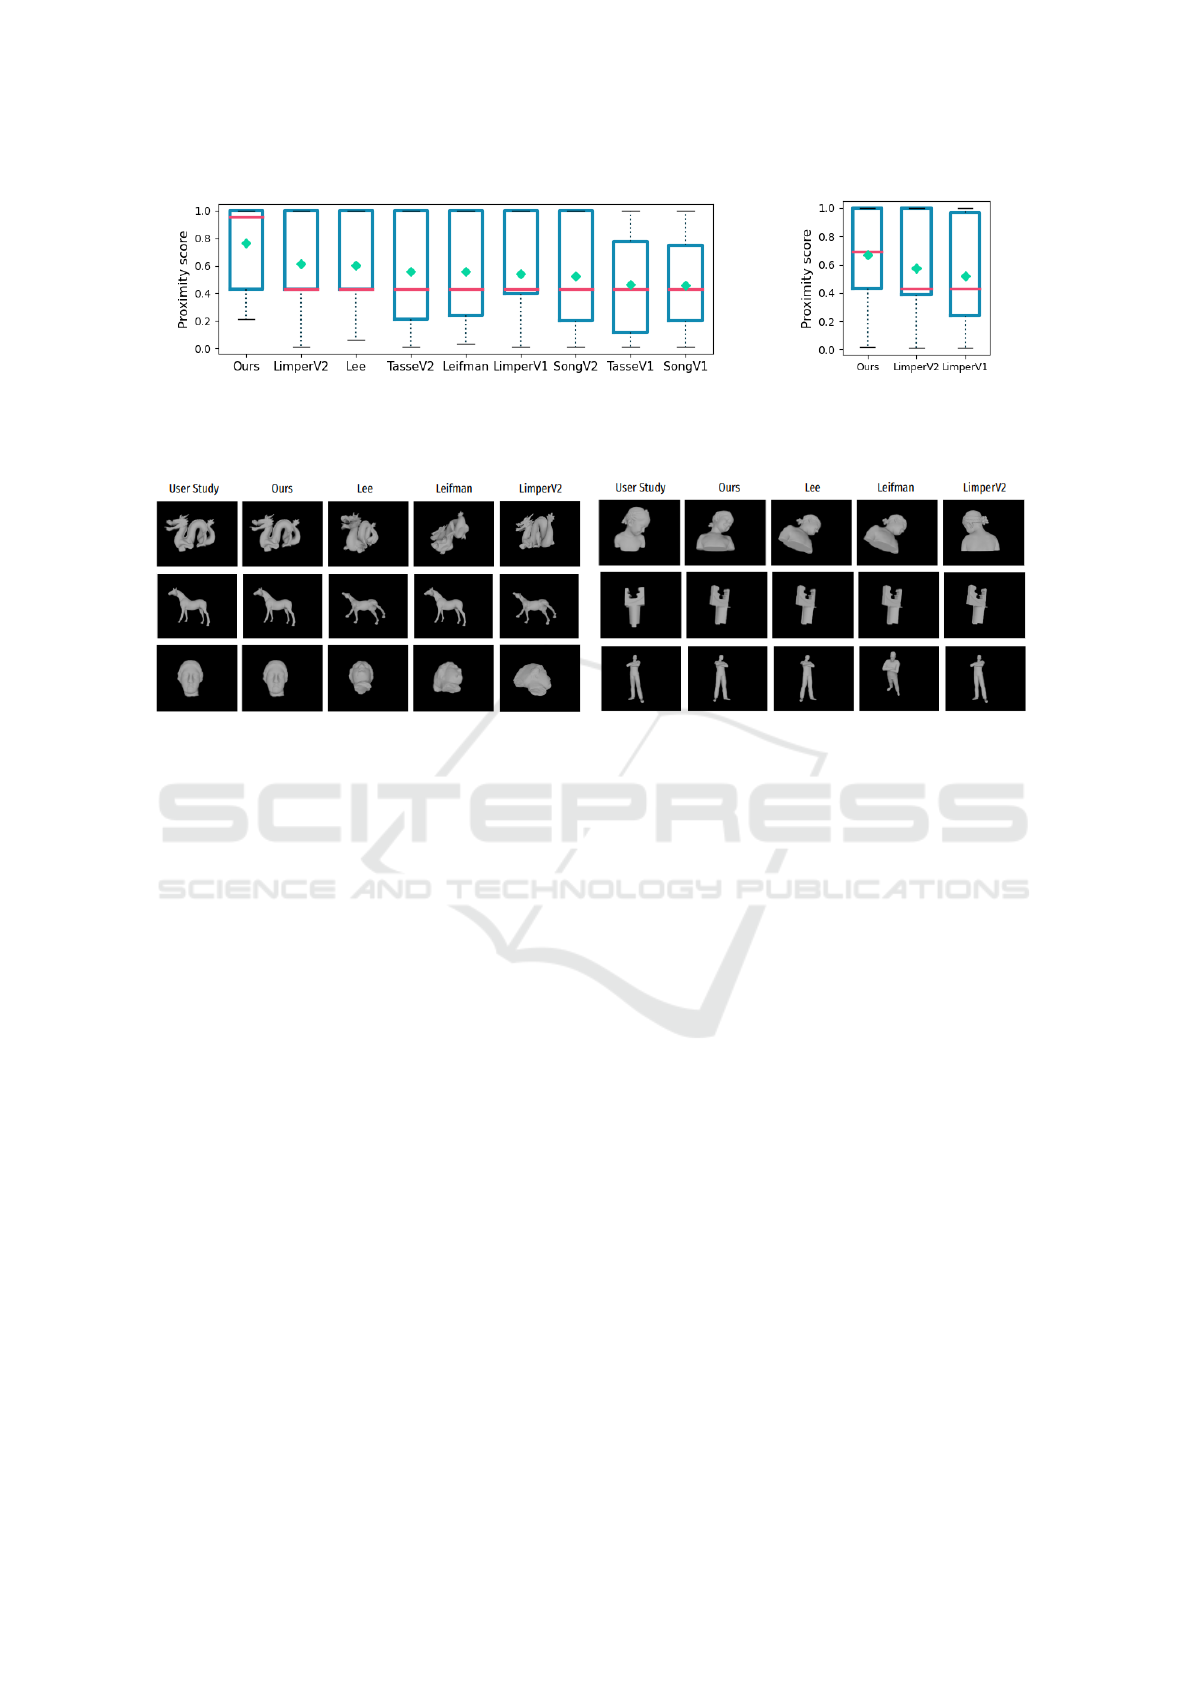
(a) (b)
Figure 10: Statistical data of proximity scores PS from the best (left) to the worst (right): (a) computed on 25 models proposed
in (Lavou
´
e and et al. , 2018) and (b) all the 43 models (prot model has been withdrawn).
(a) (b)
Figure 11: Sub-set of best selected viewpoints by users (first column of (a) and (b)), by the proposed method (second column)
and three other state-of-the-art geometric methods (from third to fifth columns). With some models, we have selected the
same view as the users (a), while on others the viewpoints are different (b) but there are coherent and proposed a point of view
that seems more informative.
is not the best view selection. These new methods are
called respectively : TasseV1 and SongV1 (TasseV2
and SongV2) with the formula of (Lee and et al. ,
2005) (formula of (Leifman and et al. , 2016)). Fi-
nally, to have a common method for all 44 models,
we use entropy-based saliency computation method
of (Limper and et al. , 2016). Once this saliency had
been calculated for each vertex of models, we use the
best view selection formula of (Lee and et al. , 2005)
and (Leifman and et al. , 2016) to obtain a new ge-
ometric method, respectively named LimperV1 and
LimperV2.
Each model has a best viewpoint for each of the
nine studied methods. The proximity scores PS of
each model for each studied methods are shown in
Figure 10. In the first instance, after studying the re-
sults obtained by the prot model (shown in the up-
per right-hand of Figure 3c), no view was more rele-
vant than an other: this model was removed from our
study. In Figure 10a, we compare the best version of
our formula with eight state-of-the-art methods. As
can be seen, the diagram of our method is the best:
50% of models obtain a score above 0.955, while the
other methods have a median of 0.43 at most. On av-
erage, our method achieves a proximity score of 0.76,
while the others do not exceed 0.61. Same results are
obtained when considering the set of all models stud-
ied in Figure 10b.
Moreover, some visual results are presented in
Figure 11. We can see that some of our viewpoints, in
(a), are exactly the same, unlike those of the other two
geometric methods. Thanks to our purely geomet-
ric method, we were able to find a viewpoint chosen
with subjective bias. In (b), we wanted to show the
cases where our viewpoint and that of the users differ.
For example, in the first line with Bimba model, our
viewpoint may be considered less aesthetically pleas-
ing, but this is intentional, as it highlights the facial
features, particularly the eyes. Secondly, the point of
view chosen by users for the mechanical piece in the
second line is an accidental one, so the view deter-
mined by the three geometric methods removes this
perspective ambiguity. Finally, the selected point of
view by the users for the man with arms crossed is
also aesthetic and specific to human culture whereas
our point of view better highlights the details of the
position: the crossed arms and the face.
Most Relevant Viewpoint of an Object: A View-Dependent 3D Saliency Approach
489

7 CONCLUSION
We have presented a new measure to select best view-
point of a 3D object. The advantage of this contribu-
tion relies on the fact that we consider both aspects
(saliency and visibility). Being view-dependent leads
to a more realistic saliency score. Then we have con-
ducted an original and intensive evaluation to better
study the interest of the proposition. Compared to ref-
erence approaches, our method selects the viewpoints
that are the most similar to user selection. Our vi-
sual analysis also highlights that when our approach
differs from the user study, it still proposes and inter-
esting view (maybe free from human biases).
In future work, we plan to work with textured
models in order to find the most relevant views for a
textured object, and close the gap with the viewpoints
defined by images.
REFERENCES
An, G. and et al. (2016). Mesh simplification using hybrid
saliency. In IEEE International Conference on Cyber-
worlds.
Blanz, V. and Tarr, M. (1999). What object attributes deter-
mine canonical views? Perception.
Chave, A. (2015). A note about gaussian statistics on a
sphere. Geophysical Journal International.
Fabricatore, C. and et al. (2002). Playability in action
videogames: A qualitative design model. Human-
Computer Interaction.
Feixas, M. and et al. (2009). A unified information-
theoretic framework for viewpoint selection and mesh
saliency. ACM Trans. Appl. Percept.
Habibi, Z. and et al. (2015). Good feature for framing:
Saliency-based gaussian mixture. In IEEE Int. Conf.
Intellig. Rob. Sys.
Jeong, S. and Sim, J. (2017). Saliency detection for 3d
surface geometry using semi-regular meshes. Trans.
Multimedia.
Lavou
´
e, G. and et al. (2018). Visual attention for rendered
3d shapes. In Computer Graphics Forum.
Lee, C. and et al. (2005). Mesh saliency. In ACM SIG-
GRAPH.
Leifman, G. and et al. (2016). Surface regions of interest
for viewpoint selection. PAMI.
Limper, M. and et al. (2016). Mesh saliency analysis via
local curvature entropy. In Eurographics.
Meyer, M. and et al. (2003). Discrete differential-geometry
operators for triangulated 2-manifolds. In Visualiza-
tion and Mathematics.
Meynet, G. and et al. (2019). Pc-msdm: A quality met-
ric for 3d point clouds. In Conference on Quality of
Multimedia Experience.
Miao, Y. and Feng, J. (2010). Perceptual-saliency extremum
lines for 3d shape illustration. The Visual Computer.
Nehm
´
e, Y. and et al. (2023). Textured mesh quality assess-
ment: Large-scale dataset and deep learning-based
quality metric. ACM TOG.
Nouri, A. and et al. (2015). Multi-scale mesh saliency with
local adaptive patches for viewpoint selection. Signal
Processing: Image Communication.
Plemenos, D. and Sokolov, D. (2006). Intelligent scene
display and exploration. In International Conference
GraphiCon.
Plemenos, D. and et al. (2004). On viewpoint complexity
of 3d scenes. In International Conference GraphiCon.
Rudoy, D. and Zelnik-Manor, L. (2012). Viewpoint selec-
tion for human actions. IJCV.
Rusinkiewicz, S. (2004). Estimating curvatures and their
derivatives on triangle meshes. In IEEE Symposium on
3D Data Processing, Visualization and Transmission.
Secord, A. and et al. (2011). Perceptual models of view-
point preference. ACM TOG.
Sokolov, D. and Plemenos, D. (2005). Viewpoint quality
and scene understanding. In Eurographics Symposium
on Virtual Reality.
Song, R. and et al. (2014). Mesh saliency via spectral pro-
cessing. ACM TOG.
Tasse, F. and et al. (2015). Cluster-based point set saliency.
In ICCV.
Taubin, G. (1995). Estimating the tensor of curvature of a
surface from a polyhedral approximation. In ICCV.
V
´
azquez, P. and et al. (2001). Viewpoint selection using
viewpoint entropy. In Vis., Model., and Visualizat.
Wang, S. and et al. (2015). Multi-scale mesh saliency
based on low-rank and sparse analysis in shape fea-
ture space. Computer Aided Geometric Design.
Wu, J. and et al. (2013). Mesh saliency with global rarity.
Graphical Models.
Xiang, Y. and et al. (2016). Objectnet3d: A large scale
database for 3d object recognition. In ECCV.
APPENDIX
Computing Visible Faces and Vertices. To know
which vertices are visible, first we have determined
which faces are visibles. Given a Point of View pov,
we determine which faces are facing the camera
using back face culling. More precisely, a face F is
oriented towards the camera if the cosine of the angle
α
F
between its outgoing normal
−→
n
F
and the camera
vector
−−−−−→
pov −c
F
, with c
F
the center of F, is greater
than an epsilon ε = 10
−5
. Some of these faces can
be occluded. To filter them out, we use the depth
information contained in the depth maps available for
each viewpoint. A face is considered visible if the
depth associated with the 2D projection of its center
(we take the barycenter) is the same as that contained
in the depth map. Often, the 2D coordinates of the
centers are not integer. In the following we will
VISAPP 2024 - 19th International Conference on Computer Vision Theory and Applications
490
consider: i
b
= ⌊y
cF
⌋, j
b
= ⌊x
cF
⌋, i
a
= i
b
+ 1 and
j
a
= j
b
+ 1.
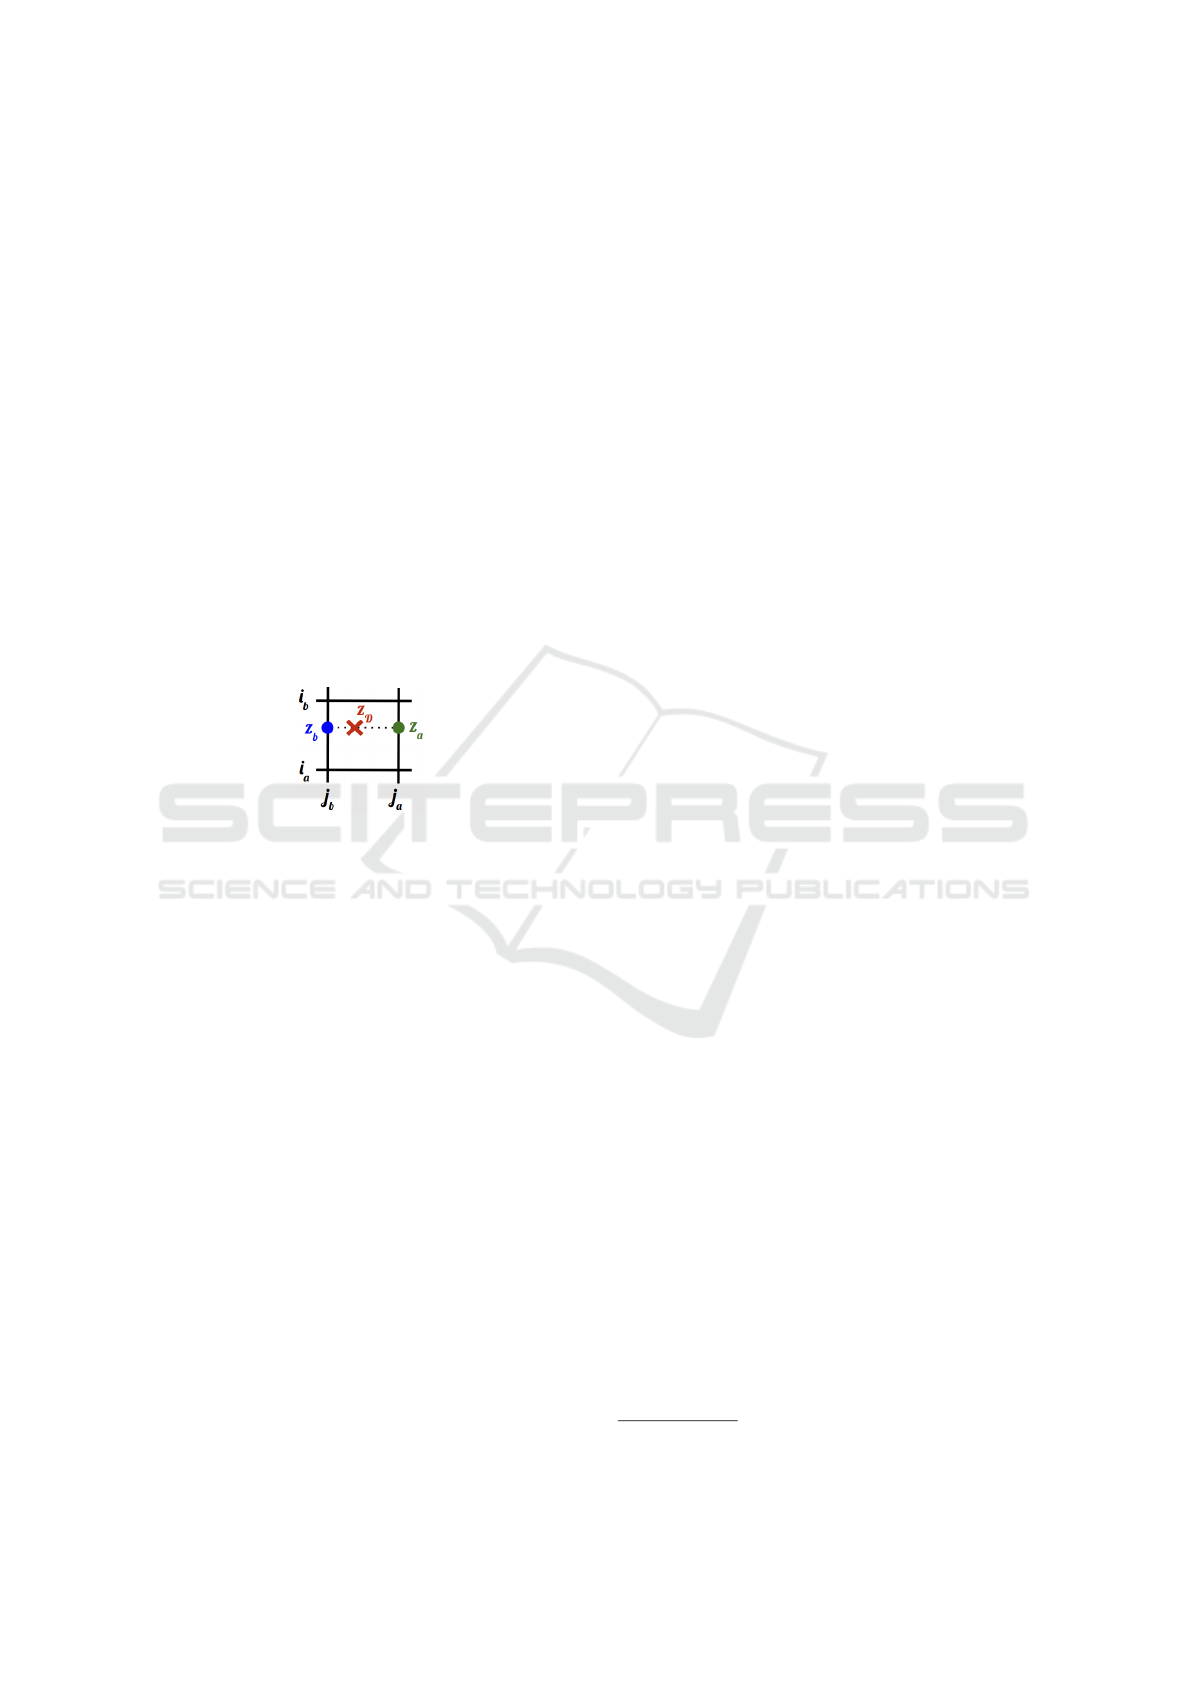
To determine the exact depth that lies in the
depth map at the center’s position, we perform
three interpolations. Specifically, given a face F,
c
F
= (x
c
F
,y
c
F
) are the 2D coordinates of its center
and z
c
F
its depth after the 2D projection. Then the
depth z
D
associated with (x
c
F
,y
c
F
) in the depth map
D is calculated as bi-linear interpolation:
• z
b
is determined with a interpolation between
(i
b
, j
b
) and (i
a
, j
b
)
• z
a
is determined with a interpolation between
(i
b
, j
a
) and (i
a
, j
a
),
• z
D
is determined with a interpolation between z
b
and z
a
.
If |z
D
−z
c
F
| ≤ 10
−2
, then F is visible.
Figure 12: Depth z
D
associated with the non-integer 2D co-
ordinates of c
F
= (x
c
F
,y
c
F
)
Then, we identify which vertices are visibles.
Given a Point of View pov, we consider a vertex to be
facing the camera if at least one of its adjacent faces
is visible. This allows us to perform an initial filter-
ing and to speed up the search process. Then, as for
faces, some vertices may be occluded. We first com-
pute for each vertex v, its normal
−→
n
v
as the unit vector
with the same direction as the sum of normals of the
face containing the vertex v. To remove vertices, we
then calculate for each of the previously selected v
vertices, the angle α
v
between their outgoing normals
−→
n
v
and the camera vector
−−−−→
pov −v. Only those vertices
v whose cos(α
v
) > 0 are kept.
User Study Details - Camera Positions. Camera
positions C
i, j
on the sphere centered on a 3D model
are defined by two angles (α
j
,β
i
) as illustrated in Fig-
ure 3b: ∀i ∈ [0,7], ∀j ∈[0, 4]
C
i, j
=
x
i j
= R cos(α
j
)cos(β
i
)
y
i j
= R sin(α
j
)
z
i j
= R cos(α
j
)sin(β
i
)
(4)
with R = 2.2, β
i
= i.π/4 and α
j
= (2 − j).π/4.
When |α
j
| = π/2 ⇒ cos(α
j
) = 0, we obtain the
same camera position eight times. Only one of them
is kept because we always have exactly the same view.
User Study Details - Participants. Following the
observations of (Nehm
´
e and et al. , 2023), to recruit
reliable users, we used the crowd-sourcing service of-
fered by the Prolific
6
site. With this platform, 203
users completed our study: 121 males and 82 females.
They are aged between 19 and 71. To filter out the
less serious users, we have evaluated three different
parameters per user: the total time to complete the
study, the time to treat one mesh and the average nav-
igation complexity (the average percentage of view-
points visited per mesh). For each parameter p, we
have computed statistical data : the lower quartile Q
p
1
and the interquartile range IQR
p
. To identify outliers,
we use the IQR method to set up an aera outside of
Q
1
. If a user has one of these three parameters smaller
than Q
p
1
−(1.5×IQR
p
), then the user is removed. Ac-
cording to these conditions, only one female user has
been retired.
User Study Details - Post processing. The goal is
to determine which viewpoints have been most se-
lected by users. As mentioned previously, in the user
study, there are 26 study viewpoints, noted POV
k
,
with k ∈ [1,26]. Given a model, a user u must se-
lect 3 ordered viewpoints : pov
u,v
, with v ∈ [1, 3].
Each selected viewpoint pov
u,v
has an impact on the
study viewpoints POV
k
. In other words, each of pov
u,v
assigns a weight p
k
u,v
to each POV
k
. These weights
are calculated with a 3D normal distribution (Chave,
2015), centered in pov
u,v
and with support σ = 0.58.
As the parametrization of camera positions is not reg-
ular in the study, a pov
u,v
can have an impact on sev-
eral POV
k
. Moreover, most of these weights p
k
u,v
are
zero, because pov
u,v
have a local impact. Next, a nor-
malization is applied to ensure that each choice pov
u,v
has the same importance. To this purpose, the sum of
the weights from pov
u,v
is normalized to 1. Finally,
to calculate the score for each POV
k
, we simply sum
the weights p
k
u,v
weighted by a factor (4 −v). Thus,
the weights of viewpoints chosen first (v = 1) will be
favoured over the weights of viewpoints chosen last
(v = 3). The formula is :
∀k ∈ [1,26], Weight
k
=
N
∑
u=1
3
∑
v=1
(4 −v).p
k
u,v
(5)
with N the number of users.
6
https://www.prolific.co/
Most Relevant Viewpoint of an Object: A View-Dependent 3D Saliency Approach
491
