
ReScore
Disease Groups Based on Multiple Machine Learnings
Utilizing the Grouping-Scoring-Modeling Approach
Emma Qumsiyeh
1a
, Miar Yousef
2
and Malik Yousef
3,4 b
1
Department of Computer Science and Information Technology, Al-Quds University, Palestine
2
Lady Davis Carmel Medical Center, Haifa, Israel
3
Department of Information Systems, Zefat Academic College, Zefat, Israel
4
Galilee Digital Health Research Center, Zefat Academic College, Zefat, Israel
Keywords: Biological Integrative Approach, Machine Learning, Feature Selection, Grouping, Scoring, Modeling, Robust
Rank Aggregation, Rescore, Biomarkers.
Abstract: The integrating of biological prior knowledge for disease gene associations has shown significant promise in
discovering new biomarkers with potential translational applications. GediNET is a recent tool that is
considered an integrative approach. In this research paper, we aim to enhance the functionality of GediNET
by incorporating ten different machine learning algorithms. A critical element of this study involves utilizing
the Robust Rank Aggregation method to aggregate all the ranked lists over the cross-validations, suggesting
the final ranked significant list of disease groups. The Robust Rank Aggregation is used to re-score disease
groups based on multiple machine learning. Moreover, a comprehensive comparative analysis of these ten
machine learning algorithms has revealed insights regarding their intrinsic qualities. This facilitates
researchers in determining which algorithm is most effective in the context of disease grouping and
classification.
1 INTRODUCTION
Recently, integrating pre-existing biological
knowledge and machine learning methods has
become a noteworthy strategy in diverse study
domains, such as bioinformatics, genomics, and
biomedical data analysis (Libbrecht & Noble, 2015).
The incorporation of current information about
biological systems and processes enhances the
accuracy, interpretability, and generalizability of
machine learning models (Gligorijević & Pržulj,
2015; Qumsiyeh & Jayousi, 2021). The random forest
algorithm has gained recognition as a resilient and
adaptable machine learning technique that effectively
leverages available biological data across a diverse
set of applications (Boulesteix et al., 2012; Qi, 2012).
Comparing various machine learning algorithms
is of utmost importance to determine the most
appropriate strategy for a specific task or problem.
Every algorithm possesses distinct strengths,
weaknesses, and assumptions that can have a
substantial influence on its performance and
a
https://orcid.org/0000-0002-3797-5851
b
https://orcid.org/0000-0001-8780-6303
suitability (Uddin et al., 2019). In this research, we
concisely analyze various prominent machine
learning methods, namely Random Forest (Ho,
1995), Support Vector Machines (SVM) (Cortes &
Vapnik, 1995), Decision Tree (Breiman et al., 2017),
Tree Bag GBM (Natekin & Knoll, 2013), KNN
(Zhang, 2016), AdaBoost (Wang, 2012), XGBoost
(Chen & Guestrin, 2016), LightGBM (Ke et al.,
2017), CatBoost (Prokhorenkova et al., 2018), and
Logistic Regressions (Stoltzfus, 2011). Additionally,
we have suggested using the robust rank aggregation
method (Kolde et al., 2012) to rescore the disease
groups utilizing the ranked group lists of each of those
ML algorithms.
The generic approach, Grouping, Scoring, and
Modeling (G-S-M), is a feature selection technique
that performs grouping sections rather than individual
feature selections. The G-S-M mainly consists of
three components. The grouping (G), the scoring (S),
and the modeling (M) components. The G component
is for detecting or extracting groups. In component G,
a biological database, that represent a biological
446
Qumsiyeh, E., Yousef, M. and Yousef, M.
ReScore Disease Groups Based on Multiple Machine Learnings Utilizing the Grouping-Scoring-Modeling Approach.
DOI: 10.5220/0012379400003657
Paper published under CC license (CC BY-NC-ND 4.0)
In Proceedings of the 17th International Joint Conference on Biomedical Engineering Systems and Technologies (BIOSTEC 2024) - Volume 1, pages 446-453
ISBN: 978-989-758-688-0; ISSN: 2184-4305
Proceedings Copyright © 2024 by SCITEPRESS – Science and Technology Publications, Lda.

knowledge, is used to create groups of genes. The
output of the G component is an et of groups.
The set of groups are serving as input to the S
component. The S component is performing scoring
and ranking of those groups. The task of the S
component is to compute a score-based machine
learning that measures its contribution to the
classification of the two-class data by computing
different performance measurements, such as
accuracy.
The M component is for training the final
machine learning model. The M component uses the
top-ranked groups by considering the genes
associated with those groups. A subdataset is
extracted and RF model is trained on the extracted
subdataset. Finally, the model is evaluated on the
testing dataset represented by those genes, and the
performance statistics are recorded.
The G-S-M treats a set of genes as a group, while
the feature spaces are transformed into groups. The
groups are determined based on pre-existing
knowledge or could be computed by applying a
specific algorithm to the feature space, such as a
clustering algorithm. The G-S-M was implemented in
many bioinformatics tools that use pre-existing
biological knowledge (Ersoz et al., 2023; Jabeer et al.,
2023; Qumsiyeh, Salah, et al., 2023; Qumsiyeh,
Yazıcı, et al., 2023; Yousef, Ülgen, et al., 2021;
Yousef et al., 2023), such as gene-disease
associations or microRNA target genes. Also, G-S-M
was implemented, where the k-means clustering
algorithm was used to detect the groups. For example,
GediNET (Qumsiyeh et al., 2022) and GediNET Pro
(Qumsiyeh, Yazıcı, et al., 2023) are G-S-M models
where disease-gene associations were used to
determine the groups. maTE (Yousef et al., 2019) is
another G-S-M model that uses microRNA gene
target associations for group detections. We refer to
(Kuzudisli et al., 2023; Yousef, Kumar, et al., 2021)
for more details,
The G-S-M performs scoring for each group in the
S component by extracting its associated sub-dataset
from the input two-class dataset for each group. Then,
an internal cross-validation is performed to assign a
score that represents the power of the group in the
classification of the diseases. In the original tool, the
Random Forest is used in both the S and M
components. In the M component, the evaluation of
the tool is performed by training the RF on the top-
ranked group genes and testing it on the test set that
was split out.
In this study, we have conducted a comparison
study to discover the effect of the machine learning
algorithm on both the S and M components.
However, the study mainly aims to see how different
machine learning algorithms score the groups. We
examine the effect on the tool's performance in the
top-ranked groups.
2 DATASETS
Our study sourced ten distinct human gene expression
datasets from the Gene Expression Omnibus (GEO)
database (Clough & Barrett, 2016). Detailed
information about the 10 datasets is presented in
Table 1. Each dataset was characterized by
identifying the disease name and the total number of
samples. Furthermore, these samples were divided
into positive and negative categories.
Table 1: Description of the 10 datasets used in the study.
GEO
Accession
Disease
Total
Samples
Negative
Samples
Positive
Samples
GDS1962 Glioma 180 23 157
GDS2545 Prostate cance
r
171 81 90
GDS2771 Lung cance
r
192 90 102
GDS3257
Lung
adenocarcinoma
107 49 58
GDS4206 Leukemia 197 157 40
GDS5499
Pulmonary
hypertension
140 41 99
GDS3837 Lung cance
r
120 60 60
GDS4516_4718
Colorectal
cance
r
148 44 104
GDS2547 Prostate cance
r
164 75 89
GDS3268 Colitis 202 73 129
3 METHOD
The GediNET tool was considered in this study for
testing the effect of the machine learning algorithm
on the S and M components. Besides, Random Forest,
Decision Tree, Support Vector Machines (SVM),
Tree Bag GBM, KNN, AdaBoost, XGBoost,
LightGBM, CatBoost, and Logistic Regressions were
used in this study.
We have updated the S component to include all
10 ML algorithms for that purpose. The one
considered in the S component will be used directly
in the M component for training and testing the
model.
The process of disease group ranking is a pivotal
component of the GediNET framework. Initially,
GediNET employed robust rank aggregation to
compute ranks for each group. This computation
relied heavily on scores derived from lists generated
over 100 MCCV iterations (Xu & Liang, 2001).
ReScore Disease Groups Based on Multiple Machine Learnings Utilizing the Grouping-Scoring-Modeling Approach
447

With the introduction of GediNET_ML, there
comes an added complexity of having multiple
ranked lists, one from each machine learning
algorithm integrated into GediNET. To reconcile
these multiple-ranked lists and produce a unified list,
we revisited the robust rank aggregation method.
Each individual ranked list from GediNET_ML was
input to the robust rank aggregation, producing an
aggregated ranked list of disease groups.
Table 2 presents the pseudo-code that describes
the main algorithm of the study.
Table 2: Pseudo-code of the main algorithm outlining the
integration of ten machine learning algorithms with the
GediNET tool.
Input: Dataset D, GediNET: Components S and M
1. Initialize GediNET_tool with components S and M
2. Define a list of machine learning algorithms:
ML_algorithms = [RandomForest, DecisionTree,
SVM, TreeBagGBM, KNN, AdaBoost, XGBoost,
LightGBM, CatBoost, LogisticRegression]
3. Update the S component to include all algorithms
from ML_algorithms
4. For each algorithm in ML_algorithms:
4.1. Set the current algorithm in the S component
4.2. Train the M component using the selected
algorithm on Dataset D
4.3. Evaluate the performance of the model on test
data
4.4. Generate a ranked list of disease groups using
the model
4.5. Store the ranked list for robust rank aggregation
5. Initialize an empty list: aggregated_ranked_list
6. For each list generated in Step 4:
6.1. Input the list to the robust rank aggregation
method
6.2. Combine the list with aggregated_ranked_list
7. Output the aggregated_ranked_list
4 EVALUATIONS
Our study comprehensively evaluated the machine
learning models, employing a 100-fold cross-
validation technique to measure performance. Each
iteration randomly splits the dataset, allocating 90%
of the subsets for training and 10% for thorough
testing and assessment. To conduct a comprehensive
assessment of the prediction abilities of our models,
we utilized a wide range of performance metrics,
including accuracy, sensitivity, specificity, F1-
measure, Area Under Curve (AUC), and precision
(Mothilal et al., 2020). The core measure of proper
classification was accuracy, while sensitivity and
specificity assessed the models' capacity to accurately
detect true positive and true negative cases,
respectively. The F1-Measure provides a
comprehensive evaluation of both precision and
recall, whereas the AUC metric evaluates the
discriminatory capability of the models. The
precision highlighted the validity of affirmative
forecasts. This enabled us to comprehensively assess
the efficacy of our models, resulting in significant
insights that can inform their practical
implementation and enhance the reliability of our
research outcomes.
5 RESULTS
In Table 3, the AUC represents the classification
performance of different machine learning models on
various datasets. Higher AUC values indicate better
discrimination between positive and negative classes.
The following are specific observations from Table 3.
Concerning Decision Trees (DT), DT performs
reasonably well, with AUC scores ranging from 0.54
to 0.9. It achieves the highest AUC on GDS1962 (0.9)
but has a relatively lower AUC on some other
datasets. Random Forest (RF) consistently performs
well, with AUC values ranging from 0.597 to 1.0. It
achieves the highest AUC on GDS3257,
GDS4516_4718, and GDS5499 (all perfect AUCs of
1.0), indicating predictive solid classification power.
Gradient Boosting Machine (GMB) shows variability
in its performance, with AUC scores ranging from
0.614 to 0.972. It performs well on GDS3837 and
GDS3257. K-Nearest Neighbors (KNN) has AUC
scores ranging from 0.464 to 0.975. It performs well
on GDS1962, GDS3257, and GDS3837. LightGBM
generally performs well, with AUC values ranging
from 0.464 to 0.976. It excels on GDS3257. Logistic
Regression has AUC scores ranging from 0.503 to
0.9. It performs reasonably well but tends to have a
lower AUC compared to ensemble methods. NB
shows AUC scores ranging from 0.741 to 0.98,
performing well on GDS4516_4718. Real AdaBoost
achieves AUC scores ranging from 0.809 to 0.975,
performing well on GDS3257. SVM has AUC scores
ranging from 0.806 to 0.975, performing well on
GDS1962 and GDS3257. XGBoost consistently
performs well, with AUC values ranging from 0.786
to 0.99. It achieves the highest AUC on GDS1962 and
GDS3257.
However, it is crucial to acknowledge that the
presentation of mean AUC values alone may not
comprehensively represent the models' performance.
BIOINFORMATICS 2024 - 15th International Conference on Bioinformatics Models, Methods and Algorithms
448

Table 3: The mean AUC of 100 iterations. The results are for the top 2 groups.
DataSet/
Mean Genes
DT RF GMB KNN Light
GBM
Logistic
Regression
NB Real
AdaBoost
SVM X
GBoost
GDS1962 0.9 0.99 0.92 0.975 0.82 0.9 0.97 0.975 0.99 0.865
GDS2545 0.639 0.856 0.821 0.831 0.712 0.741 0.809 0.8 0.786 0.835
GDS2547 0.554 0.838 0.733 0.751 0.461 0.688 0.831 0.808 0.842 0.788
GDS2771 0.554 0.647 0.614 0.704 0.573 0.606 0.718 0.668 0.679 0.674
GDS3257 0.97 1 0.96 1 0.464 0.96 0.976 0.992 0.97 0.992
GDS3268 0.54 0.776 0.762 0.72 0.527 0.671 0.643 0.639 0.798 0.743
GDS3837 0.917 0.972 0.931 0.967 0.656 0.871 0.944 0.958 0.983 0.975
GDS4206 0.463 0.597 0.469 0.629 0.472 0.503 0.64 0.586 0.608 0.558
GDS4516
_
4718 0.984 1 1 1 0.8 1 1 1 1 1
GDS5499 0.832 0.871 0.917 0.865 0.65 0.779 0.885 0.924 0.975 0.903
Mean 0.7353 0.8547 0.8127 0.8442 0.6135 0.7719 0.8416 0.835 0.8631 0.8333
Table 4: The mean number of genes for the 100 iterations. The results are for the top 2 groups.
DataSet/
Mean Genes
DT RF GMB KNN Light
GBM
Logistic
Re
g
ression
NB Real
AdaBoost
SVM X
GBoost
GDS1962 31.8 27.8 14.3 37 93.3 68.5 23.6 26.5 64.8 31
GDS2545 31.8 149 48.6 76.6 127.1 87.9 252.7 40 182.3 171.7
GDS2547 118.3 97.9 47.2 90.2 68.7 92.9 350.6 45.2 94.1 65.4
GDS2771 75.7 100.7 97.7 35.5 57.2 109.8 40.3 17.3 138.3 81.2
GDS3257 160.4 64.7 151.2 32 76.2 69.7 330 71.2 62.2 110.6
GDS3268 67.7 93 56.7 57.3 105.4 139 221.6 43 110.1 56
GDS3837 279.3 108.8 119.3 83.3 77.8 72 275.3 85.4 63.1 79.6
GDS4206 22.8 82.11 24.9 20.1 42.1 58.2 320.6 17.5 107.6 65.4
GDS4516
_
4718 100.8 41.84 30.5 68.6 34.9 45.7 90.2 17.5 53.2 34.5
GDS5499 196.1 79.63 49.6 85.9 87.2 119.7 205.2 103.1 112.3 96.5
Mean 108.47 84.548 64 58.65 76.99 86.34 211.01 46.67 98.8 79.19
The inclusion of standard error measures, which may
provide a more nuanced understanding of the
robustness of the models, could be one way to
account for the substantial variations in AUC scores
that occur across numerous folds. In contrast, the
Gradient Boosting Machine and Naive Bayes models
show greater variability in their performance across
the datasets. Consequently, while Random Forest and
XGBoost appear superior based on mean AUC
scores, a more detailed analysis that includes
variability metrics is essential to accurately assessing
their performance across diverse datasets.
Models differ in the average number of genes
used for training, as indicated in Table 4. Notably,
Naive Bayes uses a relatively high average number of
genes, while Decision Trees and Logistic Regression
use fewer genes. Random Forest and Gradient
Boosting Machine use an average of a moderate
number of genes.
The choice of the number of genes used can
influence model complexity and potentially affect
AUC scores. Using more genes can increase model
complexity, which may impact generalization. While
models like RF and XGBoost achieve high AUC
scores, they also tend to use a moderate number of
genes on average, indicating a balance between
predictive power and model complexity. Decision
Trees and Logistic Regression, which use fewer
genes, achieve decent AUC scores, suggesting they
may be more economical models. Naive Bayes stands
out for using a high number of genes while still
achieving competitive AUC scores on specific
datasets (e.g., GDS4516_4718).
5.1 Comparison of Top-Ranked
Diseases by 5 Machine Learning
Models
We have selected 5 ML models to perform deep
analysis on the top 100 diseases ranked by each
model. Each ML model output a table with its top 100
ranked disease groups.
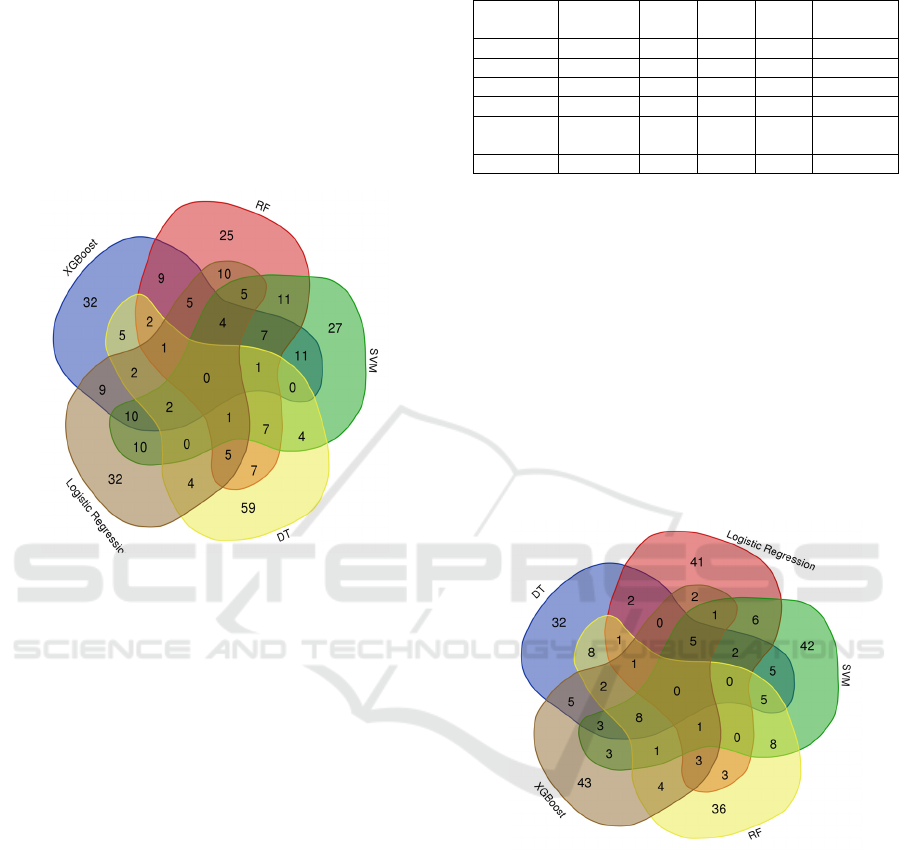
In our analysis of the interactions table associated
with Figure 1, and while performing a deep analysis for
the most common disease among those selected 5 ML,
we observe that SQUAMOUS CELL CARCINOMA
OF LUNG disease appears as intersections of Logistic
Regression, RF, SVM and XGBoost.
ReScore Disease Groups Based on Multiple Machine Learnings Utilizing the Grouping-Scoring-Modeling Approach
449
Leukemia appears in several rows with different
subtypes (e.g., ACUTE MONOCYTIC LEUKEMIA,
ADULT ACUTE LYMPHOCYTIC LEUKEMIA).
The disease is common among multiple models. The
MALIGNANT NEOPLASM OF COLON disease is
common among several models, including RF, SVM,
DT, and Logistic Regression. Besides, the
MALIGNANT NEOPLASM OF PANCREAS
(Pancreatic cancer) disease is common among RF,
SVM, DT, Logistic Regression, SVM, and XGBoost.
Figure 1: The Intersection of Top 100 Ranked Diseases by
5 Machine Learning Models.
5.2 Analysis of Jaccard Similarity
Among Machine Learning Models'
Disease Predictions
The Jaccard similarity in Table 5 provides a measure
of similarity between different lists of diseases
generated by various machine learning models.
Higher Jaccard similarity values indicate more
significant overlap or similarity between disease lists.
XGBoost and RF have the highest similarity among
the models (0.01). SVM has slightly lower similarity
with XGBoost and RF (0.01 and 0.02, respectively).
Decision Tree and Logistic Regression have the
lowest similarity with the other models (mostly 0.00).
The average similarity across all models is
moderate, ranging from 0.16 to 0.19. This suggests
some commonality in the disease predictions across
models, but they also have differences.
In summary, while there is some overlap in
disease predictions among the machine learning
models, they also exhibit distinct differences in the
diseases they identify as important. This can be
valuable in ensemble learning or considering diverse
perspectives in disease prediction tasks.
Table 5: Jaccard Similarity Comparison of Common
Disease Predictions Among Machine Learning Models.
X GBoost RF SVM DT Logistic
Regression
XGBoost 1.00 0.01 0.01 0.00 0.01
RF 0.01 1.00 0.02 0.00 0.02
SVM 0.01 0.02 1.00 0.00 0.02
DT 0.00 0.00 0.00 1.00 0.00
Logistic
Regression
0.01 0.02 0.02 0.00 1.00
All Lists 0.17 0.19 0.17 0.05 0.16
5.3 Analysis of Jaccard Similarity
Among Machine Learning Models'
Genes Predictions
In this section, we have considered the GDS1962
(Disease = Glioma-derived stem cell factor effect on
angiogenesis in the brain) dataset with its top 100
ranked genes of each of the 5 selected ML models.
The genes are ranked based on their associations with
the disease group during the scoring and ranking
stage in GediNET. The Robust Rank Aggregation
method (Kolde et al., 2012) is used to score and rank
those genes for each ML model
.
Figure 2: The intersection of Top 100 Ranked Genes by 5
Machine Learning Models.
In our analysis of the interactions table associated
with Figure 2, we have identified that among the
various models examined, DT, RF, SVM, and
XGBoost stand out as having the most intersections,
with 8 shared genes. These genes are CD44, TP53,
VIM, NES, IGFBP2, EZH2, VEGFA, and
EIF4EBP1. Additionally, RF and SVM models share
8 genes, including CEBPD, TNC, TEAD1,
CDKN2C, DNMT1, HAS2, TYMS, and ANXA5.
It's worth noting that while these models share
some common genes, they also exhibit a significant
degree of uniqueness. For instance, SVM has 42 out
BIOINFORMATICS 2024 - 15th International Conference on Bioinformatics Models, Methods and Algorithms
450

of 100 genes not found in any of the other models,
while XGBoost has 43 out of 100 genes that are
unique to it. This variety in gene selection suggests
that each model has its strengths and preferences
regarding gene selection. Knowing these differences
can help with future research and analysis in the field.
5.4 Aggregating Multiple Algorithmic
Rankings Using Robust Rank
Aggregation
Here, we tackle the problem of aggregating rankings
from ten different machine learning algorithms, each
run on a subset of groups, to produce unique rankings
using the Robust Rank Aggregation technique. The
objective is to create a unified ranking that robustly
represents the collective preferences of the
algorithms. To achieve this, we follow a systematic
approach. First, we initialize an empty list to
accumulate the rankings from each of the ten
algorithmically generated files. Subsequently, we
iterate through the files, extract the rankings, and
store them in an aggregate list of ranks. Once all
rankings are gathered, we employ the Robust Rank
Aggregation algorithm to harmonize these diverse
rankings into a single, comprehensive ranking of the
groups. Due to the specific implementation and
choice of the library for the aggregation process, the
details may vary. Finally, we save the re-ranked
groups to a designated output file, allowing for further
analysis or application of the consolidated ranking.
Table 6 illustrates the final aggregated list. This
procedure guarantees the production of a strong,
aggregated ranking that incorporates the findings of
several machine learning algorithms, offering a useful
tool for analysis and decision-making.
Table 6 presents the aggregated rankings of
various disease groups based on consolidating
outputs from ten machine-learning algorithms. The
Table 6: Final aggregated list of disease group rankings,
generated by combining the results of ten machine learning
algorithms through the Robust Rank Aggregation approach.
Disease p-value
ADENOMA OF LARGE INTESTINE 2.33442E-12
ACUTE MONOCYTIC LEUKEMIA 2.03267E-11
ENDOMETRIAL CARCINOMA 8.93323E-10
CHILDHOOD EPENDYMOMA 2.78325E-09
RENAL CARCINOMA 3.27519E-09
ADENOCARCINOMA OF LUNG
(DISORDER)
4.05483E-09
ADULT MEDULLOBLASTOMA 6.48745E-09
NEUROFIBROMA 1.00241E-08
diseases are listed alongside their corresponding p-
values, signifying their statistical significance. The
diseases range from "ADENOMA OF LARGE
INTESTINE" with the lowest p-value, indicating the
highest significance, to "ADENOCARCINOMA OF
PANCREAS." The table showcases the power of the
Robust Rank Aggregation approach in synthesizing
diverse algorithmic outputs into a unified ranking.
6 DISCUSSION AND
CONCLUSIONS
The incorporation of ten different machine learning
(ML) algorithms into GediNET represents a
significant advancement in the field of disease
grouping significance investigations. Our study
improved the GediNET tool's functionality and gave
a thorough understanding of the efficacy and
applicability of several machine learning algorithms
in this field.
A noteworthy finding from our research is that
models, especially the Random Forest and XGBoost
algorithms, have similar gene selections. The co-
occurrence of 10 genes, such as MDM2, IL6, and
VEGFA, highlights the possible significance of these
genes in the classification of diseases. However, the
notable uniqueness in gene selection that XGBoost
and SVM displayed—42 and 43 distinct genes,
respectively—points to the various advantages and
inclinations of these models. Diversity like this could
provide a more comprehensive viewpoint and
possibly highlight various aspects of the biological
material being studied. The robust, aggregated
ranking produced by harmonizing the insights of
multiple ML algorithms offers a holistic perspective
that has the potential to revolutionize decision-
making processes and analyses in bioinformatics and
genomics.
Observing the degree of distinct gene selections
made by models like SVM and XGBoost was
remarkable. Unexpectedly high degrees of
differentiation raise concerns about the strengths and
inherent biases of individual algorithms regarding
disease classification.
Compared to our earlier work, the Random Forest
technique has proven essential to utilizing biological
data. Furthermore, our research demonstrated the
potential of additional algorithms such as SVM,
XGBoost, and others. The findings show that
although RF is still a good option, expanding the
algorithmic approach can produce more insightful
results.
ReScore Disease Groups Based on Multiple Machine Learnings Utilizing the Grouping-Scoring-Modeling Approach
451

Like all studies, our research has its limitations.
The accuracy and completeness of the input data
determine how well machine learning algorithms
work and provide results. Despite our best efforts to
ensure thorough feature selection and data
pretreatment, biases present in the original datasets
may nevertheless affect the outcomes. Additionally,
the choice of hyperparameters and model
configurations can affect the algorithms'
performance, which we aimed to optimize but might
not be the best for all scenarios.
Future research could go deeper into
comprehending the precise causes for the distinct
gene selections of various models, given the insights
from our current analysis. To further improve the
precision and applicability of disease classification, it
may be worthwhile to investigate integrating more
complex or specialized algorithms or even ensemble
approaches that combine the best features of several
algorithms corporating feedback loops, which allow
for continuous learning from fresh data to improve
and refine the disease's grouping significance. This
should be a consideration in GediNET's progress.
In conclusion, our efforts to enhance GediNET
have opened new horizons for understanding disease
groupings. At the same time, we've made significant
advances in the process of exploration and refinement
in this domain. The combination of biology and
machine learning may lead to more accurate, tailored,
and successful disease knowledge and treatment in
the future.
ACKNOWLEDGEMENTS
The work of M.Y. has been supported by the Zefat
Academic College.
REFERENCES
Boulesteix, A.-L., Janitza, S., Kruppa, J., & König, I. R.
(2012). Overview of random forest methodology and
practical guidance with emphasis on computational
biology and bioinformatics: Random forests in
bioinformatics. Wiley Interdisciplinary Reviews: Data
Mining and Knowledge Discovery, 2(6), 493–507.
https://doi.org/10.1002/widm.1072
Breiman, L., Friedman, J. H., Olshen, R. A., & Stone, C. J.
(2017). Classification And Regression Trees (1st ed.).
Routledge. https://doi.org/10.1201/9781315139470
Chen, T., & Guestrin, C. (2016). XGBoost: A Scalable Tree
Boosting System. Proceedings of the 22nd ACM
SIGKDD International Conference on Knowledge
Discovery and Data Mining, 785–794. https://doi.org/
10.1145/2939672.2939785
Clough, E., & Barrett, T. (2016). The Gene Expression
Omnibus Database. Methods in Molecular Biology
(Clifton, N.J.), 1418, 93–110. https://doi.org/10.1007/
978-1-4939-3578-9_5
Cortes, C., & Vapnik, V. (1995). Support-vector networks.
Machine Learning, 20(3), 273–297. https://doi.org/
10.1007/BF00994018
Ersoz, N. S., Bakir-Gungor, B., & Yousef, M. (2023).
GeNetOntology: Identifying Affected Gene Ontology
Groups via Grouping, Scoring and Modelling from
Gene Expression Data utilizing Biological Knowledge
Based Machine Learning. Frontiers in Genetics.
Gligorijević, V., & Pržulj, N. (2015). Methods for
biological data integration: Perspectives and
challenges. Journal of The Royal Society Interface,
12(112), 20150571. https://doi.org/10.1098/rsif.2015.0
571
Ho, T. K. (1995). Random decision forests. Proceedings of
3rd International Conference on Document Analysis
and Recognition, 1, 278–282 vol.1. https://doi.org/
10.1109/ICDAR.1995.598994
Jabeer, A., Temiz, M., Bakir-Gungor, B., & Yousef, M.
(2023). miRdisNET: Discovering microRNA
biomarkers that are associated with diseases utilizing
biological knowledge-based machine learning.
Frontiers in Genetics, 13, 1076554. https://doi.org/
10.3389/fgene.2022.1076554
Ke, G., Meng, Q., Finley, T., Wang, T., Chen, W., Ma, W.,
Ye, Q., & Liu, T.-Y. (2017). LightGBM: A Highly
Efficient Gradient Boosting Decision Tree. Advances in
Neural Information Processing Systems, 30.
https://proceedings.neurips.cc/paper/2017/hash/6449f4
4a102fde848669bdd9eb6b76fa-Abstract.html
Kolde, R., Laur, S., Adler, P., & Vilo, J. (2012). Robust
rank aggregation for gene list integration and meta-
analysis. Bioinformatics, 28(4), 573–580.
https://doi.org/10.1093/bioinformatics/btr709
Kuzudisli, C., Bakir-Gungor, B., Bulut, N., Qaqish, B., &
Yousef, M. (2023). Review of Feature selection
approaches based on Grouping of features. PeerJ.
Libbrecht, M. W., & Noble, W. S. (2015). Machine learning
applications in genetics and genomics. Nature Reviews
Genetics, 16(6), 321–332. https://doi.org/10.1038/
nrg3920
Mothilal, R. K., Sharma, A., & Tan, C. (2020). Explaining
machine learning classifiers through diverse
counterfactual explanations. Proceedings of the 2020
Conference on Fairness, Accountability, and
Transparency, 607–617. https://doi.org/10.1145/33510
95.3372850
Natekin, A., & Knoll, A. (2013). Gradient boosting
machines, a tutorial. Frontiers in Neurorobotics, 7.
https://doi.org/10.3389/fnbot.2013.00021
Prokhorenkova, L., Gusev, G., Vorobev, A., Dorogush, A.
V., & Gulin, A. (2018). CatBoost: Unbiased boosting
with categorical features. Advances in Neural
Information Processing Systems, 31. https://proceed
BIOINFORMATICS 2024 - 15th International Conference on Bioinformatics Models, Methods and Algorithms
452

ings.neurips.cc/paper/2018/hash/14491b756b3a51daac
41c24863285549-Abstract.html
Qi, Y. (2012). Random Forest for Bioinformatics. In C.
Zhang & Y. Ma (Eds.), Ensemble Machine Learning:
Methods and Applications (pp. 307–323). Springer.
https://doi.org/10.1007/978-1-4419-9326-7_11
Qumsiyeh, E., & Jayousi, R. (2021). Biomedical
Information Extraction Pipeline to Identify Disease-
Gene Interactions from PubMed Breast Cancer
Literature. 2021 International Conference on
Promising Electronic Technologies (ICPET), 1–6.
Qumsiyeh, E., Salah, Z., & Yousef, M. (2023).
miRGediNET: A comprehensive examination of
common genes in miRNA-Target interactions and
disease associations: Insights from a grouping-scoring-
modeling approach. Heliyon, 9(12), e22666.
https://doi.org/10.1016/j.heliyon.2023.e22666
Qumsiyeh, E., Showe, L., & Yousef, M. (2022). GediNET
for discovering gene associations across diseases using
knowledge based machine learning approach. Scientific
Reports, 12(1), Article 1. https://doi.org/10.1038/s415
98-022-24421-0
Qumsiyeh, E., Yazıcı, M., & Yousef, M. (2023).
GediNETPro: Discovering Patterns of Disease Groups.
Proceedings of the 16th International Joint Conference
on Biomedical Engineering Systems and Technologies
- BIOINFORMATICS, 195–203. https://doi.org/10.52
20/0011690800003414
Stoltzfus, J. C. (2011). Logistic Regression: A Brief Primer.
Academic Emergency Medicine, 18(10), 1099–1104.
https://doi.org/10.1111/j.1553-2712.2011.01185.x
Uddin, S., Khan, A., Hossain, M. E., & Moni, M. A. (2019).
Comparing different supervised machine learning
algorithms for disease prediction. BMC Medical
Informatics and Decision Making, 19(1), 281.
https://doi.org/10.1186/s12911-019-1004-8
Wang, R. (2012). AdaBoost for Feature Selection,
Classification and Its Relation with SVM, A Review.
Physics Procedia, 25, 800–807. https://doi.org/10.10
16/j.phpro.2012.03.160
Xu, Q.-S., & Liang, Y.-Z. (2001). Monte Carlo cross
validation. Chemometrics and Intelligent Laboratory
Systems, 56(1), 1–11. https://doi.org/10.1016/S0169-
7439(00)00122-2
Yousef, M., Abdallah, L., & Allmer, J. (2019). maTE:
Discovering expressed interactions between
microRNAs and their targets. Bioinformatics, 35(20),
4020–4028. https://doi.org/10.1093/bioinformatics/btz
204
Yousef, M., Kumar, A., & Bakir-Gungor, B. (2021).
Application of Biological Domain Knowledge Based
Feature Selection on Gene Expression Data. Entropy,
23(1). https://doi.org/10.3390/e23010002
Yousef, M., Ozdemir, F., Jaber, A., Allmer, J., & Bakir-
Gungor, B. (2023). PriPath: Identifying dysregulated
pathways from differential gene expression via
grouping, scoring, and modeling with an embedded
feature selection approach.
BMC Bioinformatics, 24(1),
60. https://doi.org/10.1186/s12859-023-05187-2
Yousef, M., Ülgen, E., & Uğur Sezerman, O. (2021).
CogNet: Classification of gene expression data based
on ranked active-subnetwork-oriented KEGG pathway
enrichment analysis. PeerJ Computer Science, 7, e336.
https://doi.org/10.7717/peerj-cs.336
Zhang, Z. (2016). Introduction to machine learning: K-
nearest neighbors. Annals of Translational Medicine,
4(11), 218–218. https://doi.org/10.21037/atm.2016.0
3.37
ReScore Disease Groups Based on Multiple Machine Learnings Utilizing the Grouping-Scoring-Modeling Approach
453
