
Comparative Analysis of Feature Selection Algorithms for Automated
IoT Device Fingerprinting
Ahmet Aksoy
a
, Sundeep Varma, Ganesha Moorthy, Enya Pan and Gorkem Kar
b
Department of Computer Science and Cybersecurity, University of Central Missouri, Warrensburg, MO, 64093, U.S.A.
Keywords:
Genetic Algorithms, Ant Colony Optimization, Artificial Bee Colony, Feature Selection Algorithms, Filter
Methods, Wrapper Methods, Embedded Methods, Machine Learning, IoT Device Fingerprinting.
Abstract:
IoT devices are increasingly becoming a part of our daily lives. As such, there is a growing emphasis on
enhancing their security, which will also ensure the security of the networks to which they belong. Identifying
and isolating vulnerable devices from the network is crucial to increase overall security. In this paper, we
demonstrate the contribution of various feature selection algorithms used with Decision Tree classifiers to
the problem of detecting vendors and types of IoT devices. We use a single TCP/IP packet originating from
each device and utilize their packet header field values to capture their unique fingerprints automatically.
We compare several algorithms from the Filter, Wrapper, Embedded, and Search Optimization domains of
feature selection and indicate which works best for individual scenarios. We utilize the IoT Sentinel dataset
and achieve 95.3% accuracy in classifying 126,209 unique TCP/IP packets across various vendors of devices
using weighted accuracy and 88.7% accuracy using macro accuracy, which is the average of F1-Scores of all
vendors in the dataset.
1 INTRODUCTION
IoT devices are increasingly integrated into our lives
with smart thermostats, plugs, home security cam-
eras, and more. Although such devices serve our
daily live tasks conveniently, they also pose a threat
from a security perspective. Many IoT devices have
low computation power to attain battery levels for ex-
tended periods. Therefore, many such devices cannot
run cybersecurity software on them to protect them-
selves and the network to which they are connected.
Therefore, servers and other hosts within a network
need to be able to identify vulnerable devices con-
nected to them and to be able to isolate them from the
network. IoT device fingerprinting is a vital method-
ology to help combat such issues. IoT device fin-
gerprinting informs network administrators of what
type of devices they may have running on their net-
works. Thus, they would be able to detect any poten-
tially vulnerable hosts and take necessary precautions
to strengthen the security of their network.
In this study, we perform single-packet IoT de-
vice fingerprinting by selecting the most information-
gaining set of TCP/IP packet headers from different
a
https://orcid.org/0000-0002-6590-1411
b
https://orcid.org/0000-0003-0367-4409
vendors using feature selection and machine learn-
ing algorithms. Being able to determine a subset
of features and their corresponding values that help
uniquely identify devices, we can detect if a given de-
vice’s traffic hits a match, in which case we can clas-
sify a packet with a vendor or the specific brand of
IoT devices. In this study, we mainly focus on the
contributing factors of various feature selection algo-
rithms in determining the most information-gaining
features of IoT devices for their classification. We
compared several algorithms from different types of
feature selection algorithms, such as filter methods,
wrapper methods, embedded methods, and search op-
timization algorithms. We focus on two crucial com-
ponents in determining the best set of algorithms for
the task: the ability to perform classification with as
high accuracy as possible and select as few features
as possible to achieve such accuracy. The advantages
of obtaining a smaller set of features are efficiency in
utilizing machine learning algorithms and the removal
of any noisy data from the dataset, which can increase
the overall classification accuracy.
Although implementing filter, wrapper, and em-
bedded methods is pretty much straightforward,
search optimization algorithms such as Genetic Algo-
rithms (GA), Ant Colony Optimization (ACO), and
430
Aksoy, A., Varma, S., Moorthy, G., Pan, E. and Kar, G.
Comparative Analysis of Feature Selection Algorithms for Automated IoT Device Fingerprinting.
DOI: 10.5220/0012379100003648
Paper published under CC license (CC BY-NC-ND 4.0)
In Proceedings of the 10th International Conference on Information Systems Security and Privacy (ICISSP 2024), pages 430-437
ISBN: 978-989-758-683-5; ISSN: 2184-4356
Proceedings Copyright © 2024 by SCITEPRESS – Science and Technology Publications, Lda.

Artificial Bee Colony (ABC) require the implemen-
tation of a fitness function that helps determine the
contribution of a potential solution. We utilized an
approach where we aimed to increase both the accu-
racy of classification and the reduction of the number
of features selected. To determine the accuracy of the
sets of features selected by the feature selection algo-
rithms, we utilized the Decision Tree classifier, which
we previously observed in our work as being one of
the highest accuracy-yielding machine learning clas-
sifiers (Aksoy and Gunes, 2016; Aksoy et al., 2017;
Aksoy and Gunes, 2019; Rana and Aksoy, 2021).
We analyzed the performance of 14 feature se-
lection algorithms in the IoT device fingerprinting
domain. We implemented a two-layer classifier ap-
proach where we observed more than 90% accuracy
in classifying 7 out of 12 vendors of devices in the an-
alyzed dataset. We could also classify more than 9 out
of 12 vendors with more than 80% accuracy. In many
cases, we also observed that the ABC algorithm was
the highest accuracy-yielding feature selection algo-
rithm.
The rest of the paper is organized as follows:
Section 2 summarizes related work. Section 3 ex-
plains the setup methodology of feature selection al-
gorithms. Section 4 presents performances of the
classification of IoT devices using various feature se-
lection algorithms, and Section 5 concludes the paper.
2 RELATED WORK
In machine learning, feature selection is crucial in
improving classification accuracy and making predic-
tions more accurate. Many methods and domains pro-
vide various improvements and approaches to feature
selection, each capable of revealing insights and sim-
plifying machine learning classifier decision-making
by eliminating noisy data.
2.1 Genetic and Evolutionary
Algorithms for Feature Selection
Evolutionary algorithms can efficiently choose the
most relevant feature subset given a dataset. These al-
gorithms, fundamentally based on evolutionary prin-
ciples, utilize a specialized fitness function. This
function can be tailored to suit the specific nature
and demands of the problem, such as feature selec-
tion in machine learning classification. Several note-
worthy examples highlight how versatile and practical
genetic algorithms can be in selecting features. For
instance, in digital media, these algorithms have been
utilized to refine image retrieval processes and en-
hance the precision of text categorization (Wu et al.,
2011). In the cybersecurity domain, Operating Sys-
tem fingerprinting—a method used to determine the
operating system of a device remotely—has benefit-
ted from the precision of genetic algorithms, lead-
ing to more accurate detections automatically (Ak-
soy et al., 2017; Aksoy and Gunes, 2016). With
the growth of Internet of Things (IoT) devices, the
challenge of IoT device fingerprinting—identifying
unique device signatures—has also emerged. Ge-
netic algorithms have also paved the way for en-
hanced identification and categorization (Aksoy and
Gunes, 2019). Across these diverse applications, ge-
netic algorithms have often outperformed other meth-
ods, leading to superior accuracy rates in classifica-
tion tasks, affirming their invaluable role in optimiz-
ing feature selection.
2.2 Feature Selection in Network and
System Security
In various approaches, performing accurate predic-
tions becomes essential when identifying cybersecu-
rity incidents. Attackers often deploy varied tactics,
and to counteract these, security systems need to de-
tect unique features and behaviors indicative of such
malicious activities. Multiple studies emphasize the
importance of feature selection in intrusion detec-
tion (Thakkar and Lohiya, 2023; Alghanam et al.,
2023; Sangaiah et al., 2023). By carefully selecting
the most contributing features, these works enhance
the efficiency and accuracy of detecting unauthorized
access or breaches. A study by (Gharehchopogh et al.,
2023) emphasizes Botnet Detection in IoT, underlin-
ing the need for targeted feature selection to identify
these network-compromising threats effectively. De-
nial of Service (DoS) is another attack designed to
overload systems and make them unavailable to users.
(Maslan et al., 2023) introduces an approach for
DoS detection using Hybrid N-Gram and expertly tai-
lored feature selection methodologies. Furthermore,
(Nkongolo, 2023) presents an advanced method for
detecting malware based on cyclostationary features,
strengthening the capabilities of NIDSs. In our con-
tributions to this dynamic field, we have previously
embarked on a detailed exploration of Fast-flux inci-
dent detection. In this work (Rana and Aksoy, 2021),
we employed genetic algorithms and machine learn-
ing algorithms to classify these rapidly changing do-
main names used by attackers to hide phishing and
malware delivery sites.
Comparative Analysis of Feature Selection Algorithms for Automated IoT Device Fingerprinting
431

2.3 Hybrid and Novel Feature Selection
Techniques
The rise of hybrid methodologies is another signif-
icant advancement in feature selection techniques.
By combining established methods with novel algo-
rithms, researchers aim to overcome the limitations
of individual techniques and deliver a more compre-
hensive solution. (Sivagaminathan and Ramakrish-
nan, 2007) have developed hybrid models to lever-
age the combined benefits of traditional and novel al-
gorithms, ensuring an enriched feature selection pro-
cess. They introduce a hybrid feature selection ap-
proach using Ant Colony Optimization and Neural
Networks. The work by (Zhu et al., 2023) bases
their work on artificial immune algorithm optimiza-
tion that aims to enhance the accuracy and efficiency
of feature selection processes. Other researchers
have presented innovative algorithms and optimiza-
tions that expand the range of hybrid methods acces-
sible to researchers (Chhabra et al., 2023; Eskandari
and Seifaddini, 2023; Wang et al., 2023). Additional
contributions, such as (Houssein et al., 2023; Jin et al.,
2023; de Oliveira Sementille et al., 2023), encompass
a range of topics from fuzzy logic implementations to
intrusion detection, each adding a unique flavor to the
evolving narrative of hybrid and novel feature selec-
tion techniques.
2.4 Feature Selection in Medical and
Health Domains
Numerous medical and health research articles also
adopt feature selection techniques in utilizing their re-
sults when paired with machine learning algorithms.
For instance, (Patel and Giri, 2016) utilizes feature se-
lection in accurately diagnosing motor bearing faults.
They combine their approach with the random for-
est algorithm to perform classification. In another
study, (Mishra and Sahu, 2011) employs the signal-
to-noise ratio as a primary feature selection strategy
to enhance the classification accuracy in cancer diag-
nostics. (Sun et al., 2019) emphasizes the importance
of feature selection when predicting Chronic Obstruc-
tive Pulmonary Disease (COPD). By analyzing lung
CT images, they could refine their predictive model.
In the genetics field, (Xie et al., 2023) aims to im-
prove the classification of gene microarray data using
advanced feature selection methods. Lastly, (Agrawal
and Chakraborty, 2023) emphasizes the role of di-
mensionality reduction, a domain of feature selection,
in improving the accuracy and dependability of struc-
tural health monitoring assessments.
3 ANALYSIS OF FEATURE
SELECTION ALGORITHMS
This paper analyzes several feature selection algo-
rithms and compares their performance in the IoT de-
vice identification domain. We mainly compare the
filter method, wrapper method, hybrid method, and
search optimization algorithms and analyze their ac-
curacy of classification for IoT device identification.
We used the Chameleon cloud servers to conduct the
computational need of our research (Keahey et al.,
2020).
3.1 Machine Learning Classifier
We employed 3-fold cross-validation for each algo-
rithm to ensure model reliability and reduce data split-
ting bias. The data was divided into three equal
parts: Batch1.pcap, Batch2.pcap, and Batch3.pcap.
We tested three setups, using each data batch com-
bination to avoid bias. Finally, we averaged the accu-
racy from these setups to evaluate the performance of
the feature selection algorithms.
3.2 Optimization Algorithms
The nature-inspired search optimization algorithms
use populations to iteratively seek solutions, often
achieving optimal or near-optimal outcomes over
time. Their probabilistic nature promotes diverse so-
lutions and prevents getting stuck in local optima. The
fitness function that we implemented evaluates each
potential solution’s effectiveness in classifying IoT
traffic. In each iteration, solutions with high fitness
values proceed to the next stage, enhancing solution
quality over time. The fitness function in Equation 1
calculates the fitness value of each solution.
Fitness = 0.9 × Accuracy
+ 0.1 ×
1 −
|SelectedFeatures| − 1
|AllFeatures| − 1
(1)
We implemented two terms that impact the fitness
value: the accuracy of the classification and the ratio
of the number of features present in a solution, which
helped ensure keeping the accuracy high and elimi-
nating redundant features. We also needed to deter-
mine a weight for both of these factors. Our previ-
ous research (Aksoy and Gunes, 2019) showed that
0.9 and 0.1 for accuracy and feature selection terms,
respectively, yield good results. We record the solu-
tion with the highest fitness value in each iteration to
observe whether the algorithm evolves to find better
solutions. It is, however, not guaranteed to converge
ICISSP 2024 - 10th International Conference on Information Systems Security and Privacy
432
to the optimal solution. Thus, it becomes essential
to determine a termination point to prevent the algo-
rithm from running indefinitely. We decided to termi-
nate when the last k = 10 consecutive iterations con-
sistently generated the same solution as the best solu-
tion. We have observed that k = 10 or k = 15 yields
a solution with high fitness values. When implement-
ing the search optimization algorithms, we carefully
chose the parameters they utilize based on each algo-
rithm’s characteristics and requirements. A popula-
tion size of 50 for the GA was employed, ensuring
diverse potential solutions while maintaining compu-
tational efficiency. We also used a mutation rate of
0.015 and a crossover rate of 0.5. For the ACO, we
utilized ten ants to traverse and seek optimal paths.
The pheromone’s influence on path selection was de-
termined by a pheromone strength of 1, and a decay
rate of 0.5 was incorporated to simulate the natural
decay of the pheromone over time. Lastly, the ABC
algorithm’s population was also set to 50, identical
to the GA’s population size for consistency. To miti-
gate the risk of premature convergence, the maximum
number of trials a bee could undertake without finding
a better food source was limited to 5.
3.3 Filter, Wrapper and Embedded
Methods
Filter methods perform feature selection based on
the intrinsic statistical properties of features rather
than the interactions between features. Therefore,
they do not utilize machine learning algorithms to test
the relevance of features. They are also more efficient
but sacrifice accuracy. In this study, we utilized the
following filter method algorithms: Dispersion Ra-
tio (DR), Mean Absolute Difference (MAD), Vari-
ance Threshold (VT), Correlation Coefficient (CC),
Fisher Score (FS), and Chi-Square (CS). Wrapper
methods, on the other hand, utilize machine learn-
ing algorithms to determine the relevance of features.
They iteratively add or remove features until they ob-
tain the optimal solution possible. However, they sac-
rifice efficiency but provide higher accuracy. In this
study, we utilized the following wrapper method al-
gorithms: Forward Feature Selection (FFS), Back-
ward Feature Elimination (BFE), Exhaustive Feature
Selection (EFS), and Recursive Feature Elimination
(RFE). Finally, embedded methods try to provide the
best of both worlds by integrating the feature selec-
tion into the machine learning algorithm, which helps
balance the compromise between the efficiency and
accuracy. In this study, we utilized the well-known
LASSO Regularization (LR) algorithm.
The Mean Absolute Difference method calcu-
Pcap files
(All devices)
EdimaxPlug1101W
EdimaxPlug2101W
D-LinkCam
D-LinkDayCam
D-LinkDoorSensor
D-LinkHomeHub
D-LinkSensor
D-LinkSiren
D-LinkSwitch
D-LinkWaterSensor
EdnetCam
EdnetGateway
WeMoInsightSwitch
WeMoLink
WeMoSwitch
Aria
D-Link
Edimax
Ednet
HomeMaticPlug
Hue
Lightify
MAXGateway
TP-LinkPlugHS
WeMo
Withings
Result
HueBridge
HueSwitch
Result
TP-LinkPlugHS100
TP-LinkPlugHS110
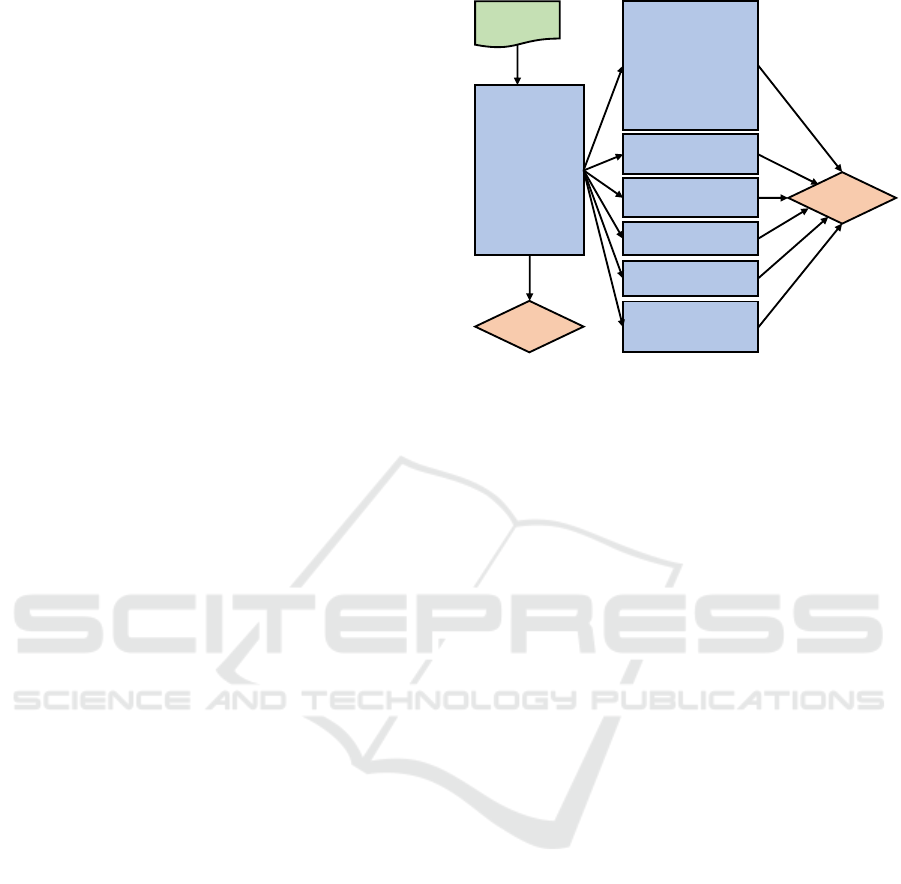
Figure 1: Two-level classifiers setup.
lates the absolute difference between each data point
and the dataset mean to assess a feature’s relevance.
Higher absolute differences indicate more informative
features. Features are listed and sorted by their MAD
scores, and a custom function tests combinations for
the most efficient feature set. In Variance Thresh-
old method, the variance of each feature is generated
by finding the average of the squared differences be-
tween each data point and the mean of the features.
After the variance of each feature is generated, they
are compared against a threshold value. In imple-
menting the algorithm, we set the threshold to 0.1,
which yielded better results. If a feature’s variance
is lower than the threshold, it is ignored, and if the
variance is higher than the threshold, the feature is
kept. The Correlation Coefficient algorithm assesses
the linear relationship between features and the target
variable. Features with a correlation score above a
certain threshold are considered valuable for predic-
tions. We generated the correlation scores of all fea-
tures with the threshold of 0.7, which yielded good re-
sults. Fisher Score algorithm identifies features that
best separate classes by maximizing the ratio of the
difference in class means to the spread within classes.
The Dispersion Ratio algorithm evaluates features
based on the ratio of variance to mean. Features are
ranked by dispersion scores, and a custom function
tests combinations to identify the most accurate fea-
ture set. The Chi-Square algorithm assesses the re-
lationship between features and the target variable,
focusing on their dependency. It involves calculat-
ing the frequency distribution of feature values and
target classes to generate Chi-Square statistics. Fea-
tures with the highest Chi-Square scores, indicating
stronger associations, are selected for the final feature
subset for classification.
The Forward Feature Selection (FFS) algorithm
Comparative Analysis of Feature Selection Algorithms for Automated IoT Device Fingerprinting
433
iteratively chooses features that maximize the model’s
performance. FFS follows a greedy approach where
it only selects the features that maximize the infor-
mation gain. We used the default parameters in the
scikit-learn library for cross-validation to generate the
optimal set of features. Backward Feature Elimi-
nation is the opposite of FFS, where the algorithm
initially starts with the set of all features and iter-
atively removes features with less correlation coef-
ficient value. For each set of features, the model
is trained using a machine learning classifier, and
this process is repeated until the best evaluation is
achieved based on a metric. In our implementation,
we utilized the F1 score as our metric across all the
algorithms. On the other hand, Exhaustive Fea-
ture Selection (EFS) generates an optimal set of fea-
tures based on evaluation metrics like accuracy and
F1 score. EFS initially starts with a single feature and
continues to grow the set until it reaches the maxi-
mum size. The algorithm considers all possible fea-
ture sets at each size, trains the model on those fea-
tures, and evaluates the results to find the best set of
features. Recursive Feature Elimination (RFE) is
similar to BFE in that it starts with the set of all fea-
tures, determines which are irrelevant, and then re-
moves them. While it is similar to BFE, the main
difference is that in RFE, the features selected for
elimination are usually determined based on their uni-
variate importance. In implementing the algorithm,
we used Recursive Feature Elimination with Cross-
Validation (RFECV) in the scikit-learn library.
LASSO Regularization introduces a penalty
term into the linear regression equation. This penalty
term, L1 regularization, is an additional value added
to the cost or loss function. The penalty term enforces
the coefficients of less information-gaining features to
zero. The selection of this penalty term is determined
through techniques like cross-validation to identify
the best value to be used. The features whose co-
efficients are pushed to zero are removed, while the
features with more significant coefficients are kept,
yielding the optimal set of features the algorithm can
generate.
4 EXPERIMENTAL RESULTS
This section provides an overview of the dataset used
and showcases the effectiveness of various feature se-
lection algorithms in accurately classifying vendors
and different types of IoT devices. We detail the
dataset’s characteristics and demonstrate how these
algorithms enhance the classification accuracy.
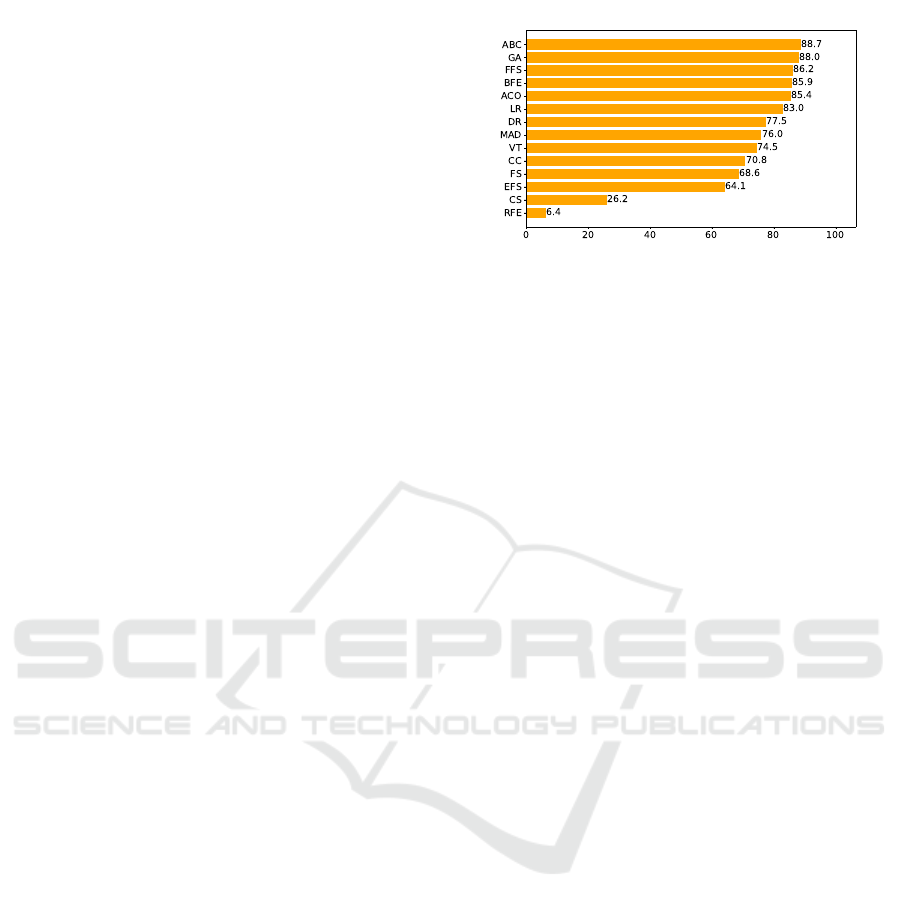
Figure 2: Genre classifier accuracy.
4.1 Data
We use the IoT Sentinel dataset collected by (Mi-
ettinen et al., 2017). The dataset contains TCP/IP
packets for 26 IoT devices. The devices are Aria,
D-LinkCam, D-LinkDayCam, D-LinkDoorSensor,
D-LinkHomeHub, D-LinkSensor, D-LinkSiren,
D-LinkSwitch, D-LinkWaterSensor, Edimax-
Plug1101W, EdimaxPlug2101W, EdnetCam, Ednet-
Gateway, HomeMaticPlug, HueBridge, HueSwitch,
iKettle2, Lightify, MAXGateway, SmarterCoffee,
TP-LinkPlugHS100, TP-LinkPlugHS110, We-
MoInsightSwitch, WeMoLink, WeMoSwitch, and
Withings. To prevent bias in our results, we removed
features such as IP addresses, IP Identifiers, IP
Geolocation, and checksum since the IP addresses
are embedded in them.
In this paper, we are primarily comparing the ac-
curacy of feature selection algorithms on the classi-
fication of IoT devices based on the uniqueness of
header fields in the packets these devices generate.
However, various devices from the same vendor ex-
ist in the dataset. For example, there are eight de-
vices from the D-Link vendor. As expected, we have
observed high similarities in the header fields gener-
ated by devices from the same vendor. This is po-
tentially due to the vendors using similar, if not the
same, network stack in many of their products. There-
fore, as shown in Figure 1, we implemented a two-
level classification where we first try to determine
from which vendor a device’s packets are being gen-
erated. Then, we check and see if we can further clas-
sify the packet’s origin in the second layer to deter-
mine which specific device it originated. The first
level classifier is the genre classifier, which tries to
classify packets into vendors if multiple devices ex-
ist from the same vendor, or it classifies them as the
device itself if there is only one device from a par-
ticular vendor. To achieve this, we merged the pack-
ets from the same vendors. We ended up with the
following genres along with their counts of devices:
Aria (1 device), D-Link (8 devices), Edimax (2 de-
ICISSP 2024 - 10th International Conference on Information Systems Security and Privacy
434

Table 1: Genre classifier accuracy.
Algorithms
Overall
Aria
D-Link
Edimax
Ednet
HomeMatic
Hue
Lightify
MAXGateway
TP-Link
WeMo
Withings
ABC 88.7% 97.3% 96.3% 76.7% 92.7% 85.7% 98.0% 74.3% 93.7% 92.0% 91.0% 80.7%
GA 88.0% 98.0% 95.3% 80.3% 87.3% 87.7% 98.0% 69.0% 93.7% 91.0% 91.3% 73.3%
FFS 86.2% 97.1% 95.6% 81.5% 58.0% 93.9% 97.7% 69.2% 94.6% 91.8% 91.0% 77.7%
BFE 85.9% 98.8% 94.7% 77.0% 54.5% 93.5% 96.9% 73.0% 92.3% 92.4% 90.8% 80.0%
ACO 85.4% 98.3% 95.3% 81.7% 77.3% 93.7% 97.7% 51.0% 94.7% 90.7% 89.0% 69.3%
LR 83.0% 95.7% 87.2% 49.7% 74.9% 98.5% 93.1% 77.0% 93.5% 65.7% 85.4% 92.4%
DR 77.5% 97.3% 76.8% 67.4% 78.4% 79.9% 85.5% 74.9% 68% 72.2% 73.6% 77.0%
MAD 76.0% 98.5% 77.1% 65.5% 58.9% 89.3% 85.9% 74.9% 69.2% 71.4% 71.8% 74.3%
VT 74.5% 74.1% 76.5% 65.2% 79.0% 79.9% 85.9% 34.5% 91.3% 71.7% 73.9% 87.6%
CC 70.8% 78.4% 84.2% 47.6% 66.7% 88.9% 95.0% 52.2% 53.7% 52.3% 70.0% 89.5%
FS 68.6% 98.7% 85.6% 25.0% 70.3% 85.2% 93.0% 53.5% 55.8% 46.7% 71.4% 71.8%
EFS 64.1% 87.8% 89.2% 49.0% 52.2% 88.4% 95.6% 0.0% 56.2% 35.4% 69.5% 82.0%
CS 26.2% 75.0% 73.8% 0.0% 4.9% 31.8% 89.9% 0.0% 0.0% 0.0% 6.7% 6.5%
RFE 6.4% 0.0% 8.0% 2.8% 0.0% 0.0% 60.8% 0.0% 0.0% 0.0% 0.1% 0.0%
(ABC - Artificial Bee Colony), (GA - Genetic Algorithm), (FFS - Forward Feature Selection),
(BFE - Backward Feature Elimination), (ACO - Ant Colony Optimization), (LR - LASSO Regularization),
(DR - Dispersion Ratio), (MAD - Mean Absolute Difference), (VT - Variance Threshold), (CC - Correlation Coefficient),
(FS - Fisher Score), (EFS - Exhaustive Feature Selection), (CS - Chi-Square), (RFE - Recursive Feature Elimination)
vices), Ednet (2 devices), HomeMaticPlug (1 device),
Hue (2 devices), Lightify (1 device), MAXGateway
(1 device), Smarter (2 devices), TP-LinkPlugHS (1
device), WeMo (3 devices), and Withings (1 device).
We excluded the Smarter vendor due to a highly in-
sufficient number of packets.
4.2 Feature Selection & Classification
Performances
Genre classifier is the first-layer classifier we imple-
mented, which helps determine the vendor of a given
TCP/IP packet. In Table 1, we provide the macro av-
erage of accuracy for the classification of each vendor.
We also highlighted the highest accuracy achieved for
a given genre. In the Overall column, we provide the
average of the accuracy of all vendors. We also pro-
vide a graph for the genre classifier in Figure 2. We
observe the highest overall accuracy using the Artifi-
cial Bee Colony (ABC) algorithm at 88.7%. We also
observe that the ABC algorithm is among the high-
est accuracy-yielding algorithms, classifying vendors
D-Link, Ednet, and Hue. Although LASSO Regular-
ization (LR) can also classify three vendors with the
highest accuracy, the overall classification accuracy is
lower than ABC. The macro accuracy is the average
of all vendors regardless of the number of packets,
whereas the weighted average is the number of pack-
ets correctly classified. After preprocessing and re-
moving duplicates, there were 126,209 packets in the
dataset, and the average weighted accuracy of ABC
was 95.3%. We also observe that 7 of the 11 vendors
were classified with more than 90% accuracy, and 9 of
the 11 were classified with more than 80% accuracy
with the ABC algorithm.
D-Link classifier results are provided in Figure 3.
We observed that it is challenging to distinguish the
behavior of devices produced by the D-Link vendor.
Our findings indicate the highest classification accu-
racy of 46.6% using ACO, which is almost statisti-
cally equivalent to a binary coin toss. These results
strongly indicate that the network stack of these de-
vices is very similar, if not identical. Therefore, al-
though we can tell whether a packet originated from a
D-Link device with up to 96.3% accuracy, it becomes
difficult for machine learning to extract a unique fin-
gerprint for each device belonging to that vendor.
Edimax classifer in Figure 4 and Hue classi-
fier in Figure 7, on the other hand, have much more
promising classification results than D-Link devices.
We observe 93.8% accuracy in classifying Edimax
packets using the Mean Absolute Difference (MAD)
algorithm and 99.6% accuracy in classifying Hue de-
vices using the Forward Feature Selection (FFS) algo-
rithm. We also observe similar accuracy in classifying
Comparative Analysis of Feature Selection Algorithms for Automated IoT Device Fingerprinting
435
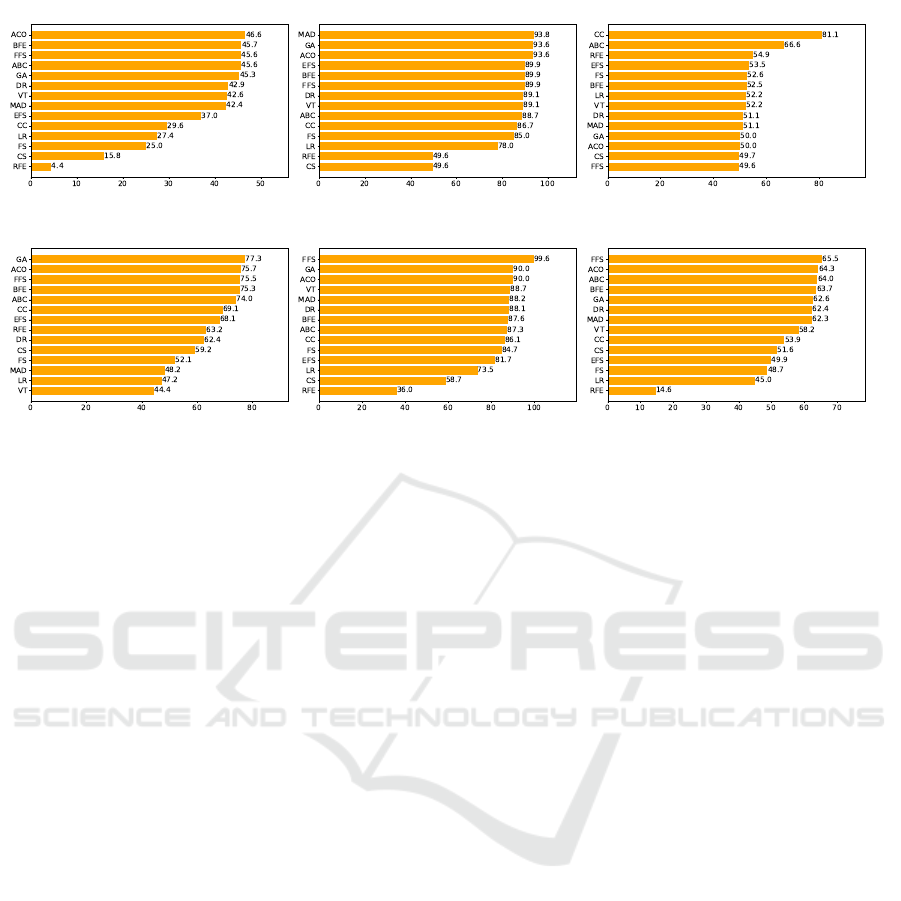
Figure 3: D-Link classifier. Figure 4: Edimax classifier. Figure 5: Ednet classifier.
Figure 6: TP-Link classifier. Figure 7: Hue classifier. Figure 8: WeMo classifier.
Edimax packets with ACO and GA algorithms, which
means we can safely conclude that the results are con-
sistent across several algorithms. With the Hue classi-
fier, however, the next highest accuracy is yielded by
the GA at 90.0%, which indicates that FFS was much
more aggressive in finding a better set of features to
utilize.
Ednet classifier in Figure 5 indicates similar re-
sults to the D-Link across most algorithms. How-
ever, the Correlation Coefficient (CC) algorithm in-
creased the classification accuracy up to 81.1%. TP-
LinkPlugHS devices consisted of two different ver-
sions of smart plugs from the same vendor, which did
not yield very high accuracy as shown in Figure 6, in-
dicating their similarity in their behavior. Although
it is better than the rates of the D-Link classifier, we
observe 77.3% accuracy at best using the GA algo-
rithm. Similarly, WeMo classifier in Figure 8 yields
65.5% accuracy at best using the FFS algorithm, indi-
cating that the vendor is highly likely to use a similar
network stack across their products.
5 CONCLUSION
In this paper, we explored the contribution of vari-
ous feature selection algorithms in classifying IoT de-
vices using machine learning. We conducted a com-
prehensive exploration of the accuracy of feature se-
lection algorithms from various domains, such as fil-
ter methods, wrapper methods, embedded methods,
and search optimization algorithms. We observed
that search optimization algorithms are well-suited
for integrating feature selection and machine learning
to perform IoT device fingerprinting. In classifying
the vendors of devices, three of the search optimiza-
tion algorithms we used, Ant Colony Optimization
(ACO), Artificial Bee Colony (ABC), and Genetic Al-
gorithms (GA), were among the top 5 highest accu-
racy yielding algorithms. We also observed that when
classifying specific types of devices of each vendor
in the second layer classifiers, 7 out of 11 vendors
were classified with the highest accuracy using one
of the search optimization algorithms. We also ob-
served that Wrapper method algorithms such as For-
ward Feature Selection (FFS) and Backward Feature
Elimination (BFE) perform very well when classify-
ing the vendors of the devices, yielding the third and
the fourth highest accuracy levels. Although the over-
all accuracy of LASSO Regularization (LR) is not
among the top five, it was also able to generate the
highest accuracy in classifying the specific types of
devices belonging to three vendors: HomeMaticPlug,
Lightify, and Withings. As seen, search optimization
algorithms are the most suitable options for perform-
ing TCP/IP packet classification of IoT device fin-
gerprinting, followed by Wrapper method tools FFS
and BFE. In the future, we would like to explore the
contribution of statistical features such as each fea-
ture value’s minimum, maximum, mean, and standard
deviation. We anticipate the accuracy to increase af-
ter including such features, which could help more
uniquely detect distinguishing behaviors of different
types of devices.
ICISSP 2024 - 10th International Conference on Information Systems Security and Privacy
436

REFERENCES
Agrawal, A. K. and Chakraborty, G. (2023). Neighborhood
component analysis to leverage the class label infor-
mation during feature selection to enhance the damage
classification performance. In Structures, volume 57,
page 105174. Elsevier.
Aksoy, A. and Gunes, M. H. (2016). Operating system clas-
sification performance of tcp/ip protocol headers. In
2016 IEEE 41st Conference on Local Computer Net-
works Workshops (LCN Workshops), pages 112–120.
IEEE.
Aksoy, A. and Gunes, M. H. (2019). Automated iot de-
vice identification using network traffic. In ICC 2019-
2019 IEEE International Conference on Communica-
tions (ICC), pages 1–7. IEEE.
Aksoy, A., Louis, S., and Gunes, M. H. (2017). Operat-
ing system fingerprinting via automated network traf-
fic analysis. In 2017 IEEE Congress on Evolutionary
Computation (CEC), pages 2502–2509. IEEE.
Alghanam, O. A., Almobaideen, W., Saadeh, M., and Ad-
wan, O. (2023). An improved pio feature selection
algorithm for iot network intrusion detection system
based on ensemble learning. Expert Systems with Ap-
plications, 213:118745.
Chhabra, A., Hussien, A. G., and Hashim, F. A. (2023).
Improved bald eagle search algorithm for global opti-
mization and feature selection. Alexandria Engineer-
ing Journal, 68:141–180.
de Oliveira Sementille, L. F. M., Rodrigues, D., de Souuza,
A. N., and Papa, J. P. (2023). Binary flying squirrel
optimizer for feature selection. In Brazilian Confer-
ence on Intelligent Systems, pages 51–64. Springer.
Eskandari, S. and Seifaddini, M. (2023). Online and of-
fline streaming feature selection methods with bat al-
gorithm for redundancy analysis. Pattern Recognition,
133:109007.
Gharehchopogh, F. S., Abdollahzadeh, B., Barshandeh, S.,
and Arasteh, B. (2023). A multi-objective mutation-
based dynamic harris hawks optimization for botnet
detection in iot. Internet of Things, page 100952.
Houssein, E. H., Hosney, M. E., Mohamed, W. M., Ali,
A. A., and Younis, E. M. (2023). Fuzzy-based hunger
games search algorithm for global optimization and
feature selection using medical data. Neural Comput-
ing and Applications, 35(7):5251–5275.
Jin, Y., Xu, H., and Qin, Z. (2023). Intrusion detection
model for software-defined networking based on fea-
ture selection. In Sixth International Conference on
Computer Information Science and Application Tech-
nology (CISAT 2023), volume 12800, pages 428–434.
SPIE.
Keahey, K., Anderson, J., Zhen, Z., Riteau, P., Ruth, P.,
Stanzione, D., Cevik, M., Colleran, J., Gunawi, H. S.,
Hammock, C., Mambretti, J., Barnes, A., Halbach, F.,
Rocha, A., and Stubbs, J. (2020). Lessons learned
from the chameleon testbed. In Proceedings of the
2020 USENIX Annual Technical Conference (USENIX
ATC ’20). USENIX Association.
Maslan, A., Mohamad, K. M. B., Hamid, A., Pangaribuan,
H., and Sitohang, S. (2023). Feature selection to en-
hance ddos detection using hybrid n-gram heuristic
techniques. JOIV: International Journal on Informat-
ics Visualization, 7(3):815–822.
Miettinen, M., Marchal, S., Hafeez, I., Asokan, N., Sadeghi,
A.-R., and Tarkoma, S. (2017). Iot sentinel: Au-
tomated device-type identification for security en-
forcement in iot. In Distributed Computing Systems
(ICDCS), 2017 IEEE 37th International Conference
on, pages 2177–2184. IEEE.
Mishra, D. and Sahu, B. (2011). Feature selection for can-
cer classification: a signal-to-noise ratio approach. In-
ternational Journal of Scientific & Engineering Re-
search, 2(4):1–7.
Nkongolo, M. (2023). Assessing cyclostationary mal-
ware detection via feature selection and classification.
arXiv preprint arXiv:2308.15237.
Patel, R. K. and Giri, V. (2016). Feature selection and classi-
fication of mechanical fault of an induction motor us-
ing random forest classifier. Perspectives in Science,
8:334–337.
Rana, S. and Aksoy, A. (2021). Automated fast-flux detec-
tion using machine learning and genetic algorithms.
In IEEE INFOCOM 2021-IEEE Conference on Com-
puter Communications Workshops (INFOCOM WK-
SHPS), pages 1–6. IEEE.
Sangaiah, A. K., Javadpour, A., Ja’fari, F., Pinto, P., Zhang,
W., and Balasubramanian, S. (2023). A hybrid heuris-
tics artificial intelligence feature selection for intru-
sion detection classifiers in cloud of things. Cluster
Computing, 26(1):599–612.
Sivagaminathan, R. K. and Ramakrishnan, S. (2007). A hy-
brid approach for feature subset selection using neural
networks and ant colony optimization. Expert systems
with applications, 33(1):49–60.
Sun, P., Wang, D., Mok, V. C., and Shi, L. (2019). Compari-
son of feature selection methods and machine learning
classifiers for radiomics analysis in glioma grading.
IEEE Access, 7:102010–102020.
Thakkar, A. and Lohiya, R. (2023). Fusion of statistical im-
portance for feature selection in deep neural network-
based intrusion detection system. Information Fusion,
90:353–363.
Wang, X., Dong, X., Zhang, Y., and Chen, H. (2023).
Crisscross harris hawks optimizer for global tasks
and feature selection. Journal of Bionic Engineering,
20(3):1153–1174.
Wu, Y.-L., Tang, C.-Y., Hor, M.-K., and Wu, P.-F. (2011).
Feature selection using genetic algorithm and clus-
ter validation. Expert Systems with Applications,
38(3):2727–2732.
Xie, W., Wang, L., Yu, K., Shi, T., and Li, W. (2023). Im-
proved multi-layer binary firefly algorithm for opti-
mizing feature selection and classification of microar-
ray data. Biomedical Signal Processing and Control,
79:104080.
Zhu, Y., Li, W., and Li, T. (2023). A hybrid artificial im-
mune optimization for high-dimensional feature se-
lection. Knowledge-Based Systems, 260:110111.
Comparative Analysis of Feature Selection Algorithms for Automated IoT Device Fingerprinting
437
