
A Probabilistic Approach for Detecting Real Concept Drift
Sirvan Parasteh
a
and Samira Sadaoui
b
Computer Science Department, University of Regina, Regina, Canada
Keywords:
Concept Drift Detection, Real Concept Drift, Data Stream, Synthetic Datasets, Probability Distributions.
Abstract:
Concept Drift (CD) is a significant challenge in real-world data stream applications, as its presence requires
predictive models to adapt to data-distribution changes over time. Our paper introduces a new algorithm,
Probabilistic Real-Drift Detection (PRDD), designed to track and respond to CD based on its probabilistic
definitions. PRDD utilizes the classifier’s prediction errors and confidence levels to detect specifically the
Real CD. In an exhaustive empirical study involving 16 synthetic datasets with Abrupt and Gradual drifts,
PRDD is compared to well-known CD detection methods. PRDD is highly performing and shows a time
complexity of O(1) per datapoint, ensuring its computational efficiency in high-velocity environments.
1 INTRODUCTION
Nowadays, many real-world applications come with
high-velocity and high-volume data, spanning sectors
such as e-commerce, healthcare, and finance. The
impossibility of storing the entire data for processing
necessitates that Machine Learning (ML) algorithms
can only view samples once. Ml algorithms assume
that both training and unseen samples follow the same
distribution. However, the underlying data distribu-
tions may shift over time in today’s evolving data-
generating sources. For example, user purchasing be-
havior may change due to unpredictable events like
the COVID pandemic or new types of products being
introduced in the e-commerce market over time. This
discrepancy between training and testing data distri-
butions, called Concept Drift (CD), is a significant
challenge for researchers (Gama et al., 2014; Webb
et al., 2016), because CD degrades prediction qual-
ity substantially. The ML models may have learned
patterns no longer relevant to the new incoming data.
Therefore, in these non-stationary environments, con-
tinuous monitoring of the ML models’ performance
is essential, along with frequent updates to accommo-
date the newly detected concept. Indeed, the pres-
ence of CD in the data stream will majorly impact the
predictive models and decision-making tasks. Con-
sequently, understanding and detecting those unpre-
dictable data changes is vital to develop robust adap-
tation mechanisms. The CD is a complex notion in-
a
https://orcid.org/0000-0001-7642-2654
b
https://orcid.org/0000-0002-9887-1570
volving several features (Lu et al., 2018), such as the
type of change (Real or Virtual) and the transition
speed (Abrupt, Gradual, or Incremental). This paper
focuses on the Real CD and considers both Abrupt
and Gradual shifts.
Several studies examined the performance of nu-
merous CD detection algorithms, such as those con-
ducted in (Gonc¸alves Jr et al., 2014) and (Barros and
Santos, 2018). These studies showed that no single
approach consistently excels in all scenarios. Select-
ing a CD detection method is tied to the application’s
requirements, including the datasets’ characteristics
and the ML models being used. Moreover, these stud-
ies outlined several limitations, such as sensitivity to
the tuning of the parameters, a considerable computa-
tional cost, and challenges with complex data. Conse-
quently, there is still a need for more efficient methods
capable of handling diverse data types and dynami-
cally adapting to rapidly evolving concepts.
Our paper proposes an efficient solution for de-
tecting Real CD in data streams, named the Proba-
bilistic Real-Drift Detection (PRDD) algorithm. The
latter capitalizes on two key aspects of a classifier’s
performance: (1) the prediction errors and (2) the
confidence level in these predictions. The PRDD al-
gorithm is grounded in the formal definition of Real
CD, tracking changes in the posterior probability dis-
tribution P(y|x) over time to detect instances of drift
promptly. PRDD retains a fixed-size moving win-
dow of the most recent data, enabling continuous
data stream monitoring and updating critical statis-
tical metrics. These metrics include the real drift
Parasteh, S. and Sadaoui, S.
A Probabilistic Approach for Detecting Real Concept Drift.
DOI: 10.5220/0012378800003636
Paper published under CC license (CC BY-NC-ND 4.0)
In Proceedings of the 16th International Conference on Agents and Artificial Intelligence (ICAART 2024) - Volume 2, pages 301-311
ISBN: 978-989-758-680-4; ISSN: 2184-433X
Proceedings Copyright © 2024 by SCITEPRESS – Science and Technology Publications, Lda.
301

threshold (T
real
) and the ratio of real drift instances,
empowering PRDD to track and adapt to evolving
data streams. Our empirical study highlights the high
performance of PRDD when compared to five well-
established CD detection methods across 16 diverse
synthetic stream datasets. Furthermore, PRDD stands
out for its computational efficiency. With a time com-
plexity of O(1) per data point, PRDD’s computational
cost remains invariant with the size of the data stream,
making it especially suited for real-time applications
that deal with vast volumes of data. Our study’s con-
tributions are three-fold:
• We developed the PRDD algorithm based on the
formal definition of Real CD. In Real CD scenar-
ios, classifiers often make incorrect predictions,
yet exhibit high confidence in these predictions.
This behavior aligns with the Bayesian defini-
tion of Real CD, where the decision boundary
becomes ineffective even though the input data
distribution, P(x), remains unchanged. PRDD
harnesses the classifier’s prediction probabilities
as an indicator of its confidence, ensuring a rapid
response to CD. The main parameters of the
PRDD algorithm were fine-tuned through rig-
orous experimental testing. Importantly, PRDD
has a consistent execution time of O(1) per data
sample, emphasizing its suitability for real-time
stream processing scenarios.
• Performing a comprehensive empirical study to
compare PRDD’s performance against traditional
CD detection methods (in total five) across 16 di-
verse synthetic stream datasets, handling Grad-
ual and Abrupt drifts. We also assess the base
learner (devoid of any CD detection mechanism)
to demonstrate the necessity of detecting CD. The
evaluation is carried out as follows: (1) Perfor-
mance (Accuracy and F1-score) of the seven drift
detection algorithms on eight Abrupt datasets, (2)
Performance of the seven drift detection algo-
rithms on eight Gradual drift datasets, (3) Ag-
gregated performance analysis using a rank-based
statistical test, and (4) Analysis of the average ex-
ecution time of each CD detection algorithm.
• We conducted an extensive empirical study com-
paring PRDD with five conventional CD detec-
tion methods across 16 synthetic stream datasets,
which include both Gradual and Abrupt drifts.
Furthermore, we evaluated a base learner without
any CD detection to underscore the importance of
CD detection. Our evaluation comprised: (1) An-
alyzing the performance (Accuracy and F1-score)
of the seven algorithms on eight Abrupt datasets,
(2) Assessing these algorithms on eight Gradual
drift datasets, (3) Undertaking an aggregated per-
formance analysis through a rank-based statistics,
and (4) Evaluating the average execution time for
each CD detection method.
This paper is organized as follows. Section 1
provides a formal definition of the Real CD with
Gradual and Abrupt shifts. Section 2 describes well-
established CD detection algorithms. Section 3 intro-
duces our Probabilistic Real-Drift Detection (PRDD)
algorithm, elaborating on its design and underlying
principles. Section 4 conducts an extensive empiri-
cal study to validate the performance of PRDD, com-
paring it with existing CD detection methods across
various synthetic stream datasets.
2 REAL CONCEPT DRIFT
We utilize the probabilistic definitions of CD given
in (Gama et al., 2014; Hoens et al., 2012; Webb
et al., 2017). Based on these definitions, two different
CD types have been recognized in the literature: (1)
Real drift, where only the learner’s decision boundary
changes, and (2) Virtual drift, where only the input-
feature distribution changes. The Bayesian approach
is a popular choice for developing CD detection meth-
ods, as it captures the changes in the joint distribution
of the features and class labels (Hoens et al., 2012).
In this paper, we focus only on the Real CD, indicat-
ing that the statistical properties of the target variable
change over time. More precisely, Real drift means
that the conditional distribution of the target variable
P(y | x) changed, while there is no change in the dis-
tribution of the input features P(x) (Lu et al., 2018):
P
t
(y | x) ̸= P
u
(y | x) and P
t
(x) = P
u
(x) (1)
where x represents a set of feature vectors and y its
corresponding target variable, and time u, which is af-
ter t, denotes when the data distribution has changed.
The posterior probability distribution is computed
using Bayes’ theorem as follows:
P(y|x) =
P(x|y)P(y)
P(x)
(2)
where P(x|y) is the likelihood of the features given
the target class, P(y) is the prior probability of the
class label and P(x) is the marginal probability of
the features. In the presence of CD, the prior dis-
tribution P(y) and likelihood distribution P(x|y) have
changed, leading to a change to the posterior distribu-
tion (Gama and Castillo, 2006).
Considering the Real CD definition, a learned
concept can remain stable for a period of time and
ICAART 2024 - 16th International Conference on Agents and Artificial Intelligence
302

Table 1: Error-based Concept-Drift Detection Methods.
Method Implementation Year #citation
PH (Page, 1954) MultiFlow, River 1954 6563
DDM (Gama et al., 2004) MultiFlow, River 2004 1596
EDDM (Baena-Garcıa et al., 2006) MultiFlow, River 2006 868
STEPD(Nishida and Yamauchi, 2007) Git 2007 286
ADWIN (Bifet and Gavalda, 2007) MultiFlow, River 2007 1549
ECDD (Ross et al., 2012a) Git 2012 341
EWMA(Ross et al., 2012b) Git 2012 382
SeqDrift(Pears et al., 2014) Git 2013 46
HDDM (Frias-Blanco et al., 2014) MultiFlow, River, Git 2014 271
SEED(Huang et al., 2014) Link 2014 68
FHDDM(Pesaranghader and Viktor, 2016) Git 2016 134
RDDM(Barros et al., 2017) Git 2017 130
FTDD(de Lima Cabral and de Barros, 2018) Git (Fisher test) 2018 90
MDDM(Pesaranghader et al., 2018) Git 2018 55
KSWIN(Raab et al., 2020) MultiFlow 2020 58
then change into another concept in the data stream:
Concept
t
̸= Concept
u
<=> P
t
(x|y) ̸= P
u
(x|y) (3)
In addition to the drift types (Real vs. Virtual),
CD is characterized by its transition (i.e., speed of
change), which has often been categorized as Abrupt,
Gradual, and Incremental to express whether the
change levels are small or significant. These aspects
carry essential information that can be utilized to de-
velop drift-handling mechanisms. Our study focuses
on the Abrupt and Gradual changes for Real CD:
Abrupt Drift. In Abrupt drifts, a known concept C
t
switches suddenly to another concept C
u
, and the pro-
gression of change is very rapid. This shift can hap-
pen for several reasons, such as the outage of service
or failure of a sensor and equipment.
Gradual Drift. The transition between concepts
happens slowly, following a Gradual progression of
tiny changes. For instance, a slowly degrading part of
factory equipment can result in a Gradual drift in the
quality of the output parts, or inflation through a pe-
riod of time can impact models dealing with pricing
(Tsymbal, 2004). (Gama et al., 2014) introduced ”in-
termediate concepts” that help to illustrate the transi-
tion between the old concept C
i
and the new concept
C
i+1
. The intermediate concept can be one of C
t
or
C
u
, which means each sample appearing during the
drift period belongs to one of the concepts involved.
3 RELATED WORKS
Since the mid-1990s, researchers have shown great
interest in CD (Widmer and Kubat, 1996; Klinken-
berg and Renz, 1998), and several methods for detect-
ing changes in the data stream have been developed.
Among these methods, error-based methods (super-
vised) have gained significant attention. These meth-
ods utilize the predictive performance as input and
apply statistical distribution tests to capture any sig-
nificant change in the learner’s performance. Thus,
any fluctuation in the error rate can signal a drift.
These methods return the CD locations/timestamps in
the data stream. We explored numerous CD detectors
and report in Table 1, the most utilized ones. Table
1 presents various CD detection algorithms, includ-
ing their (1) implementation, (2) year of publication,
and (3) popularity based on the citation number. We
investigated many methods and reported their imple-
mentation using three primary sources: (1) GitHub
for the public repositories, (2) Link for the provided
link to the source code, and (3) Multiflow or River
for the implementation on Scikit-multiflow or River,
which are Python-based packages for ML for stream-
ing environments.
Examining various error-based CD detection
methods reveals a chronological progression in their
development. The Page-Hinkley (PH) method (Page,
1954) marked the beginning of this progression,
which has since evolved to include increasingly ad-
vanced approaches, such as DDM (Gama et al.,
2004), EDDM (Baena-Garcıa et al., 2006), and AD-
WIN (Bifet and Gavalda, 2007). While some tech-
niques have garnered significant attention regarding
A Probabilistic Approach for Detecting Real Concept Drift
303

the citation count, others have remained less influ-
ential. Nonetheless, the diverse landscape of error-
based methods offers researchers a wide array of tech-
niques to choose from based on their specific applica-
tion needs.
Recent trends in the field of CD detection have
seen an increased interest in taking advantage of prob-
abilistic methods. For instance, the study (Parasteh
and Sadaoui, 2023) introduced a new supervised
probabilistic CD detection algorithm called SPNCD.
The latter utilizes the Sum-Product Network to learn
the joint probability distribution of incoming data in
a tractable way. More specifically, SPNCD leverages
the predicted probabilities from the SPN model and
combines them with the base ML model’s predictions
to effectively detect drifts (Real and Virtual). How-
ever, the SPNCD’s dependence on the SPN as an ad-
ditional model added computational demands.
In this paper, for comparison purposes, we choose
the following five methods:
• ADWIN (Adaptive Windowing): This is a detector
and estimator that efficiently adapts the length of
a window of observations to detect changes in the
observable process. The adaptation is based on
an online algorithm that maintains the statistical
properties of the data stream, allowing a prompt
reaction to changes. ADWIN is more efficient for
Gradual drifts (Bifet and Gavalda, 2007).
• EDDM (Early Drift Detection Method): This
is a supervised detection method that monitors
the distribution of distances between consecutive
classification errors. EDDM can detect Gradual
and Abrupt changes while maintaining low false
positive rates and is particularly designed to detect
early signs of drifts. (Baena-Garcıa et al., 2006).
• KSWIN (Kolmogorov-Smirnov Windowing): This
is a drift detection technique based on the
Kolmogorov-Smirnov statistical test. It compares
the distributions of two samples from a window
of recent observations and triggers alarms upon
significant distribution changes, thereby indicat-
ing CD.
• HDDM (Hellinger Distance Drift Detection):
This detector measures the dissimilarity between
two probability distributions using the Hellinger
distance, aiming to detect changes in data streams.
The method offers two variations, HDDM A and
HDDM W, with the former more sensitive to
Abrupt changes and the latter designed to identify
Gradual changes (Frias-Blanco et al., 2014).
4 PROBABILISTIC REAL-DRIFT
DETECTION APPROACH
The new approach for detecting real drift operates
based on an adaptive probabilistic mechanism that
continuously monitors the incoming data stream,
capturing and reacting to drift. This mechanism
aligns with the formal definition of CD, which sig-
nifies changes in the posterior probability distribu-
tion, P(y|x), while the data distribution in the in-
put space,(P(x), remains consistent over time. The
approach, termed Probabilistic Real-Drift Detection
(PRDD), emphasizes two key aspects of a classifier’s
performance: (1) prediction error and (2) confidence
in its predictions. The underlying rationale is that dur-
ing real drift, a classifier’s decision boundary may be-
come outdated, leading to an increase in prediction
errors. Thus, even with consistent input features, the
classifier, confident in its predictions, may misclassify
drifted samples due to an irrelevant decision bound-
ary. This misclassification arises when there’s a shift
in the target variable distribution, despite the input
distribution remaining unchanged.
While processing the data stream sample by sam-
ple (online learning), PRDD maintains a fixed-size
moving window for calculating the drift detection fac-
tors, including an adaptive real-drift threshold (T
real
),
the real drift rate computed as the proportion of drift-
ing candidate within the moving window, and a com-
parison of the real drift rate with a drift alarm thresh-
old (T
alarm
). The pseudocode of the PRDD approach
is given in Algorithm 1. Below, we explain the PRDD
parameters and variables:
• T
real
∈ [0, 1]: T
real
serves as a threshold mark-
ing the learner’s confidence in misclassified sam-
ples. Any sample misclassified with a confi-
dence exceeding T
real
is flagged as a potential
drift candidate. To dynamically adjust this thresh-
old in response to the most recent changes in the
data stream, we employ the Exponential Mov-
ing Average of the classifier’s prediction proba-
bilities. This method strikes a balance between
the classifier’s recent and historical prediction per-
formance. For every prediction error, the thresh-
old T
real
is recalibrated according to the formula
T
real
= 0.7×P
avg
+0.3 ×T
real
, where P
avg
denotes
the average prediction probability within the cur-
rent window. Such an adaptive approach ensures
that T
real
consistently mirrors the data stream’s
prevailing conditions.
• T
alarm
∈ [0, 1]: T
alarm
is a predefined alarming
threshold utilized to ascertain if a drift is man-
ifesting within the moving window. Grounded
on our empirical assessments across 16 datasets,
ICAART 2024 - 16th International Conference on Agents and Artificial Intelligence
304

T
alarm
is established at 0.47. This threshold as-
sists in pinpointing situations where the real drift
rate within the window exceeds a limit that ne-
cessitates the recognition of an actual CD. T
alarm
guarantees a balance, ensuring sensitivity to legit-
imate drifts while maintaining resilience against
incidental noise and minor variations.
• Warmup Threshold: This parameter is introduced
to allow the model to warm up or acclimate to
the recent state of the data stream. The warmup
threshold is been set empirically to let the model
observe sufficient data and calibrate its parameters
without actively triggering any drift detection.
• Sample Count is used to count the number of pro-
cessed samples since the beginning of the new
concept. When the sample count passes the
warmup threshold, the detection mechanism is ac-
tivated, and When drift is detected, this variable
will be reset to 0.
• Window Size: The window size determines the
number of recent samples included in the calcu-
lations for T
real
and the drift rate. Given a fixed
drift alarm threshold, such as 0.5, the window size
has a direct influence on the algorithm’s ability to
detect changes. A smaller window can make the
model overly sensitive, reacting to slight changes
or noise as if they were significant drifts. Con-
versely, a larger window might result in slower
detection of rapid drifts. Therefore, selecting the
right window size is crucial to ensure timely drift
detection while avoiding false alarms caused by
noise.
In conclusion, the PRDD method presents a ro-
bust solution for real drift detection in streaming data.
It capitalizes on the classifier’s prediction probabil-
ities and maintains a quick adaptation rate to CD,
thereby ensuring reliable performance in dynamic en-
vironments. Utilizing an adaptive learner’s confi-
dence threshold (T
real
), a static drift alarm threshold
(T
alarm
), a warm-up period, and an optimal window
size, PRDD forms a high-quality mechanism for real
drift detection.
5 VALIDATION
To validate the detection capability of our approach,
we conduct experiments on a comprehensive set
of synthetic stream datasets designed explicitly for
evaluating CD detection algorithms. These public
datasets were generated using the scikit-multiflow
framework to simulate the occurrence of various types
Algorithm 1: Real CD Detection Algorithm.
Require: dataStream (continuous), windowSize =
20, T
alarm
= 0.47, warmupThreshold = 20
Ensure: Drift detection and classifier update
1: Initialize classifier and window parameters
2: sampleCount = 0, T
real
= 0, realDriftCount = 0
3: for each sample in dataStream do
4: sampleCount +=1
5: (*Perform prequential prediction and train-
ing*)
6: Predict the label y
pred
for the current sample x
7: Calculate the probability P(y
pred
|x) associated
with the prediction
8: Update the classifier using the true label y
9: if sampleCount > warmupThreshold then
10: Update window of probabilities with
P(y
pred
|x)
11: if label is incorrect and P(y
pred
|x) ≥ T
real
then
12: realDriftCount +=1
13: Update window of real drifts
14: end if
15: (*Calculate average probability*)
16: P
avg
=
1
windowSize
∑
P(y
pred
|x)
17: if label is incorrect then
18: (*Update T
real
*)
19: T
real
= 0.7 × P
avg
+ 0.3 × T
real
20: end if
21: (*Calculate real drift rate*)
22: RD
rate
=
realDri f tCount
windowSize
23: if window is full and RD
rate
> T
alarm
then
24: Signal drift
25: Reset stats and re-initialize classifier
26: sampleCount =0
27: end if
28: end if
29: end for
of drifts. As these datasets precisely mark the loca-
tions of the induced drifts, they serve as ground truth
for performance measurement of different CD detec-
tion metrics. In the following subsections, we de-
scribe the experimental setup, the synthetic datasets,
and the obtained performance results in detail.
5.1 Diverse Drift Datasets
To ensure the robustness of our findings, we em-
ploy 16 synthetic datasets from the publicly available
collection hosted by Harvard Dataverse(L
´
opez Lobo,
2020). These datasets are designed specifically for
CD detection research, encapsulating Abrupt and
Gradual drift scenarios. Each dataset consists of
40,000 observations with a balanced binary class dis-
A Probabilistic Approach for Detecting Real Concept Drift
305

tribution and devoid of any noise. Specifically, these
datasets manifest four distinct concepts separated by
three drifts at predetermined time steps. These tran-
sitions span over 1000 instances for Gradual drift
datasets, simulating a slow adaptation to the new con-
cepts. The datasets originated from four different
stream generators: Sine, Random Tree, Mixed, and
Stagger. Each generator contributes to Abrupt and
Gradual drifts, enhancing the diversity of our dataset
collection. The datasets bear unique characteristics
regarding drift types, the number of features, and un-
derlying generating functions.
• Mixed: Constructs datasets with four numerical
features and adopts two distinct function orders
defined as F1 = [0, 1, 0, 1] and F2 = [1, 0, 1, 0].
• Sine: Generates datasets with two numerical fea-
tures using two function orders: F1 = [0, 1, 2, 3]
and F2 = [3, 2, 1, 0].
• Stagger: Produces datasets with three numerical
features based on two function orders: F1 = [0, 1,
2, 0] and F2 = [2, 1, 0, 2].
• Random Tree (RT): Creates datasets with two
numerical features using two function orders: F1
= [8873, 9856, 7896, 2563] and F2 = [2563, 7896,
9856, 8873].
Each generator produces four different datasets.
For example, the Mixed generator constructs
MixedF1Abrupt, MixedF2Abrupt, MixedF1Gradual
and MixedF2Gradual. Using this diverse range of
datasets, our evaluation thoroughly evaluates the
proposed algorithm across varying types of CD
scenarios.
5.2 Experiment Setup
Our evaluation strategy encompasses a compar-
ative study with five contemporary drift detec-
tion algorithms, namely ADWIN, EDDM, KSWIN,
HDDM A, and HDDM W. We benchmark these
models against our real drift detection algorithm on
the 16 synthetic datasets. Performance is quantified
using three key metrics: Accuracy, F1-score, and exe-
cution time, providing a comprehensive overview of
each model’s predictive capability, the balance be-
tween precision and recall, and computational effi-
ciency. With regard to KSWIN, it possesses a de-
gree of nondeterminism stemming from its built-in
sampling process. To accommodate this variability,
we conduct a series of 10 independent runs for each
dataset when testing with KSWIN. The reported re-
sults for this method represent the average outcomes
of these multiple runs, offering a more reliable mea-
sure of its performance.
We adopt the Hoeffding Tree Classifier as the un-
derlying learner for the six drift detection algorithms.
This classifier, renowned for its adaptability to high-
speed data streams, is a decision tree designed specif-
ically to process data items arriving at fast rates. It
serves as an appropriate choice given the dynamic na-
ture of CD and the real-time processing requirements
of streaming data.
To better understand the contribution of the drift
detection component, we also include a baseline sce-
nario in our experimental setup. This scenario con-
sists solely of the Hoeffding Tree Classifier, devoid
of any drift detection mechanism. This baseline al-
lows us to gauge the added value of integrating a
drift detector with the classifier. While we expect that
combining a classifier with a drift detector generally
outperforms a standalone classifier, we focus on ana-
lyzing how effectively the proposed method enhances
the performance. The performance evaluation of the
seven algorithms is structured along four distinct seg-
ments:
1. Performance metrics on the eight Abrupt drift
datasets.
2. Performance metrics on the eight Gradual drift
datasets.
3. Aggregated performance analysis using rank-
based statistics.
4. Analysis of the average execution time to evaluate
the computational efficiency.
Our comprehensive approach to performance
evaluation sheds light on the algorithm’s behavior un-
der both Abrupt and Gradual drift scenarios and pro-
vides a comparative view of its performance against
other algorithms, including computational aspects.
The choice to employ a rank-based analysis alongside
traditional performance metrics stems from the de-
sire for a well-rounded assessment of the algorithm’s
capabilities. While direct metrics such as accuracy
or F1-score can offer valuable insights, they might
sometimes be swayed by the unique properties of in-
dividual datasets. For instance, an algorithm could
excel on specific datasets because those datasets in-
herently match the algorithm’s assumptions. More-
over, the variability in performance outcomes across
diverse datasets can make averaged comparisons less
statistically relevant. In contrast, a rank-based analy-
sis provides a better comparative perspective by mea-
suring how often our proposed algorithm outperforms
other algorithms, regardless of the absolute perfor-
mance metrics.
By exploring these different evaluation scenarios,
we aim to provide a comprehensive and robust as-
sessment of our proposed algorithm’s effectiveness
ICAART 2024 - 16th International Conference on Agents and Artificial Intelligence
306

and utility across various drift dynamics and compu-
tational constraints.
5.3 Performance Evaluation on Abrupt
Drift
Our proposed real-drift detection algorithm under-
went an extensive comparative evaluation across eight
datasets that exhibit Abrupt drift. The evaluation was
set up to ensure a level playing field where all par-
ticipating algorithms, including our proposed model,
were coupled with the Hoeffding Tree Classifier.
5.3.1 Performance Across Abrupt Datasets
Table 2 offers a comparative analysis of several al-
gorithms, focusing on their Accuracy and F1-score
metrics across Abrupt drift datasets. At a glance,
our proposed PRDD algorithm emerges as a top
performer, leading in 6 out of the 8 datasets in-
cluding MixedF1, MixedF2, RTF2, SineF1, SineF2,
and StaggerF2. This consistent performance under-
scores its strength and reliability in real-drift detec-
tion. However, it faced challenges on the other two
datasets. On the RTF1 dataset, PRDD is closely ri-
valed by HDDM A. While PRDD posts an Accu-
racy of 80.15%, HDDM A slightly surpasses it with
80.34%. Also, The StaggerF1 dataset presents a more
pronounced deviation. PRDD’s Accuracy dips to
91.44%, placing it fifth among the algorithms. Such
a result underscores that while PRDD is generally
robust, there exist scenarios where its assumptions
might not align perfectly with the dataset’s charac-
teristics. It’s also noteworthy that on this dataset,
EDDM shines brightest with an impressive Accu-
racy of 96.12%, higher than HDDM A which showed
higher competency with PRDD. Other methods like
HDDM W, KSWIN, EDDM and ADWIN showed
better performance compare to the base learner, with
no detection algorithm, HoeffdingTree. In many
cases, HoeffdingTree often showd significantly lower
Accuracy compared to other methods which high-
lithed the importance of implying CD detection algo-
rithms.
Conclusively, while PRDD delivers dominant per-
formance in most settings, there are specific instances
requiring further investigation. The overall results,
combined with its computational efficiency, position
PRDD as a qualified choice. However, understanding
the nuances of each dataset and scenario will further
enhance its applicability and effectiveness.
5.3.2 Rank Statistics for Abrupt Drifts
In addition to the learner performance metrics, we
also analyzed the rank statistics of each algorithm’s
performance in terms of Accuracy and F1-score
across the Abrupt drift datasets. Rank-based eval-
uation can offer a different perspective, as it aggre-
gates model performance across multiple datasets and
illustrates algorithmic consistency and relative per-
formance across diverse datasets. The rank statis-
tics for Accuracy and F1-score across the Abrupt drift
datasets are shown in Table 3. For each model, the
mean rank and standard deviation (Std. Dev.) are
computed. The rank of an algorithm on a dataset is
determined by its position in the sorted list of algo-
rithm performances, with rank 1 being the best.
Our proposed algorithm stands out in this rank-
based evaluation, securing the top position with a
mean rank of 1.75 in terms of Accuracy and 1.69 for
F1-score-based ranking. The low standard deviations
of 1.39 for both metrics further emphasize PRDD’s
consistently high performance across the board. In
the ranking hierarchy, HDDM A and HDDM W trail
closely with mean ranks of 2.13 and 3.25, respec-
tively. Following them are KSWIN and EDDM. Ho-
effdingTree, on the other hand, consistently ranks at
the bottom with a mean rank of 7 for both metrics,
highlighting the evident advantage of specialized drift
detection techniques over more generic methods in
stream learning scenarios.
Overall, these results highlight the robustness and
superior performance of our proposed real-drift detec-
tion algorithm in handling Abrupt CDs. The ensuing
sections will further explore the algorithm’s perfor-
mance on Gradual drift datasets and its computational
efficiency.
5.4 Performance Evaluation on
Gradual Drift
Within this section, we delve into the comparative
analysis of algorithmic performance on datasets char-
acterized by gradual drifts, which is a complex and
subtle challenge in the domain of data stream learn-
ing.
5.4.1 Performance on Gradual Drifts
The performance of the algorithms, when confronted
with Gradual real drifts, is a crucial aspect to con-
sider, given the subtlety of these drifts and the con-
sequent difficulty in their detection. To that end, we
assessed the seven algorithms across the eight Grad-
ual drift datasets, with respect to Accuracy and F1-
A Probabilistic Approach for Detecting Real Concept Drift
307

Table 2: Model Performance Metrics (Accuracy and F1-score) Across Abrupt Drift Datasets.
PRDD ADWIN KSWIN EDDM HDDM W HDDM A HoeffdingTree
Acc. F1 Acc. F1 Acc. F1 Acc. F1 Acc. F1 Acc. F1 Acc. F1
MixedF1 91.19 91.20 89.51 89.54 90.65 90.65 90.43 90.43 91.03 91.03 91.18 91.19 83.35 84.37
MixedF2 91.22 91.22 89.00 89.00 90.82 90.83 89.91 89.94 91.18 91.17 90.94 90.96 80.84 79.30
RTF1 80.15 77.97 77.44 75.09 79.85 77.76 76.67 74.54 78.15 75.65 80.34 78.56 73.46 72.05
RTF2 82.70 81.10 78.45 75.77 80.18 78.28 75.68 73.46 79.30 77.38 81.79 79.89 72.16 71.09
SineF1 93.04 93.05 91.96 91.96 92.95 92.94 90.58 90.55 93.00 93.00 93.05 93.05 63.85 59.68
SineF2 93.19 93.19 91.31 91.34 92.90 92.90 89.93 90.01 93.17 93.15 92.94 92.95 56.29 58.39
StaggerF1 91.44 91.78 93.19 93.50 91.13 91.56 96.12 96.23 92.02 92.56 94.34 94.59 88.82 89.47
StaggerF2 97.70 97.73 94.95 94.99 92.65 93.10 97.32 97.35 95.36 95.52 96.44 96.51 92.62 92.57
Table 3: Rank Statistics for Accuracy and F1-score Across
Abrupt Drift Datasets.
Accuracy Rank F1-score Rank
Model Mean Std. Dev. Mean Std. Dev.
HoeffdingTree 7.00 0.00 7.00 0.00
ADWIN 5.00 0.93 5.00 0.93
EDDM 4.63 2.00 4.63 2.00
KSWIN 4.25 1.17 4.25 1.17
HDDM W 3.25 0.89 3.25 0.89
HDDM A 2.13 0.84 2.19 0.75
PRDD 1.75 1.39 1.69 1.39
score metrics compiled in Table 4. Our proposed al-
gorithm maintained its superior performance, again
dominating in 6 out of 8 datasets including, MixedF1,
MixedF2, RTF2, SineF1, SineF2, and StaggerF2.
These results provide compelling evidence of the pro-
posed model’s proficiency at detecting and respond-
ing to Gradual real drifts.
While PRDD exhibited superior performance
across most datasets, there were instances when other
algorithms surged ahead. For instance, in the RTF1
dataset, HDDM A marginally surpassed PRDD in
both Accuracy and F1-score. In the StaggerF1
dataset, although HDDM A achieved the highest ac-
curacy and F1-score, it trailed behind PRDD. As ob-
served in the abrupt scenario, no single algorithm con-
sistently dominates in all scenarios, underscoring the
potential for future research to delve into algorithmic
intricacies and potential areas of enhancement.
HDDM W, on the other hand, delivered com-
mendable results, securing a solid third position.
However, the performance of other methods such as
EDDM, ADWIN, and KSWIN was more variable on
Gradual datasets. As anticipated, the model without a
detector lagged significantly behind its counterparts.
To sum up, our proposed PRDD method demon-
strated remarkable adeptness at managing Gradual
drifts. Yet, the nuanced variations in performance
across different datasets emphasize the significance
of tailoring algorithm selection to the specific dataset
in question. Subsequent sections will provide a more
detailed, rank-based comparative analysis to further
illuminate these observations.
5.4.2 Rank Statistics for Gradual Drifts
In our efforts to offer a consolidated perspective on
the performance of each algorithm under Gradual real
drifts, rank statistics were computed across the eight
Gradual drift datasets. Rankings were ascertained
based on Accuracy and F1-score, where a lower rank
implies enhanced performance. The findings are en-
capsulated in Table 5.
In alignment with our previous observations,
PRDD, our proposed model firmly holds the top po-
sition. It secures an admirable mean rank of 1.63
(with a standard deviation of 1.07) for both Accu-
racy and F1-score metrics. These data further solidify
PRDD’s prowess in detecting and adeptly handling
Gradual real drifts. The second-best in accuracy is
HDDM A, which registers a mean rank of 2.13. Fol-
lowing closely, HDDM W clinches the third spot with
an average rank of 2.75 for Accuracy. The other al-
gorithms, EDDM, ADWIN, and KSWIN, display a
more varied rank distribution, echoing their incon-
sistent performance across different datasets. Pre-
dictably, the HoeffdingTree model, devoid of any de-
tector, languishes at the bottom with a mean rank of 7
for both Accuracy and F1-score.
The results of our rank-based analysis align with
and underscore our previous discussions, emphasiz-
ing the effectiveness and robustness of PRDD against
gradual real drifts in data streams. Figure 1 depicts the
rank distribution for each method in the 16 datasets.
As highlighted, PRDD consistently achieves the top
rank, closely followed by HDDM A.
5.5 Execution Time Analysis
The processing speed and efficiency of a real-drift de-
tection algorithm are fundamental, equating in im-
portance to its predictive accuracy. Swiftly address-
ing and adjusting to ongoing data stream alterations
are essential features of a leading CD detection algo-
rithm.
Figure 2 reveals that our proposed model consis-
tently demonstrates computational efficiency, clock-
ICAART 2024 - 16th International Conference on Agents and Artificial Intelligence
308
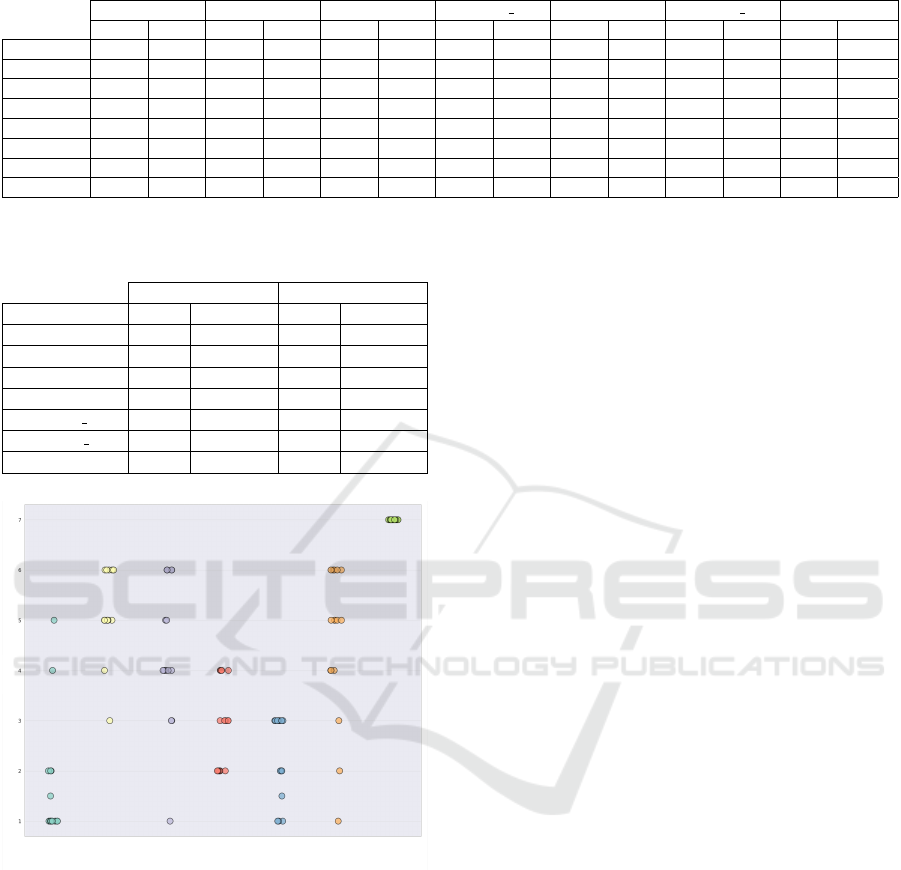
Table 4: Model Performance Metrics (Accuracy and F1-score) Across Gradual Drift Datasets.
PRDD ADWIN KSWIN HDDM W EDDM HDDM A HoeffdingTree
Acc. F1 Acc. F1 Acc. F1 Acc. F1 Acc. F1 Acc. F1 Acc. F1
MixedF1 88.92 88.90 86.42 86.43 86.35 86.41 88.14 88.17 87.97 87.97 88.61 88.61 83.53 83.96
MixedF2 88.79 88.83 86.53 86.61 88.01 88.06 88.12 88.09 87.90 87.94 88.37 88.40 81.94 81.41
RTF1 79.33 76.61 77.18 74.25 76.01 74.34 78.61 75.97 78.43 75.89 79.35 76.80 72.11 70.60
RTF2 80.19 77.98 78.02 74.76 76.79 75.05 79.04 76.52 76.35 74.59 79.39 76.34 71.45 71.65
SineF1 90.38 90.34 88.97 88.91 77.82 77.21 90.33 90.26 88.32 88.33 90.03 90.01 64.68 60.06
SineF2 91.00 91.01 88.70 88.69 74.72 75.35 90.51 90.52 89.57 89.60 90.49 90.50 58.40 58.90
StaggerF1 93.13 93.34 91.55 92.04 92.97 93.22 94.68 94.83 94.46 94.63 94.78 94.96 87.13 88.14
StaggerF2 97.66 97.67 92.01 92.34 84.88 83.75 96.86 96.87 95.29 95.37 96.93 96.93 91.08 91.15
Table 5: Rank Statistics for Accuracy and F1-score Across
Gradual Drift Datasets.
Accuracy Rank F1-score Rank
Model Mean Std. Dev. Mean Std. Dev.
HoeffdingTree 7.00 0.00 7.00 0.00
KSWIN 5.13 0.84 5.38 0.75
ADWIN 4.88 1.73 4.63 1.67
EDDM 4.5 0.92 4.50 0.92
HDDM W 2.75 0.71 2.63 0.74
HDDM A 2.13 0.83 2.25 0.89
PRDD 1.63 1.07 1.63 1.07
PRDD Adwin KSWIN HDDM_W
models
HDDM_A EDDM
Hoeffding Tree
F1- Rank
Figure 1: Ranking distribution of algorithms across multi-
ple datasets.
ing an average execution time of approximately 5 sec-
onds across the tested datasets. This level of effi-
ciency is maintained even when compared to a base-
line model devoid of a drift detection feature. The
precisely built design of our model, with a O(1) time
complexity per data point, is essential to its resilient
efficiency. PRDD employs a moving window to cal-
culate essential metrics such as mean probabilities
and drift ratios. A naive approach would require re-
calculating these measures for every point within the
window with each new data addition, incurring sig-
nificant computing costs.
In contrast, our model includes an optimization in
the form of a ”running sum” technique. The opera-
tional dynamics of the ”running sum” technique are
as follows:
• Data Ingestion: As new data points are received,
they are immediately incorporated into the run-
ning sum, ensuring real-time updates.
• Window Saturation: Once the moving window
reaches its capacity, for every subsequent data
point, the model seamlessly updates the running
sum. This is achieved by subtracting the value of
the oldest data point (the one that exits the win-
dow) and adding the value of the incoming data
point.
This methodological approach eliminates the need
for recalculating the sum for the entire window with
each incoming data point, considerably mitigating
computational overhead. Such an optimized mech-
anism not only assures prompt updates but also po-
sitions our model as a standout choice for real-time
applications necessitating immediate responsiveness.
Additionally, updating base learners, such as the
HoeffdingTree, to accommodate data changes can be
computationally burdensome, especially in the face
of drift. Detecting drift early and swiftly adapting
to the emerging data patterns is, therefore, paramount
to achieving improved computational efficiency. Our
model’s ability to proactively detect and manage
drifts is a significant advantage. It cuts down the high
computational costs that come with constantly adjust-
ing to evolving data. Since our model has an O(1)
time complexity it responds quickly to changes and
maintains consistent performance. This efficiency is
retained regardless of how large the incoming data
stream becomes.
A comparative analysis with benchmark models
is also instructive. For instance, models like HDDM
and ADWIN, despite their constant time complexity,
register average execution times close to 6 seconds.
The EDDM model clocks in at about 7 seconds on
average. In contrast, the KSWIN model, bearing a
time complexity of O(w) where w is the window size,
A Probabilistic Approach for Detecting Real Concept Drift
309

Figure 2: Execution time of models on all the datasets.
records an average execution time of nearly 10 sec-
onds, almost twice that of our proposition.
The differences in these execution times, when all
models use a consistent base learner, offer a clear
efficiency contrast among the drift detection algo-
rithms. This comparison underscores our method’s
dual strength in both prediction and computation.
Consequently, our proposed model stands out as
an optimal choice for handling high-velocity data
streams.
6 CONCLUSION AND FUTURE
WORK
Predictive models based on historical patterns are sus-
ceptible to performance degradation in non-stationary
environments where the underlying data distributions
shift over time. Therefore, devising algorithms that
can effectively capture and adapt to Concept Drift
(CD) is crucial. Our proposed Probabilistic Real-Drift
Detection (PRDD) algorithm demonstrates excellent
performance in identifying real CD with high sen-
sitivity, rendering it a practical and reliable tool for
real-world data-stream applications. The PRDD’s ro-
bustness and adaptability are further evidenced by its
consistent performance under various drift dynamics,
including Gradual drifts.
Future work presents numerous research direc-
tions. Firstly, we plan to investigate CD in real-world
applications, an area that currently lacks sufficient ex-
ploration in the literature. Specifically, we will focus
on credit card fraud, an ever-evolving field. Our aim
is to understand the nature and characteristics of CD
in this application, considering that CD can occur in
both normal data (changes in users’ spending habits
or e-payment channels) and fraud data (fraudsters up-
dating their strategies in response to new technolo-
gies). Such insights will be invaluable in devising
even more effective predictive models to tackle CD.
Also, we aim to compare our active adaptive learn-
ing method to the passive learning method (Sadreddin
and Sadaoui, 2022).
REFERENCES
Baena-Garcıa, M., del Campo-
´
Avila, J., Fidalgo, R., Bifet,
A., Gavalda, R., and Morales-Bueno, R. (2006). Early
drift detection method. In Fourth international work-
shop on knowledge discovery from data streams, vol-
ume 6, pages 77–86.
Barros, R. S., Cabral, D. R., Gonc¸alves Jr, P. M., and Santos,
S. G. (2017). Rddm: Reactive drift detection method.
Expert Systems with Applications, 90:344–355.
Barros, R. S. M. and Santos, S. G. T. C. (2018). A large-
scale comparison of concept drift detectors. Informa-
tion Sciences, 451:348–370.
Bifet, A. and Gavalda, R. (2007). Learning from time-
changing data with adaptive windowing. In Proceed-
ings of the 2007 SIAM international conference on
data mining, pages 443–448. SIAM.
de Lima Cabral, D. R. and de Barros, R. S. M. (2018). Con-
cept drift detection based on fisher’s exact test. Infor-
mation Sciences, 442:220–234.
Frias-Blanco, I., del Campo-
´
Avila, J., Ramos-Jimenez, G.,
Morales-Bueno, R., Ortiz-Diaz, A., and Caballero-
Mota, Y. (2014). Online and non-parametric drift de-
tection methods based on hoeffding’s bounds. IEEE
Transactions on Knowledge and Data Engineering,
27(3):810–823.
Gama, J. and Castillo, G. (2006). Learning with local
drift detection. In Advanced Data Mining and Ap-
plications: Second International Conference, ADMA
2006, Xi’an, China, August 14-16, 2006 Proceedings
2, pages 42–55. Springer.
Gama, J., Medas, P., Castillo, G., and Rodrigues, P. (2004).
Learning with drift detection. In Brazilian symposium
on artificial intelligence, pages 286–295. Springer.
Gama, J.,
ˇ
Zliobait
˙
e, I., Bifet, A., Pechenizkiy, M., and
Bouchachia, A. (2014). A survey on concept
drift adaptation. ACM computing surveys (CSUR),
46(4):1–37.
Gonc¸alves Jr, P. M., de Carvalho Santos, S. G., Barros,
R. S., and Vieira, D. C. (2014). A comparative study
on concept drift detectors. Expert Systems with Appli-
cations, 41(18):8144–8156.
Hoens, T. R., Polikar, R., and Chawla, N. V. (2012). Learn-
ing from streaming data with concept drift and imbal-
ance: an overview. Progress in Artificial Intelligence,
1:89–101.
Huang, D. T. J., Koh, Y. S., Dobbie, G., and Pears, R.
(2014). Detecting volatility shift in data streams. In
2014 IEEE International Conference on Data Mining,
pages 863–868. IEEE.
ICAART 2024 - 16th International Conference on Agents and Artificial Intelligence
310

Klinkenberg, R. and Renz, I. (1998). Adaptive information
filtering: Learning in the presence of concept drifts.
Learning for text categorization, pages 33–40.
L
´
opez Lobo, J. (2020). Synthetic datasets for concept drift
detection purposes. Harv. Dataverse.
Lu, J., Liu, A., Dong, F., Gu, F., Gama, J., and Zhang,
G. (2018). Learning under concept drift: A review.
IEEE transactions on knowledge and data engineer-
ing, 31(12):2346–2363.
Nishida, K. and Yamauchi, K. (2007). Detecting concept
drift using statistical testing. In International confer-
ence on discovery science, pages 264–269. Springer.
Page, E. S. (1954). Continuous inspection schemes.
Biometrika, 41(1/2):100–115.
Parasteh, S. and Sadaoui, S. (2023). A Novel Probabilistic
Approach for Detecting Concept Drift in Streaming
Data. In International Conference on Deep Learn-
ing Theory and Applications, Delta, Springer Nature,
pages 173–188.
Pears, R., Sakthithasan, S., and Koh, Y. S. (2014). Detect-
ing concept change in dynamic data streams. Machine
Learning, 97(3):259–293.
Pesaranghader, A. and Viktor, H. L. (2016). Fast hoeffd-
ing drift detection method for evolving data streams.
In Joint European conference on machine learning
and knowledge discovery in databases, pages 96–111.
Springer.
Pesaranghader, A., Viktor, H. L., and Paquet, E. (2018).
Mcdiarmid drift detection methods for evolving data
streams. In 2018 International Joint Conference on
Neural Networks (IJCNN), pages 1–9. IEEE.
Raab, C., Heusinger, M., and Schleif, F.-M. (2020). Re-
active soft prototype computing for concept drift
streams. Neurocomputing, 416:340–351.
Ross, G. J., Adams, N. M., Tasoulis, D. K., and Hand,
D. J. (2012a). Exponentially weighted moving aver-
age charts for detecting concept drift. Pattern recog-
nition letters, 33(2):191–198.
Ross, G. J., Adams, N. M., Tasoulis, D. K., and Hand,
D. J. (2012b). Exponentially weighted moving aver-
age charts for detecting concept drift. Pattern recog-
nition letters, 33(2):191–198.
Sadreddin, A. and Sadaoui, S. (2022). Chunk-based in-
cremental feature learning for credit-card fraud data
stream. Journal of Experimental & Theoretical Artifi-
cial Intelligence, 0(0):1–19.
Tsymbal, A. (2004). The problem of concept drift: defi-
nitions and related work. Computer Science Depart-
ment, Trinity College Dublin, 106(2):58.
Webb, G. I., Hyde, R., Cao, H., Nguyen, H. L., and Petit-
jean, F. (2016). Characterizing concept drift. Data
Mining and Knowledge Discovery, 30(4):964–994.
Webb, G. I., Lee, L. K., Petitjean, F., and Goethals, B.
(2017). Understanding concept drift. arXiv preprint
arXiv:1704.00362.
Widmer, G. and Kubat, M. (1996). Learning in the pres-
ence of concept drift and hidden contexts. Machine
learning, 23(1):69–101.
A Probabilistic Approach for Detecting Real Concept Drift
311
