
Symmetry Completion Test: A Novel Approach for Visual Distortion
Mapping and Correction Using Symmetry Constraints
Ye Ling
1 a
, David M. Frohlich
2 b
, Tom H. Williamson
3 c
and Jean-Yves Guillemaut
1 d
1
Centre for Vision, Speech and Signal Processing, University of Surrey, Guildford, U.K.
2
Digital World Research Centre, University of Surrey, Guildford, U.K.
3
Guy’s and St Thomas’ NHS Foundation Trust, London, U.K.
Keywords:
Metamorphopsia, Visual Distortion, Image Warping, Assistive Technology.
Abstract:
Metamorphopsia, commonly referred to as distorted vision, is a serious visual impairment which remains
uncorrectable by optical glasses or contact lenses. This paper presents a novel approach to digitally map visual
distortion based on patient feedback. The approach is based on the use of low-level geometrical constraints
(central symmetry) which provide a simple and intuitive mechanism for a patient to provide feedback on their
perceived visual distortion. We derive a set of fundamental constraints and show how visual distortion mapping
can be framed as an optimisation problem. Critically, a parametric distortion model based on MLS is used
to reduce the dimensionality of the problem and enable detailed visual distortion estimation. An extensive
evaluation using simulated data demonstrates the accuracy and robustness of the approach. This approach
opens up the possibility of correcting for visual distortion by applying the inverse mapping on the input stream
to for instance VR see-through devices or screen-based devices.
1 INTRODUCTION
Vision constitutes a vital sensory function facilitat-
ing the human body’s perception of the external en-
vironment. The World Health Organization (WHO)
reports that the global population afflicted with visual
impairment approaches approximately 2.2 billion in-
dividuals (WHO-Newsroom, 2023). Common con-
ditions such as myopia and presbyopia can be cor-
rected through the utilization of optical glasses or
contact lenses. However, there are numerous other
visual impairments that are not amenable to cor-
rection, thereby necessitating the use of low-vision
aids, which are only partially effective for a subset
of these impairments. Examples of such aids in-
clude large print books, handheld magnifiers, CCTV
screen magnifiers, microscope and telescope devices,
tinted sunglasses and filters, and assistive settings on
screens that enable modifications to font size, con-
trast and colour. The possibility of incorporating
some of these functions into head-mounted displays
a
https://orcid.org/0000-0002-9973-2302
b
https://orcid.org/0000-0003-3483-9915
c
https://orcid.org/0000-0002-1879-449X
d
https://orcid.org/0000-0001-8223-5505
has been explored experimentally, on and off, for
over 20 years (Massof, 1998). In recent years, there
has been a growing commercial viability of such sys-
tems, leading to the emergence of various low vision
“see-through” headsets in the market, such as eSight
Eyewear, NuEyes Pro Smart Glasses and IrisVision
(Deemer et al., 2018). Most of these devices typically
incorporate basic manual adjustments for magnifica-
tion, contrast, and colour settings, and in some cases,
they may also feature text recognition capabilities for
speech output. These show some benefit to low vi-
sion sufferers, but a challenge now exists to extend
the functionality of these headsets to more complex
conditions and customize them to the unique capabil-
ities of individuals (Zhao et al., 2019), such as meta-
morphopsia. This paper introduces a new approach
for the mapping and correction of metamorphopsia or
distorted vision, which is a common symptom of age-
related macular degeneration and other retinal disor-
ders.
Metamorphopsia, a condition characterized by vi-
sual distortion, results in the perception of straight
lines as curved, as depicted in Figure 1. Figure 1a
shows the well-known painting “Mona Lisa”. How-
ever, from the perspective of an individual suffering
from metamorphopsia, some regions are perceived as
414
Ling, Y., Frohlich, D., Williamson, T. and Guillemaut, J.
Symmetry Completion Test: A Novel Approach for Visual Distortion Mapping and Correction Using Symmetry Constraints.
DOI: 10.5220/0012378000003660
Paper published under CC license (CC BY-NC-ND 4.0)
In Proceedings of the 19th International Joint Conference on Computer Vision, Imaging and Computer Graphics Theory and Applications (VISIGRAPP 2024) - Volume 4: VISAPP, pages
414-425
ISBN: 978-989-758-679-8; ISSN: 2184-4321
Proceedings Copyright © 2024 by SCITEPRESS – Science and Technology Publications, Lda.
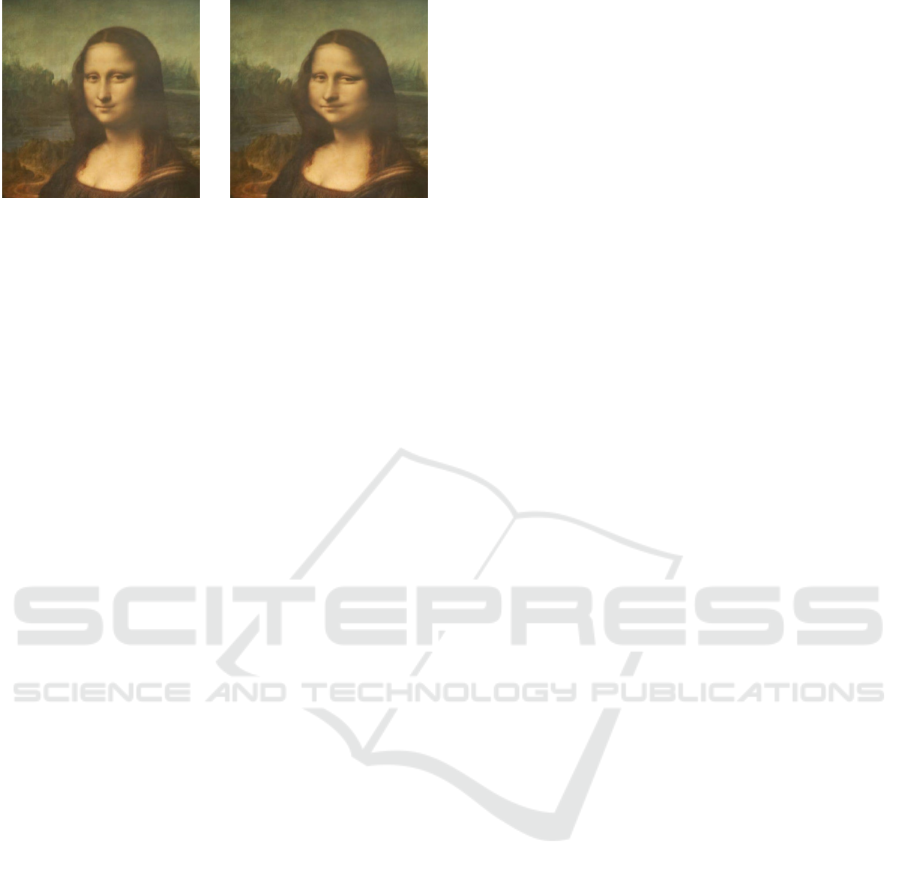
(a) Normal vision. (b) Distorted vision.
Figure 1: Illustration of the effects of metamorphopsia. An
image seen by a healthy person (a) will appear distorted (b)
to a person suffering from metamorphopsia.
distorted. Figure 1b shows a simulated representation
of this perceived distorted vision. According to pre-
vious studies (Bouwens and van Meurs, 2003; Bex,
2010; Burke, 1999; Cohen et al., 2003; Jensen and
Larsen, 1998; Mansouri et al., 2009; Zur and Ullman,
2003; Ugarte et al., 2013; Simunovic, 2015), this is-
sue is considered to be caused by the displacement of
photoreceptors or the re-organization of visual cortex
and perception adjustment after sensory input inter-
ruption from the retina in macular disease. Traditional
optical correction methods involving glasses and con-
tact lenses fail to adequately address these distortions
since they primarily stem from retinal damage rather
than a mere obstruction of light passage through the
eye. It also moves with the eye, making fixed optical
correction useless. Regrettably, no effective clinical
treatment method for this problem has been identi-
fied.
Digital approaches open up novel avenues to over-
come those limitations by manipulating the image
presented to the user with a view to restoring healthy
vision. The advancement of Augmented Reality (AR)
headsets and 3D displays serves as a solid hardware
foundation to support these efforts. The fundamen-
tal concept underlying the utilization of digital tech-
nologies involves the application of inverted deforma-
tions within the video stream transmitted through see-
through devices, thereby enabling the compensation
of visual distortions experienced by the affected eye.
Thus, the estimation of the visual distortion mapping
becomes the major task.
This paper proposes a monocular approach for ac-
curate mapping of visual distortion termed the “Sym-
metry Completion Test”. Being monocular, the ap-
proach can be applied separately to each eye and it
does not rely on having a distortion-free reference
eye to guide the distortion mapping process. The
key idea behind the approach is to leverage simple
low-level geometric constraints (central symmetry) in
order to interactively discover the distortion experi-
enced by a patient. A distortion model based on Mov-
ing Least Squares (MLS) is also introduced in order
to parametrise distortion using a small number of vari-
ables. Patient feedback on each symmetry constraint
is used to formulate an energy function which is op-
timised to retrieve the model parameters representing
the visual distortion experienced by each participant.
The paper makes the following key contributions.
First, it introduces the central symmetry constraints
that form the foundation for the distortion mapping
test. These are rigorously developed with full math-
ematical detail and derivation provided. Second, we
demonstrate how these can be incorporated into an ef-
fective optimisation framework to retrieve visual dis-
tortion. In particular, we show how a low-dimensional
parametric model can be leveraged to overcome the
high-dimensionality issues pertaining to estimating
visual distortion across the visual field. Finally, we
carry out an extensive evaluation to validate the ap-
proach.
The remainder of this paper is organized as fol-
lows. Section 2 gives an overview of the literature
relevant to this study, highlighting the existing body
of knowledge in the field. Section 3 introduces the
methodology and implementation details. Section 4
presents the results obtained from the simulation ex-
periments. Section 5 concludes by summarising the
findings and discussing avenues for future work.
2 RELATED WORK
The idea of utilizing computer vision technology to
improve impaired human vision can be traced back
to the 80s. (Peli and Peli, 1984) introduced an ap-
plication that employed adaptive image enhancement
techniques to enhance visual perception in individu-
als with low vision. Additionally, enlargement tech-
niques have gained significant popularity in the realm
of low vision improvement, as evidenced by studies
(Vargas-Mart
´
ın et al., 2005; Szpiro et al., 2016; Zhao
et al., 2019). Colour inversion is a useful method for
low-vision people. (Szpiro et al., 2016) introduces
a method for low vision improvement by inverting
colours while (Peli, 1994) uses white and black to
present text. Both of them achieve the purpose of
improving low vision by using high contrast. In addi-
tion, edge detection emerges as another viable method
for enhancing visual acuity in individuals with low vi-
sion, as exemplified by studies (Vargas-Mart
´
ın et al.,
2005; Szpiro et al., 2016; Zhao et al., 2019). While
these above methods have proven effective in address-
ing various visual impairments, they fall short in their
ability to correct metamorphopsia. As described in
Symmetry Completion Test: A Novel Approach for Visual Distortion Mapping and Correction Using Symmetry Constraints
415

Section 1, metamorphopsia presents unique and un-
predictable visual distortions. Consequently, correct-
ing metamorphopsia proves to be a formidable chal-
lenge in the absence of an accurate mapping of the
specific visual distortions associated with this condi-
tion.
The methodology known as square completion
task, as introduced in (Wiecek et al., 2015), presents
an approach to map the visual distortion. This method
involves presenting four corner points and a central
fixation point to the participant. Among the four cor-
ners, one serves as a reference point, while the partic-
ipant’s task is to adjust the positions of the remaining
three corners until they form a regular square within
their visual field. Subsequently, the participant is
required to confirm a midpoint on each side of the
square. Consequently, data for eight points can be ob-
tained based on a single corner of the square. This
process is repeated with different reference points un-
til all four corners have been tested. Ultimately, the
mean value of the eight points obtained from each
corner is employed to describe the participant’s visual
distortion. Although it attempts to quantify the distor-
tion, this approach suffers from two key limitations.
Firstly, it only provides a sparse characterisation of
the distortion pattern, being limited to 8 points within
the field of view. This restricted sampling may fail
to capture the full extent and complexity of the visual
distortion. Secondly, the use of averaging to fuse the
results from the different trials may introduce errors
when confronted with asymmetric distortions.
A useful method for mapping and compensating
for distorted vision is presented in (Bozzelli et al.,
2020; Cimmino et al., 2021). In this approach, par-
ticipants are tasked with adjusting a generated Am-
sler grid by manipulating the positions of its vertices
until the grid assumes the appearance of a regular,
straight-line grid. Subsequently, the developed appli-
cation utilizes this mapping of geometrical deforma-
tion to correct visual distortion in real-time through
the manipulation of the video stream in an AR head-
set. However, this method is not without its limita-
tions. Many participants reported discomfort while
wearing the AR headset during the operation, which
adversely affected their overall experience. Addition-
ally, the calibration procedure required for accurate
mapping was found to be time-consuming, further im-
peding the efficiency of the process. Consequently, a
mere 28% of participants successfully completed the
entire testing procedure, indicating the need for fur-
ther improvement in terms of comfort and usability to
enhance user participation and compliance.
The interactive line manipulation method repre-
sents an innovative approach aimed at visualizing
the distorted view experienced by individuals with
metamorphopsia (Ichige et al., 2019; Moritake et al.,
2021; Zhu et al., 2022). This technique detects dis-
tortion through the analysis of horizontal and verti-
cal straight lines and subsequently corrects the distor-
tion by adjusting the parameters associated with the
anchor points within the affected area. By applying
the derived deformation to an input image, a compen-
satory effect on the visual distortion can be achieved.
However, one notable challenge encountered in the
implementation of this method is the uncontrollable
duration of the testing process. Particularly in cases
where the distortion exhibits complexities, the exper-
iment duration tends to be significantly prolonged.
This issue poses practical limitations, as it hampers
the efficiency and feasibility of the technique, neces-
sitating further exploration and refinement to expedite
the testing procedure without compromising the accu-
racy of the distortion analysis and correction.
Another interesting approach is the one introduced
by (Zaman et al., 2020; Ong et al., 2022). Different
from the methods introduced before, the mapping of
visual distortion is obtained first and then the purpose
of correcting the visual distortion is achieved by ap-
plying the mapping. In this study, a novel approach is
introduced, wherein the distorted areas are substituted
with black holes of equivalent size. Thus, the defor-
mation is suppressed by integration with the normal
vision of the healthy eye. The overall deformation
is effectively mitigated. While this particular method
may not directly map or correct the visual deforma-
tion, it offers an interesting means of alleviating dis-
torted vision. The incorporation of black holes to re-
place the affected areas holds promise in reducing the
visual impact of the distortion by leveraging the in-
tegration of the remaining intact visual information.
Although further research is necessary to fully eval-
uate and optimize the effectiveness of this approach,
it represents a noteworthy avenue for mitigating the
effects of distorted vision.
None of these previous tests have yet demon-
strated suitability for extensive clinical implementa-
tion. This paper aims to address some of the previous
shortcomings by introducing a novel and practical ap-
proach that enables accurate dense visual distortion
mapping. A key insight is the combination of the use
of low-level geometric constraints (central symmetry
constraints), that provide a simple way for the patient
to provide constraints on distortion, with the use of
a low-dimensional parametric model of visual distor-
tion, to achieve dense and scalable mapping. An ini-
tial demonstration of the test was presented in (Ling
et al., 2023).
VISAPP 2024 - 19th International Conference on Computer Vision Theory and Applications
416

3 METHODOLOGY
This section describes the proposed approach for
monocular mapping of visual distortion from low-
level geometric constraints provided by the user. The
section starts by formulating the problem in mathe-
matical terms and stating the assumptions. It then
introduces the proposed geometric constraints under-
pinning the approach. Next, it describes how visual
distortion is inferred from these by framing the prob-
lem as an energy minimisation problem and introduc-
ing some regularisation constraints. Finally, the im-
plementation details are provided.
3.1 Problem Statement and
Assumptions
Consider the problem of recovering a 2D deforma-
tion field d defined over the visual field I of a pa-
tient’s eye affected by metamorphopsia. d represents
the perceived distortion as a 2D displacement vector
at each point in I . Note that d models visual distor-
tion only in a single eye. However, the approach is
easily extended to model binocular metamorphopsia
by recovering a separate displacement field for each
eye. Without loss of generality, we describe the re-
covery of the deformation field for a single eye in the
rest of the paper.
Given that the visual distortion manifests itself as
a result of retinal issues (e.g. detached retina), it
tracks the gaze direction of the patient. Visual dis-
tortion is therefore mapped in the visual field centred
around the gaze direction of the patient. To eliminate
the dependency on gaze direction, the patient is re-
quested to rest their head on a chin-rest and maintain
their focus on a fixation point located at the centre
of the screen throughout the test. This assumption
may be relaxed in the future through the use of eye-
tracking technology.
3.2 Central Symmetry Constraints
The patient’s distortion is not directly observable. The
main idea behind the proposed approach is to derive
a constraint on the visual distortion through the com-
pletion of a simple interactive test involving low-level
geometric constraints, more specifically central sym-
metry. While other types of low-level constraints may
be considered (e.g. axial symmetry, collinearity or or-
thogonality), central symmetry was selected for the
intuitiveness of the resulting test.
In a nutshell, the patient is presented with three
points on a screen such that one of them is the mid-
point of the segment defined by the other two. These
points would be perceived as satisfying a central sym-
metry constraint by a person with healthy vision, but
will usually not satisfy this constraint for a patient suf-
fering from metamorphopsia if the points fall within
the area of the visual field affected by visual distor-
tion. The patient is therefore asked to displace one
of the points to satisfy central symmetry. Such a test
provides a constraint, which can be used to infer the
deformation field. Next, we provide a derivation of
the two types of symmetry constraints considered de-
pending on which point is manipulated.
3.2.1 Type 1 Constraint: Side Point Correction
Let us consider three points P, O and Q such that O
is the midpoint of the segment PQ. We also assume
O is located at the centre of the screen and used as a
fixation point. Since P, O and Q satisfy the central
symmetry constraint in screen coordinates, as shown
in Figure 2a, we have:
2O = P + Q. (1)
However, as a result of visual distortion displayed
in Figure 2b, the patient will perceive the points as
distorted with the following locations in the patient’s
view:
P
d
= P +d(P), O
d
= O +d(O), Q
d
= Q +d(Q). (2)
These will not normally satisfy the symmetry con-
straint.
The patient is required to displace the side point Q
to satisfy the central symmetry constraint, as shown
in Figure 2c. Let us denote by v
P
(Q) the 2D displace-
ment that needs to be applied to Q in order to satisfy
that constraint and by Q
′
= Q + v
P
(Q) the resulting
displaced point in screen coordinates. Due to visual
distortion, Q
′
will be perceived at the following loca-
tion in the patient’s view:
Q
′
d
= Q
′
+ d(Q
′
) = Q + v
P
(Q) + d(Q
′
). (3)
The perceived points P
d
, O
d
and Q
′
d
now satisfy the
central symmetry constraint in the patient’s view:
2O
d
= P
d
+ Q
′
d
. (4)
Substituting (2) and (3) into (4), we obtain:
2O + 2d(O) = P + d(P) + Q + v
P
(Q) + d(Q
′
), (5)
which, after simplification using (1) and rearranging,
gives:
d(P) + d(Q
′
) −2d(O) + v
P
(Q) = 0. (6)
(6) defines a constraint relating the correction made
to the side point Q by the user to enforce central sym-
metry and the visual distortion at P, O and Q
′
.
Symmetry Completion Test: A Novel Approach for Visual Distortion Mapping and Correction Using Symmetry Constraints
417
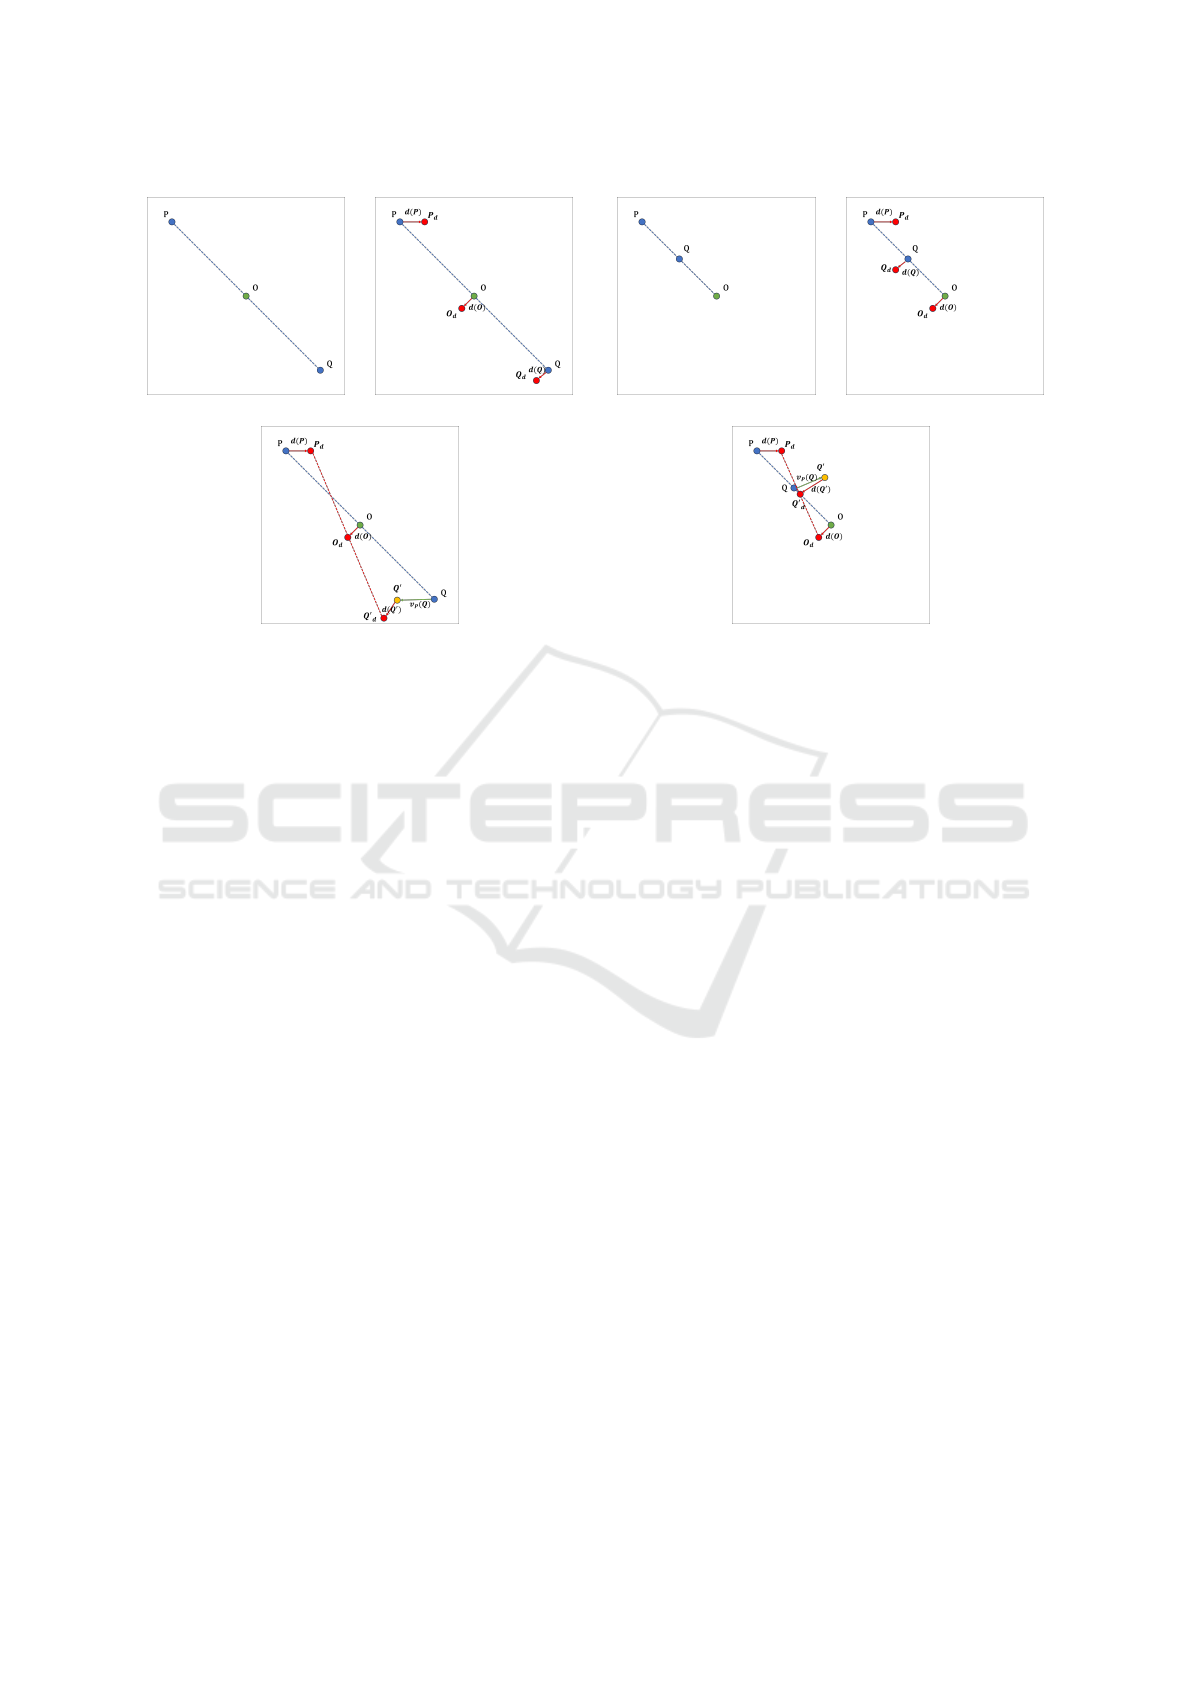
(a) Normal vision. (b) Distorted vision.
(c) Constraint diagram.
Figure 2: Illustration of the Type 1 symmetry constraint.
3.2.2 Type 2 Constraint: Central Point
Correction
Let us consider again three points P, O and Q, but this
time such that the user-controlled point Q is the mid-
point of the segment OP. The diagram used to explain
the relationship can be found in Figure 3. As in the
previous case, we assume O is located at the centre of
the screen and used as a fixation point. The deriva-
tion of the resulting constraint is similar to that of the
previous constraint and we therefore only describe the
main steps for brevity, reusing the same notation. It
follows from the symmetry constraint that:
2Q = P + O. (7)
After the displacement of Q by the patient, the per-
ceived points P
d
, O
d
and Q
′
d
satisfy the central sym-
metry constraint in the patient’s view:
2Q
′
d
= P
d
+ O
d
. (8)
Substituting (2) and (3) into (8), we have:
2Q + 2v
P
(Q) + 2d(Q
′
) = P + d(P) + O + d(O), (9)
which can be simplified using (7) and rearranged to:
2v
P
(Q) + 2d(Q
′
) −d(P) −d(O) = 0. (10)
(10) defines a constraint relating the correction made
to the central point Q by the user to enforce symmetry
and the visual distortion at P, O and Q
′
.
3.3 Cost Function Definition and
Optimisation
Recovery of the visual distortion d from the previ-
ous constraints is framed as an energy minimisation
(a) Normal vision. (b) Distorted vision.
(c) Constraint diagram.
Figure 3: Illustration of the Type 2 symmetry constraint.
problem. We consider multiple symmetry constraints
of both types introduced earlier and obtained by con-
sidering different point locations to sample the visual
field. In our implementation, we consider 24 refer-
ence points arranged in a 5 ×5 regular grid covering
8
◦
as described in Figure 4. The reference point de-
fines the location of P for each of the two types of
constraint.
(6) and (10) each define two constraints on the vi-
sual distortion d (one for each axis). However, each
symmetry constraint generates four unknowns relat-
ing to the displacements at P and Q
′
(two unknowns
per point). As such, this defines an under-constrained
system of equations and direct optimisation is not
possible. To overcome this, we introduce some reg-
ularisation by using a parametric model to represent
the visual distortion d. More specifically, the Moving
Least Squares (MLS) introduced in (Schaefer et al.,
2006) is used to parametrise distortion using a small
number of control points. In our implementation,
eight control points are used. These include four mov-
able handles used to control the image deformation
and four fixed corner points used to anchor the image.
This defines a total of eight degrees of freedom (two
per movable handle). The corner point constraints
embedded in our MLS model are useful to resolve the
rigid image transformation ambiguity (rotation, trans-
lation, scaling) present in the cost function.
The solution is found by finding the visual dis-
tortion d which minimises the following energy func-
VISAPP 2024 - 19th International Conference on Computer Vision Theory and Applications
418
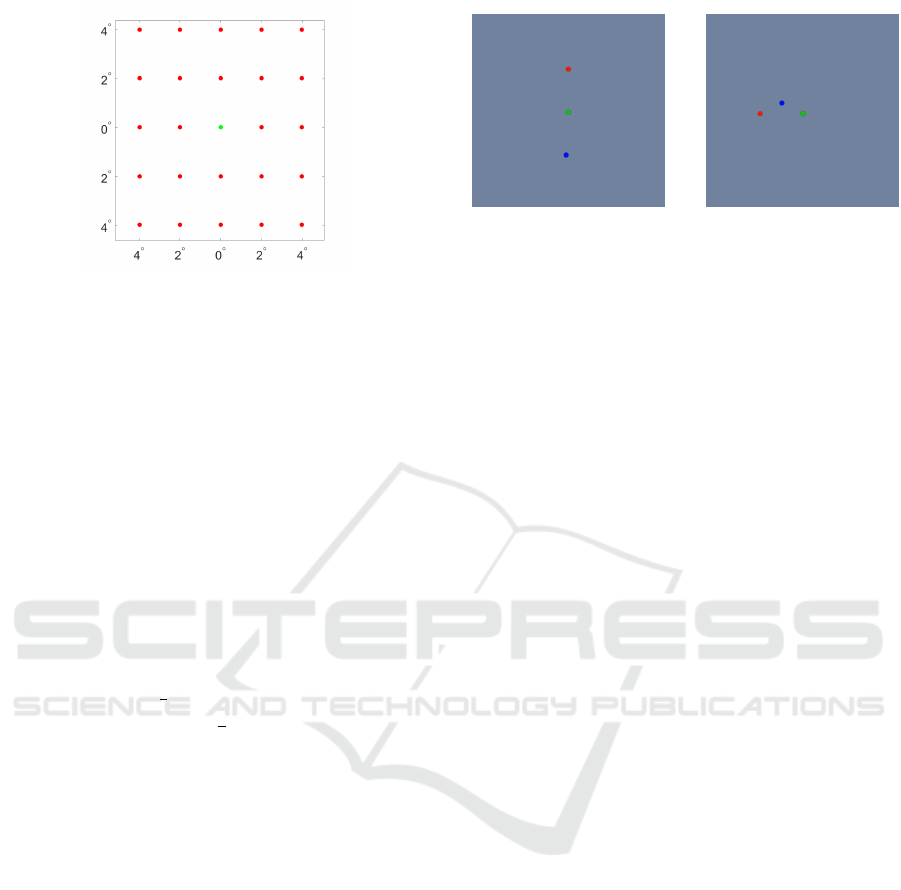
Figure 4: Reference points distribution within the visual
field. The red points denote the reference points, while the
green point denotes the fixation point.
tion:
E(d) =
N
1
∑
i=0
L
δ
1
(e
1
(d, i)) +
N
1
∑
i=0
L
δ
2
(e
2
(d, i)), (11)
where N
1
and N
2
denote the number of Type 1 and
Type 2 symmetry constraints respectively. The indi-
vidual errors for each type of constraint are derived
from (6) and (10) and defined as follows:
e
1
(d, i) = ∥d(P
i
) + d(Q
′
i
) −2d(O) + v
P
i
(Q
i
)∥, (12)
e
2
(d, i) = ∥2v
P
i
(Q
i
) + 2d(Q
′
i
) −d(P
i
) −d(O)∥.
(13)
For robustness to errors in the satisfaction of the con-
straints, the Huber loss L
δ
is used:
L
δ
(e) =
(
1
2
e
2
, if
|
e
|
≤ δ,
δ(
|
e
|
−
1
2
δ), otherwise.
(14)
The parameters δ
1
and δ
2
are set to the median of
the individual errors {e
1
(d, i)}
N
1
i=1
and {e
2
(d, i)}
N
2
i=1
,
respectively. Optimization is performed using the pat-
ternsearch algorithm implemented in Matlab (Audet
and Dennis Jr, 2002; Kolda et al., 2006; Lewis et al.,
2007).
3.4 Implementation and Practical
Considerations
To ensure standardised testing conditions, partici-
pants are required to position themselves in front of
the screen and rest their heads on the chin-rest to
maintain a fixed distance from the screen. Being a
monocular test, the participant needs to cover the fel-
low eye. Throughout the test, participants are re-
quired to maintain their focus on the central fixation
point. As described in Section 3, there are two dif-
ferent central symmetrical constraints. Thus, the par-
ticipant needs to displace the movable point to satisfy
the constraints one by one. The test procedure is as
follows:
(a) Type 1 constraint: cen-
tral fixation point (green)
as centre of symmetry.
(b) Type 2 constraint: blue
point as centre of symme-
try.
Figure 5: Screenshot showing the two different central sym-
metric constraints presented to the patient.
Step 1: The participant is required to manipulate the
blue point to fulfil a type 1 constraint, as shown
in Figure 5a. Once the participant has confirmed
that the three points satisfy the constraint, they can
proceed to the next randomly selected reference
point.
Step 2: Repeat Step 1 until all reference points have
been tested.
Step 3: The participant is required to manipulate the
blue point to fulfil a type 2 constraint, as shown
in Figure 5b. Once the participant has confirmed
that the three points satisfy the constraint, they can
proceed to the next randomly selected reference
point.
Step 4: Repeat Step 3 until all reference points have
been tested.
Step 5: Compute the distortion map by optimising
the cost function and save the data.
This process bears some similarities with the
square completion task proposed by (Wiecek et al.,
2015), as both methods rely on point-based operations
and employ geometric constraints. However, there are
notable distinctions between the two approaches. In
contrast to the square completion task, this method
presents only three dots to the participant, reducing
the complexity of the task. Additionally, the geo-
metric constraints utilised by the two methods dif-
fer. While this method adopts central symmetric con-
straints, the square completion task primarily utilizes
four corner points and four mid-points on the side to
establish a regular square. In summary, when com-
pared to the square completion task, this method of-
fers enhanced ease of operation. Moreover, it success-
fully overcomes the square completion task’s inherent
limitation in handling asymmetrical patterns. By em-
ploying a simplified dot arrangement and a more prin-
cipled set of geometric constraints, we achieve a more
straightforward and accurate approach to mapping the
visual distortion.
Symmetry Completion Test: A Novel Approach for Visual Distortion Mapping and Correction Using Symmetry Constraints
419

Sym.
Macrop.
Sym.
Microp.
Asym.
Macrop.
Asym.
Microp.
Complex
Distortion 1.
Complex
Distortion 2.
Central
“kink”.
Figure 6: The seven distortion patterns used in the simulation experiments.
4 EXPERIMENTAL EVALUATION
To evaluate the approach, we conducted a series of
experiments using simulated visual distortions. The
evaluation considers seven different distortion pat-
terns whose choice was informed by a discussion with
an experienced ophthalmologist. The selected distor-
tion patterns comprise symmetrical macropsia, sym-
metrical micropsia, asymmetrical macropsia, asym-
metrical micropsia, two complex distortions, and a
central “Kink” distortion, as depicted in Figure 6.
Each distortion pattern provides Ground Truth (GT)
information on the distortion at each pixel in the vi-
sual field and is used to calculate the correction re-
quired to enforce the central symmetry constraint for
each reference point considered, thereby simulating
the response of a patient.
4.1 Ablation Study
An ablation study is conducted to validate the bene-
fit of the two types of constraints introduced. To this
end, the proposed approach is evaluated using type 1
only, type 2 only and both types of constraints. Sev-
eral metrics, including the structural similarity index
measure (SSIM), peak signal-to-noise ratio (PSNR),
and root mean square error (RMSE), are used to quan-
tify the similarity between the mapped distortion and
the GT. Since metamorphopsia primarily affects the
central area of the visual field, measurements are fo-
cused on a square region centred on the central fixa-
tion point. This square has a side length equivalent to
a visual angle of 10
◦
, extending 5
◦
outward from the
central fixation point. Moreover, the number of itera-
tions and cost function executions are also counted to
measure the computational complexity.
As can be seen in Table 1, the proposed approach
using both types of constraints uses far less comput-
ing power than the other approaches considering only
one type of constraint while achieving comparable
or better performance. Figure 7 also shows that the
approach combining both types of constraints over-
comes the limitation of the type 1 constraint which
Table 1: Ablation study results analysing the effect of both
types of constraints on performance.
Metric
Type 1 Type 2 Types 1 & 2
Sym.
Macrop.
PSNR (dB) ↑ 10.12 11.61 11.86
SSIM ↑ 0.60 0.66 0.68
RMSE (
◦
) ↓ 0.24 0.12 0.13
Iteration ↓ 90 158 66
Func-Count ↓ 1149 2028 869
Sym.
Microp.
PSNR (dB) ↑ 9.61 11.49 10.26
SSIM ↑ 0.57 0.66 0.60
RMSE (
◦
) ↓ 0.25 0.13 0.17
Iteration ↓ 264 148 108
Func-Count ↓ 3183 1892 1394
Asym.
Macrop.
PSNR (dB) ↑ 8.89 11.87 9.66
SSIM ↑ 0.52 0.72 0.57
RMSE (
◦
) ↓ 0.22 0.14 0.17
Iteration ↓ 174 162 118
Func-Count ↓ 2167 2039 1493
Asym.
Microp.
PSNR (dB) ↑ 8.25 10.19 8.55
SSIM ↑ 0.46 0.58 0.49
RMSE (
◦
) ↓ 0.27 0.15 0.22
Iteration ↓ 170 174 154
Func-Count ↓ 2121 2166 1867
Complex
1
PSNR (dB) ↑ 8.93 10.39 10.90
SSIM ↑ 0.51 0.60 0.64
RMSE (
◦
) ↓ 0.26 0.20 0.19
Iteration ↓ 106 126 110
Func-Count ↓ 1311 1648 1364
Complex
2
PSNR (dB) ↑ 10.114 10.329 10.326
SSIM ↑ 0.596 0.604 0.598
RMSE (
◦
) ↓ 0.22 0.22 0.21
Iteration ↓ 164 152 68
Func-Count ↓ 2048 1924 889
Central
“kink”
PSNR (dB) ↑ 15.82 12.59 15.37
SSIM ↑ 0.82 0.69 0.81
RMSE (
◦
) ↓ 0.05 0.09 0.06
Iteration ↓ 184 126 90
Func-Count ↓ 2242 1589 1141
cannot retrieve symmetric distortion patterns when
used on its own. The green square denotes the spe-
cific region of interest used to calculate the metrics.
4.2 Robustness to Noise Analysis
Displacements estimated directly from the GT in or-
der to satisfy the central symmetry constraint provide
VISAPP 2024 - 19th International Conference on Computer Vision Theory and Applications
420
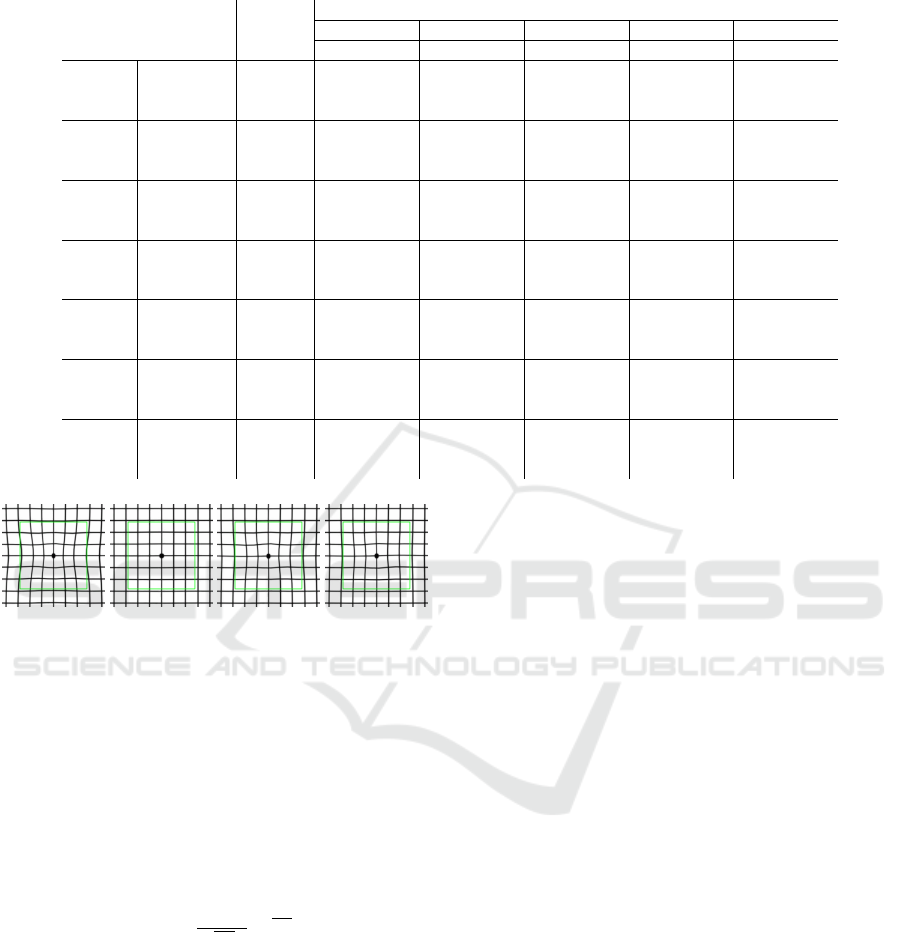
Table 2: Experimental results for different noise levels.
Metric No Noise
Gassian Noise
5 10 15 20 25
Mean Std Mean Std Mean Std Mean Std Mean Std
Sym.
Macrop.
PSNR (dB) ↑ 15.81 10.97 0.92 10.09 1.30 9.50 1.10 9.07 0.96 8.79 0.94
SSIM ↑ 0.82 0.64 0.05 0.59 0.07 0.55 0.07 0.52 0.07 0.49 0.07
RMSE (
◦
) ↓ 0.07 0.15 0.03 0.19 0.05 0.24 0.08 0.29 0.10 0.34 0.11
Sym.
Microp.
PSNR (dB) ↑ 14.93 10.98 1.29 9.67 1.06 9.24 0.84 8.86 0.99 8.63 0.86
SSIM ↑ 0.79 0.64 0.07 0.55 0.07 0.52 0.06 0.49 0.08 0.47 0.06
RMSE (
◦
) ↓ 0.07 0.16 0.04 0.22 0.06 0.26 0.09 0.31 0.11 0.35 0.12
Asym.
Macrop.
PSNR (dB) ↑ 14.44 10.10 1.11 9.85 1.19 9.36 1.10 9.04 0.88 8.78 0.89
SSIM ↑ 0.78 0.59 0.06 0.57 0.07 0.53 0.07 0.51 0.07 0.49 0.07
RMSE (
◦
) ↓ 0.08 0.17 0.04 0.20 0.06 0.25 0.09 0.30 0.11 0.36 0.13
Asym.
Microp.
PSNR (dB) ↑ 12.51 9.18 1.13 9.38 1.31 9.03 1.27 8.83 0.95 8.56 0.91
SSIM ↑ 0.71 0.52 0.06 0.53 0.09 0.50 0.09 0.49 0.07 0.47 0.07
RMSE (
◦
) ↓ 0.09 0.20 0.05 0.21 0.06 0.27 0.10 0.30 0.11 0.34 0.11
Complex
1
PSNR (dB) ↑ 9.37 10.02 0.46 9.46 0.49 8.71 0.51 8.63 0.52 8.27 0.53
SSIM ↑ 0.55 0.58 0.03 0.55 0.04 0.49 0.04 0.48 0.05 0.45 0.05
RMSE (
◦
) ↓ 0.27 0.22 0.03 0.25 0.04 0.32 0.06 0.34 0.08 0.41 0.12
Complex
2
PSNR (dB) ↑ 10.46 10.06 0.57 9.48 0.62 8.80 0.59 8.60 0.63 8.38 0.56
SSIM ↑ 0.61 0.59 0.04 0.55 0.05 0.50 0.05 0.48 0.05 0.46 0.05
RMSE (
◦
) ↓ 0.21 0.22 0.02 0.25 0.05 0.31 0.08 0.33 0.09 0.36 0.09
Central
“kink”
PSNR (dB) ↑ 14.87 13.05 1.33 10.91 1.56 9.76 1.31 9.20 0.84 8.72 0.91
SSIM ↑ 0.80 0.73 0.05 0.63 0.08 0.56 0.08 0.52 0.06 0.49 0.07
RMSE (
◦
) ↓ 0.07 0.09 0.03 0.14 0.05 0.22 0.07 0.26 0.09 0.35 0.11
(a) GT. (b) Type 1. (c) Type 2. (d) Types 1 &
2.
Figure 7: Example of mapped visual distortion for the
symmetrical micropsia pattern using different types of con-
straints.
an ideal patient response that is unlikely to be possi-
ble in practice. To simulate human errors and have a
more realistic evaluation scenario, random Gaussian
noise is introduced to corrupt those ideal displace-
ments. The noise is determined based on the radial
visual angle distances and defined as follows for each
coordinate:
f (x) =
1
√
2πσ
e
−
x
2
2σ
2
(15)
where σ represents the percentage of the radial dis-
tance to the central fixation point. This ensures that
the magnitude of the added Gaussian noise is depen-
dent on the distance from the central fixation point, to
model the decrease in visual acuity the further away
the point is from the fovea. To assess the robust-
ness of the method, simulation experiments are con-
ducted using 6 different noise levels, corresponding
to σ equals to 0% (no noise), 5%, 10%, 15%, 20% and
25%, with 50 iterations for each noise level. Perfor-
mance is again evaluated by comparing the mapped
distortions to the GT for each distortion pattern using
the SSIM, PSNR and RMSE metrics calculated over
the central region of the field of view.
Experimental results with the different noise levels
are shown in Table 2. The mean and standard devi-
ation of the 50 simulation experiments of each noise
level are presented. To facilitate visual analysis of the
experimental results, box and whisker plots are used,
as depicted in Figure 8 in the case of the symmetrical
macropsia pattern. It is evident that all three similar-
ity measurement methods exhibit fluctuations within
a certain range, attributable to the inclusion of ran-
dom Gaussian noise in each experiment. As expected,
it can be observed that the similarity decreases as the
noise level increases.
4.3 Effect of Distortion Pattern
We now evaluate how performance is impacted by the
distortion pattern. The analysis is conducted with a
noise level of σ = 10% which was identified as most
representative of the noise level seen with real pa-
tients. As can be seen in Figure 9, the symmetry com-
pletion test exhibits some robustness to noise, with
nearly all PSNR values exceeding 8 dB, the majority
of SSIM values surpassing 0.5 and most RMSE val-
ues falling below 0.3
◦
. However, it is important to
note that the performance in the case of complex dis-
tortion patterns is notably poorer compared to other
distortion patterns. This suggests that the method ex-
hibits limitations when confronted with complex dis-
Symmetry Completion Test: A Novel Approach for Visual Distortion Mapping and Correction Using Symmetry Constraints
421
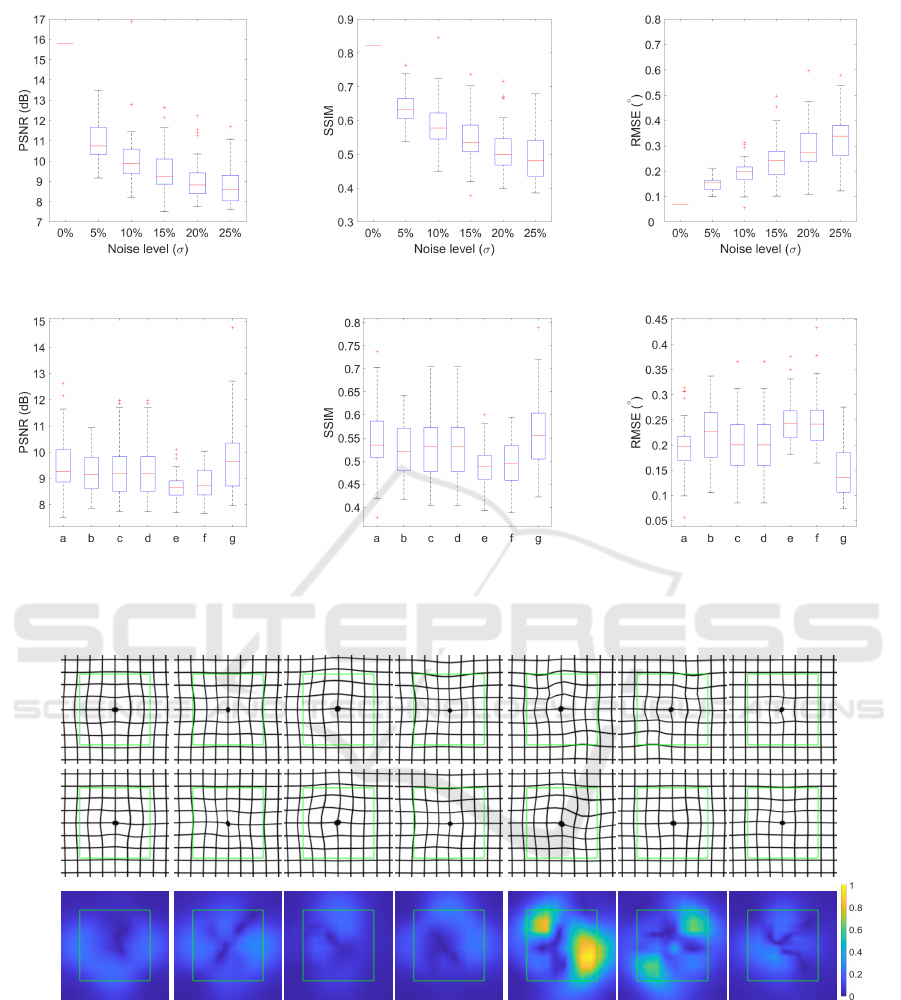
Figure 8: The different noise similarity results for the symmetrical macropsia pattern.
Figure 9: The seven distortion patterns similarity results of the noise level σ = 10%. The letter labels from left to right in
each figure correspond to seven distortion patterns: (a) Symmetrical macropsia; (b) Symmetrical micropsia; (c) Asymmetrical
macropsia; (d) Asymmetrical micropsia; (e) Complex distortion 1; (f) Complex distortion 2; (g) Central “Kink”.
GT
Result
Heatmap
Sym. Sym. Asym. Asym. Comp. Comp. Central
Macropsia Micropsia Macropsia Micropsia Distortion 1 Distortion 2 “Kink”
Figure 10: Estimated distortions and their error maps for some of the simulated tests in case of the seven different simulated
distortion patterns for the noise level of σ = 10%.
tortions, as the designed distortion model, which only
employs four handles in the central area, struggles to
adequately address such complexities.
Additionally, to visualise the disparities between
the generated images and the GT, error heatmaps are
computed. The heatmaps use a uniform scale across
all the results to facilitate comparison, as illustrated
in Figure 10. In line with the results shown in Fig-
ure 9, the error for the complex distortion patterns ex-
hibits more pronounced deviations compared to other
patterns. In contrast, the results for symmetrical and
asymmetrical patterns align closely with the GT, in-
VISAPP 2024 - 19th International Conference on Computer Vision Theory and Applications
422
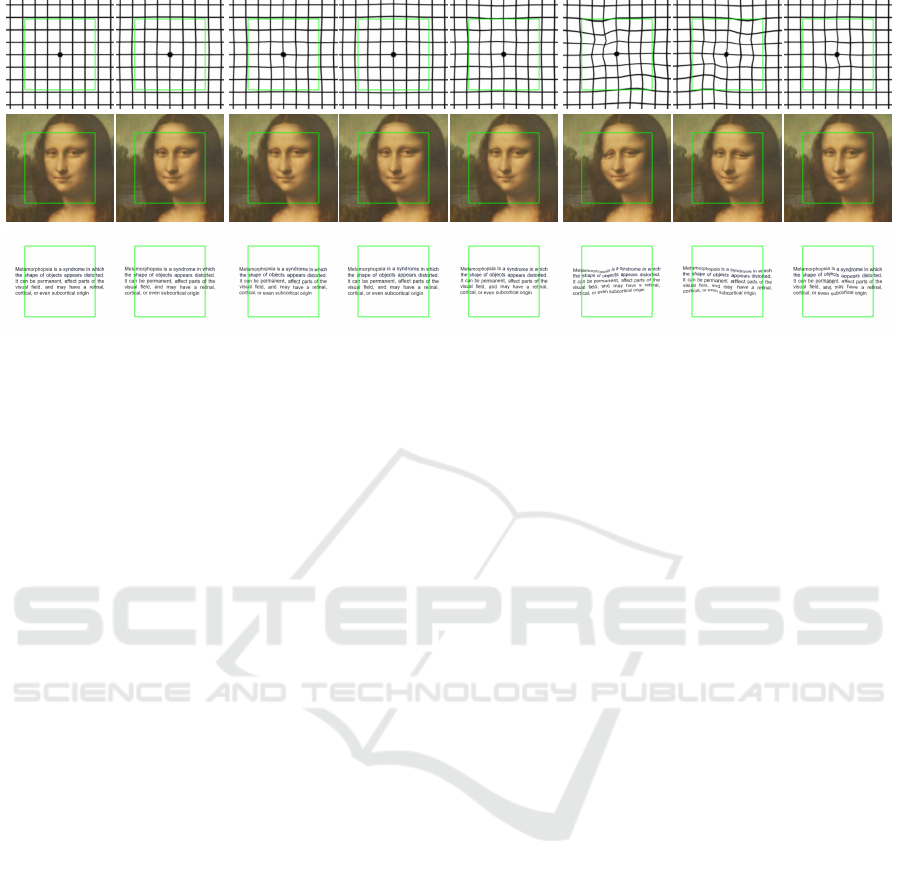
Normal Sym. Sym. Asym. Asym. Comp. Comp. Central
Image Macropsia Micropsia Macropsia Micropsia Distortion 1 Distortion 2 “Kink”
Figure 11: Correction applied on distortion results (the image should look normal if the correction is perfect) on different
contents for some of the simulated tests in the case of the seven different simulated distortion patterns.
dicating the superior performance of the symmetry
completion method for such distortions. As previ-
ously discussed, the method demonstrates limitations
when confronted with complex distortions. More-
over, the error heatmap for the Central “Kink” pattern
reveals some deviations. This can be attributed to the
lack of handles at the central point of the designed
MLS distortion model. This causes some difficulties
in accurately mapping the distortion associated with
the distortion at the central fixation point.
4.4 Correction Results
Here we assess the efficacy of the correction by com-
paring images that have been corrected by inverting
the mapped distortion, to the original undistorted im-
ages. Different types of content are considered to il-
lustrate the effect across different possible use cases.
As illustrated in Figure 11, the symmetrical and asym-
metrical distorted patterns can be corrected very ef-
fectively. For complex and central “kink” distortion
patterns, the distortion has only been partially cor-
rected with some clearly visible residual distortion.
4.5 Comparison Against Square
Completion Task
As previously discussed, this method bears some
similarities with the square completion task from
(Wiecek et al., 2015) since both methods use points
and geometric rules to operate. Therefore, a set of
comparison experiments is conducted using the seven
distortion patterns. The comparative evaluation is car-
ried out in the case of the noise-free input measure-
ments. The GT distortion is used to calculate the loca-
tion of the 16 points (two squares) in the square com-
pletion task. The symmetry completion test proceeds
as described previously using 24 reference points.
The two methods are then compared by assessing the
estimated distortion at the 16 points. The 16 points
representing the squares for the seven distortion pat-
terns are displayed in Figure 12. Green represents the
GT, blue shows the results of the symmetry comple-
tion test and red corresponds to the square comple-
tion task results. The symmetry completion test re-
sults are more accurate than the results of the square
completion task as the blue squares are mostly per-
fectly aligned with the GT (the green square). Again,
the symmetry completion test results for the complex
distortion patterns are misaligned at the corner of the
bigger square which means the distortions of these
two patterns cannot be corrected perfectly. This is
consistent with the previous analysis showing that this
method suffers from limitations with complex distor-
tions. Compared to the square completion task, our
method successfully overcomes the square comple-
tion task’s inherent limitation in handling asymmetri-
cal patterns, while also being able to produce a dense
visual distortion map.
5 CONCLUSIONS AND FUTURE
WORK
We presented a novel approach for mapping visual
distortion based on low-level geometric constraints
(central symmetry). We demonstrated how an energy
Symmetry Completion Test: A Novel Approach for Visual Distortion Mapping and Correction Using Symmetry Constraints
423
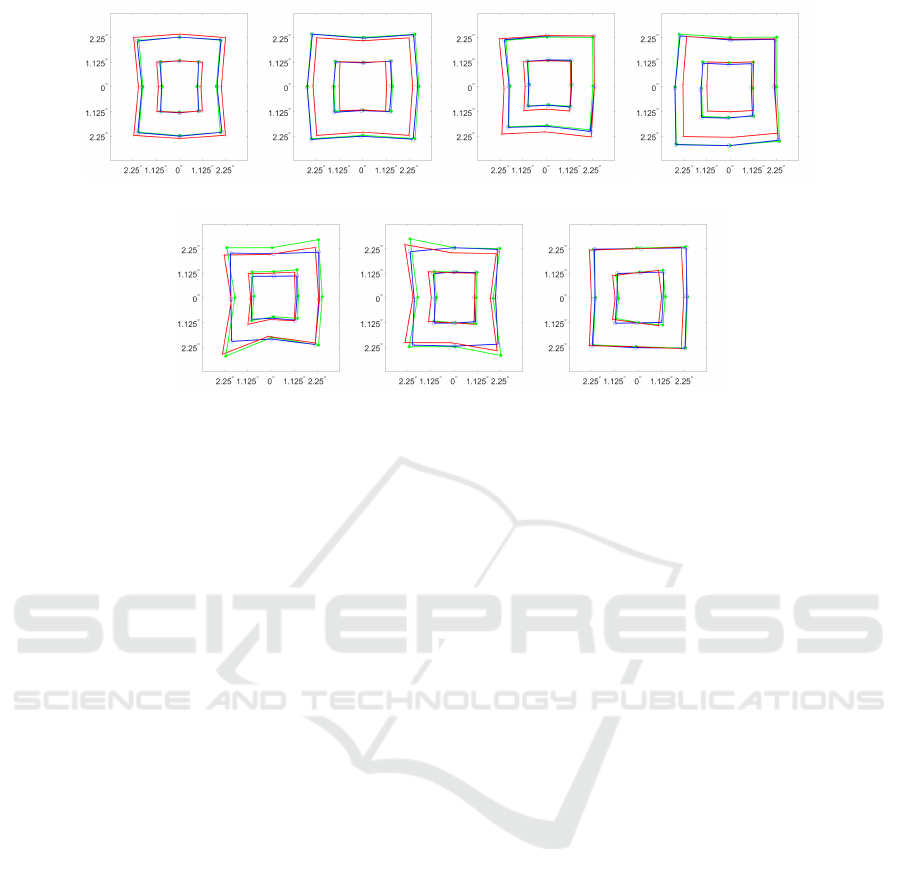
Sym. Macrop. Sym. Microp. Asym. Macrop. Asym. Microp.
Complex 1. Complex 2. Kink.
Figure 12: Comparative results for the seven distortion patterns. The green colour is the GT, the blue colour is the result of
the symmetry completion test and the red colour is the result of the square completion task.
function can be defined based on these low-level con-
straints and effectively optimised using a parametric
model of distortion based on MLS. Analysis of the
simulation data reveals that the symmetry completion
method is able to accurately map visual distortion and
exhibits some robustness to noise. The predefined
distortion model, constrained by a limited number of
handles and fixed positions, suffers from inaccuracies
when estimating more complex distortions. Further-
more, the absence of a handle at the central point re-
stricts the method’s ability to address distortion oc-
curring at this location.
The demonstrated capability of this approach on
simulated data to estimate visual distortion in indi-
viduals affected by metamorphopsia provides a com-
pelling foundation for the development of an applica-
tion utilizing see-through devices. The next step is to
clinically evaluate the method with real patients living
with metamorphopsia. The approach has received a
favourable ethics opinion and is about to be clinically
evaluated at St Thomas’ Hospital in London with pa-
tients suffering from metamorphopsia, following the
protocol outlined in (Ling et al., 2023). Moreover,
as the method requires the participant to maintain the
focus on the central fixation point, employing eye-
tracking technology may be a good strategy to moni-
tor the satisfaction of this constraint. Leveraging the
integration of an eye tracker also holds promising po-
tential in dynamically compensating for the distorted
vision experienced by individuals with metamorphop-
sia. A particularly interesting avenue for future work
is to investigate how the technology could benefit pa-
tients as a corrective device. In the future, we would
like to explore how these algorithms may be deployed
across other types of devices such as headsets or 3D
tablets and also extend the correction to dynamically
adapt it to gaze direction through eye tracking.
REFERENCES
Audet, C. and Dennis Jr, J. E. (2002). Analysis of general-
ized pattern searches. SIAM Journal on Optimization,
13(3):889–903.
Bex, P. J. (2010). (in) sensitivity to spatial distortion in nat-
ural scenes. Journal of Vision, 10(2):23–23.
Bouwens, M. D. and van Meurs, J. C. (2003). Sine am-
sler charts: a new method for the follow-up of meta-
morphopsia in patients undergoing macular pucker
surgery. Graefe’s Archive for Clinical and Experimen-
tal Ophthalmology, 241(2):89–93.
Bozzelli, G., De Nino, M., Pero, C., and Ricciardi, S.
(2020). Ar based user adaptive compensation of meta-
morphopsia. In Proceedings of the International Con-
ference on Advanced Visual Interfaces, pages 1–5.
Burke, W. (1999). Psychophysical observations concerned
with a foveal lesion (macular hole). Vision Research,
39(14):2421–2427.
Cimmino, L., Pero, C., Ricciardi, S., and Wan, S.
(2021). A method for user-customized compensa-
tion of metamorphopsia through video see-through
enabled head mounted display. Pattern Recognition
Letters, 151:252–258.
Cohen, S. Y., Lamarque, F., Saucet, J.-C., Provent, P., Lan-
gram, C., and LeGargasson, J.-F. (2003). Filling-in
phenomenon in patients with age-related macular de-
generation: differences regarding uni-or bilaterality of
central scotoma. Graefe’s Archive for Clinical and Ex-
perimental Ophthalmology, 241(10):785–791.
VISAPP 2024 - 19th International Conference on Computer Vision Theory and Applications
424

Deemer, A. D., Bradley, C. K., Ross, N. C., Natale, D. M.,
Itthipanichpong, R., Werblin, F. S., and Massof, R. W.
(2018). Low vision enhancement with head-mounted
video display systems: are we there yet? Optometry
and Vision Science, 95(9):694.
Ichige, H., Toyoura, M., Go, K., Kashiwagi, K., Fujishiro,
I., and Mao, X. (2019). Visual assessment of distorted
view for metamorphopsia patient by interactive line
manipulation. In 2019 International Conference on
Cyberworlds (CW), pages 187–190. IEEE.
Jensen, O. M. and Larsen, M. (1998). Objective assessment
of photoreceptor displacement and metamorphopsia:
a study of macular holes. Archives of Ophthalmology,
116(10):1303–1306.
Kolda, T. G., Lewis, R. M., Torczon, V., et al. (2006). A
generating set direct search augmented lagrangian al-
gorithm for optimization with a combination of gen-
eral and linear constraints. Technical report, Technical
Report SAND2006-5315, Sandia National Laborato-
ries.
Lewis, R. M., Shepherd, A., and Torczon, V. (2007). Im-
plementing generating set search methods for linearly
constrained minimization. SIAM Journal on Scientific
Computing, 29(6):2507–2530.
Ling, Y., Frohlich, D. M., Williamson, T. H., and Guille-
maut, J.-Y. (2023). A toolkit of approaches for digital
mapping and correction of visual distortion. In Pro-
ceedings of the 25th International ACM SIGACCESS
Conference on Computers and Accessibility, pages 1–
5.
Mansouri, B., Hansen, B. C., and Hess, R. F. (2009). Dis-
rupted retinotopic maps in amblyopia. Investigative
Ophthalmology & Visual Science, 50(7):3218–3225.
Massof, R. W. (1998). Electro-optical head-mounted low
vision enhancement. Practical Optometry, 9(6):214–
20.
Moritake, K., Zhu, Z., Toyoura, M., Go, K., Kashiwagi, K.,
Fujishiro, I., and Mao, X. (2021). Eye-tracker-free
compensation for metamorphopsia. In 2021 Interna-
tional Conference on Cyberworlds (CW), pages 78–
84. IEEE.
Ong, J., Zaman, N., Waisberg, E., Kamran, S. A., Lee,
A. G., and Tavakkoli, A. (2022). Head-mounted dig-
ital metamorphopsia suppression as a countermeasure
for macular-related visual distortions for prolonged
spaceflight missions and terrestrial health. Wearable
Technologies, 3:e26.
Peli, E. (1994). Binary head-mounted display as a low vi-
sion aid: 1: 40 pm (lv-109). Optometry and Vision
Science, 71(12):21.
Peli, E. and Peli, T. (1984). Image enhancement for the
visually impaired. Optical Engineering, 23(1):47–51.
Schaefer, S., McPhail, T., and Warren, J. (2006). Image de-
formation using moving least squares. In ACM SIG-
GRAPH 2006 Papers, pages 533–540.
Simunovic, M. P. (2015). Metamorphopsia and its quantifi-
cation. Retina, 35(7):1285–1291.
Szpiro, S. F. A., Hashash, S., Zhao, Y., and Azenkot, S.
(2016). How people with low vision access comput-
ing devices: Understanding challenges and opportu-
nities. In Proceedings of the 18th International ACM
SIGACCESS Conference on Computers and Accessi-
bility, pages 171–180.
Ugarte, M., Shunmugam, M., Laidlaw, D. A. H., and
Williamson, T. H. (2013). Morphision: a method for
subjective evaluation of metamorphopsia in patients
with unilateral macular pathology (ie, full thickness
macular hole and epiretinal membrane). Indian Jour-
nal of Ophthalmology, 61(11):653.
Vargas-Mart
´
ın, F., Pel
´
aez-Coca, M. D., Ros, E., Diaz, J.,
and Mota, S. (2005). A generic real-time video pro-
cessing unit for low vision. In International Congress
Series, volume 1282, pages 1075–1079. Elsevier.
WHO-Newsroom (2023). Blindness and vision impairment.
Wiecek, E., Lashkari, K., Dakin, S. C., and Bex, P. (2015).
Novel quantitative assessment of metamorphopsia in
maculopathy. Investigative Ophthalmology & Visual
Science, 56(1):494–504.
Zaman, N., Tavakkoli, A., and Zuckerbrod, S. (2020). A
mixed reality system for modeling perceptual deficit
to correct neural errors and recover functional vi-
sion. In 2020 IEEE Conference on Virtual Reality and
3D User Interfaces Abstracts and Workshops (VRW),
pages 269–274. IEEE.
Zhao, Y., Szpiro, S., Shi, L., and Azenkot, S. (2019). De-
signing and evaluating a customizable head-mounted
vision enhancement system for people with low vi-
sion. ACM Transactions on Accessible Computing
(TACCESS), 12(4):1–46.
Zhu, Z., Toyoura, M., Fujishiro, I., Go, K., Kashiwagi, K.,
and Mao, X. (2022). Linem: assessing metamorphop-
sia symptom using line manipulation task. The Visual
Computer, 38(5):1607–1617.
Zur, D. and Ullman, S. (2003). Filling-in of retinal sco-
tomas. Vision Research, 43(9):971–982.
Symmetry Completion Test: A Novel Approach for Visual Distortion Mapping and Correction Using Symmetry Constraints
425
