
Deep Learning-Powered Assembly Step Classification
for Intricate Machines
Luca Rodiga
1,2 a
, Eva Eggeling
2 b
, Ulrich Krispel
2 c
and Torsten Ullrich
1,2 d
1
Institute of Computer Graphics and Knowledge Visualization, Graz University of Technology, Graz, Austria
2
Fraunhofer Austria Research GmbH, Graz, Austria
Keywords:
Computer Vision, Deep Learning, Machine Learning.
Abstract:
Augmented Reality-based assistance systems can help qualified technicians by providing them with technical
details. However, the applicability is limited by the low availability of real data. In this paper, we focus on
synthetic renderings of CAD data. Our objective is to investigate different model architectures within the
machine-learning component and compare their performance. The training data consists of CAD renderings
from different viewpoints distributed over a sphere around the model. Utilizing the advantages of transfer
learning and pre-trained backbones we trained different versions of EfficientNet and EfficientNetV2 on these
images for every assembly step in two resolutions. The classification performance was evaluated on a smaller
test set of synthetic renderings and a dataset of real-world images of the model. The best Top1-accuracy on the
real-world dataset is achieved by the medium-sized EfficientNetV2 with 57.74%, while the best Top5-accuracy
is provided by EfficientNetV2 Small. Consequently, our approach has a good classification performance
indicating the real-world applicability of such a deep learning classifier in the near future.
1 INTRODUCTION
Technology is designed to serve human needs and
assist people by creating tools, systems, and solu-
tions that enhance human capabilities, improve effi-
ciency and simplify various tasks. One approach to
such an assistive system is based on augmented real-
ity (AR) (Azuma, 1993), (Caudell and Mizell, 1992).
Due to the increasing complexity of today’s ma-
chines, manufacturing and assembly tasks performed
by unassisted human workers are significantly more
error prone as a study by TANG et al. showed that the
use of an AR system reduced the error rate for an as-
sembly task by 82% compared to a paper manual and
other assistive systems (Tang et al., 2003). Another
study found similar results (Loch et al., 2016): These
systems can help technicians by providing them with
technical details, blueprints, manuals, and other types
of information precisely when they need it. This
means that technicians can have the next repair step
displayed right in their field of view, allowing them
a
https://orcid.org/0009-0000-7108-5855
b
https://orcid.org/0000-0001-6703-2865
c
https://orcid.org/0000-0001-8984-635X
d
https://orcid.org/0000-0002-7866-9762
to seamlessly continue with their tasks. Previous re-
search (Wiedenmaier et al., 2003) has shown that in
an assembly task of a window regulator, the AR-
supported assembly workers were about 33% faster
than workers, who were using paper manuals. How-
ever, in order to display the next step the system must
be able to classify the current state of the assembly.
This work focuses on a scenario where the assis-
tance system has to recognize the current construc-
tion step of a partially assembled model using deep
learning-based computer vision and thus be able to as-
sist the technician by providing visual instructions for
the next construction step. Such a system consists of
two main components. First, we need an AR-enabled
head-mounted display that is able to monitor the as-
sembly process through an integrated camera system,
(Kress and Cummings, 2017) (Evans et al., 2017).
The second part is a deep learning model capable of
classifying the visual information from the camera,
distinguishing assembly steps, and communicating
the result back. Since manually collecting real-world
training data by taking thousands of pictures from dif-
ferent angles for every construction step is a tedious
and time-consuming task, the model should be able
to learn the classification task on the Computer Aided
Design (CAD) model only. The advantage of this ap-
500
Rodiga, L., Eggeling, E., Krispel, U. and Ullrich, T.
Deep Learning-Powered Assembly Step Classification for Intricate Machines.
DOI: 10.5220/0012376300003660
Paper published under CC license (CC BY-NC-ND 4.0)
In Proceedings of the 19th International Joint Conference on Computer Vision, Imaging and Computer Graphics Theory and Applications (VISIGRAPP 2024) - Volume 4: VISAPP, pages
500-507
ISBN: 978-989-758-679-8; ISSN: 2184-4321
Proceedings Copyright © 2024 by SCITEPRESS – Science and Technology Publications, Lda.

proach is that an almost arbitrary amount of training
data can be generated fairly easily for anything that
has a CAD model including the assembly steps. This
paper specifically addresses the implementation and
training of the deep-learning-based computer vision
model.
2 RELATED WORK
Image classification is one of the fundamental prob-
lems in computer vision. It is defined by the pro-
cess of classifying an image and assigning a spe-
cific label to it (Russakovsky et al., 2015). Most
state-of-the-art approaches are based on the work of
KRIZHEVSKY et al. (Krizhevsky et al., 2012), where
the authors proposed the first general image classi-
fier based on a convolutional neural network (CNN)
called AlexNet. Since then, the concept has been
improved and the model architectures have become
more sophisticated, such as GoogLeNet (Szegedy
et al., 2015), ResNet (He et al., 2016), and Efficient-
Net (Tan and Le, 2019). Traditionally, training a
deep learning model for image classification requires
a large amount of annotated data and computational
resources. To overcome this limitation, a technique
called transfer learning has been widely used in re-
cent years. This technique exploits the feature extrac-
tion properties of deep CNNs by allowing the transfer
of existing domain knowledge to other domains (Niu
et al., 2020). To achieve this, state-of-the-art models
such as EfficientNet are pre-trained on large datasets
such as ImageNet (Deng et al., 2009), which teaches
them low-level classification capabilities such as edge
detection. Then a second training process fine-tunes
the model on the smaller custom dataset according to
the use case (Niu et al., 2020).
At present, LEGO is very popular among adults
and children and it’s widely available. In particu-
lar, the fine-grained and standardized parts of LEGO
Technic are similar to real-world machine parts and
can be used to build a wide range of simple to very
complex constructions (without the need of any non-
disclosure agreements).
The research by BOI
´
NSKI et al. aims to create
an automated LEGO brick sorter using deep neural
networks, where the authors evaluate 28 different im-
age classification models (Boi
´
nski et al., 2022). Their
research showed that deep learning models are well
suited for such a classification task as their best mod-
els were able to distinguish individual bricks almost
perfectly. However, the authors only used a small
subset of possible target classes from the thousands
of existing LEGO bricks.
The paper by VIDAL et al. tackles a problem,
that children around the world face on a daily ba-
sis, namely the tedious task of finding specific LEGO
bricks when looking at a pile of them (Vidal et al.,
2023). They used a supervised deep learning ap-
proach to this multi-label classification problem. In
addition, they used synthetically generated images to
improve their model performance in this data-limited
scenario. This shows that image classification models
are able to transfer the knowledge learned from syn-
thetic images to a real-world application, as their re-
ported average accuracy was 98.7% in controlled sce-
narios.
Previous research combines the idea of an AR as-
sembly assistance system with deep learning based
image classification on LEGO (Schoosleitner and Ull-
rich, 2021). They aim to correctly classify the cur-
rent construction step of a LEGO model based on 2D
images, by evaluating a machine learning approach,
where they trained the deep neural network Rotation-
Net. The visual data in this paper comes from a
LEGO Technic model called “Airport Rescue Vehi-
cle” (no. 42068). This model consists of 1094 parts
and has dimensions of over 42cm in height, 45cm in
length, and 15cm in width. This particular model has
a complexity that is sufficiently similar to the pro-
posed use case. A CAD representation was created by
PHILIPPE HURBAIN and published under the CCAL
VERSION 2.0 license at ldraw.org. Their research
has provided two-dimensional images from render-
ings of the CAD representation of the LEGO model
illustrating each construction step. In this paper, we
present a novel approach to the classification prob-
lem described above, building upon the renderings by
SCHOOSLEITNER and ULLRICH. In this research, we
extend their work by applying the latest state-of-the-
art deep-learning techniques to overcome some of the
shortcomings identified in their paper. First of all we
have increased the model’s input resolution (to pre-
serve more detail in the images) and the amount of
training data (by using more viewpoints).
3 PROPOSED METHOD
In this project, different sizes of EfficientNet (Tan
and Le, 2019) and EfficientNetV2 (Tan and Le,
2021) were used and evaluated as the backbone of
the image classifier. These architectures were cho-
sen because they provide state-of-the-art performance
while being time and memory efficient during train-
ing compared to other architectures. In particu-
lar, the EfficientNetV2 models are significantly faster
than other backbones (Srinivas et al., 2021), (Doso-
Deep Learning-Powered Assembly Step Classification for Intricate Machines
501
vitskiy et al., 2021). Furthermore, they achieve
similar or better classification accuracies on several
benchmark datasets such as ImageNet and CIFAR-
10 (Krizhevsky, 2009) with only a fraction of the
trainable parameters according to the originally re-
ported.
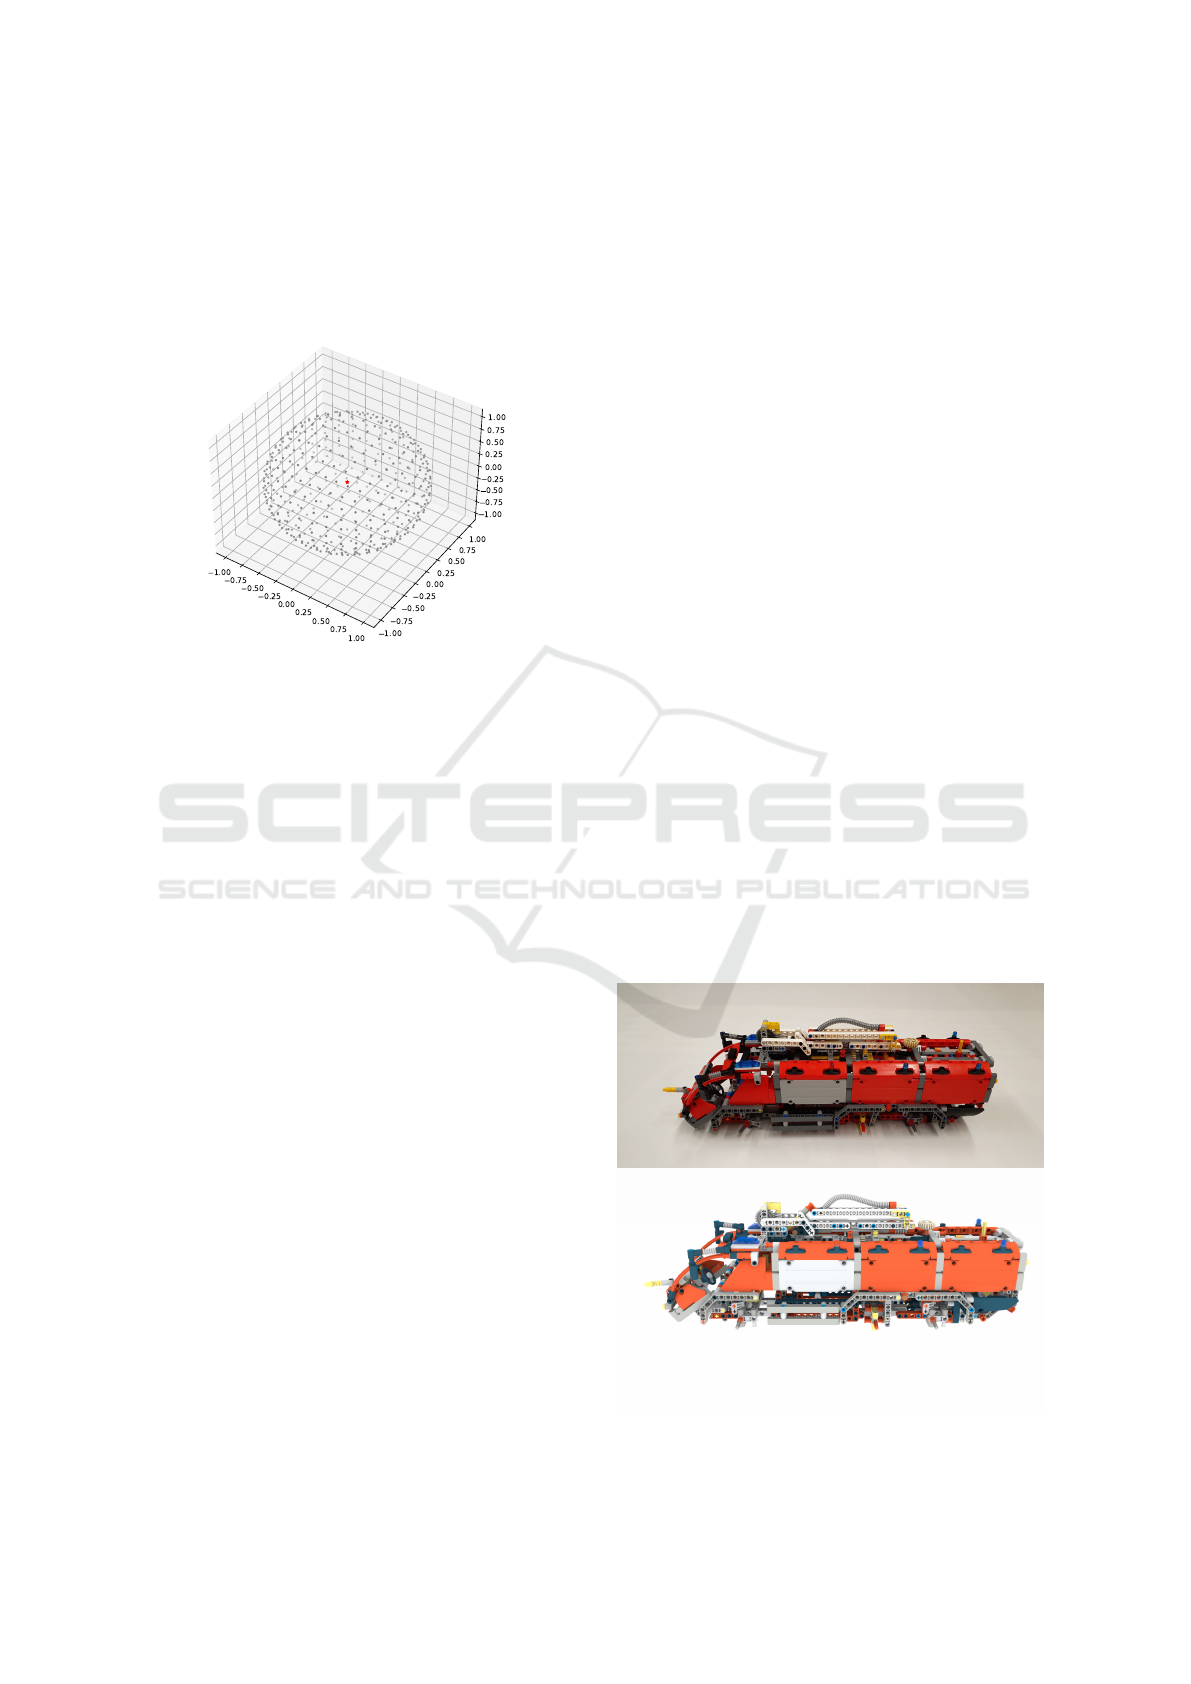
Figure 1: Distribution of camera angles on the sphere: each
of the 486 grey dots represents a camera position of a ren-
dered CAD image (Schinko et al., 2011).
As mentioned in the previous section, an existing
dataset of rendered images was used to train the clas-
sifier. These images are generated in a manner simi-
lar to a camera taking pictures from different angles
around a sphere with the rendered model in the center.
For each construction step, a total of 486 points on the
sphere are selected as camera positions for image ac-
quisition distributed by error minimization (Schinko
et al., 2011). This distribution ensures a maximum
angle difference of ten degrees between two camera
positions (see Figure 1).
While the CAD model consists of 137 construc-
tion steps, the last five steps (#132 to #137), actually
construct a toolbox that is then placed inside the vehi-
cle. This means that these steps are indistinguishable
from the outside of the main model and are excluded
from the set of target classes. Therefore, the train-
ing data consists of 486 images for each of the 132
construction steps with a resolution of 2048 × 2048.
The images use the RGB color space with a neutral,
mostly ambient lighting configuration (see Figure 2).
Prior to model training, the widely accepted proce-
dure of splitting the dataset into a training, validation,
and test set was implemented (Hastie et al., 2009).
We used an 80-10-10 train-val-test split, which means
that the model is trained on 80% of the images, while
after each epoch the model is cross-validated with the
validation dataset of 10% of the images. After train-
ing, the model is cross-validated a second time on im-
ages it has never seen before.
For the proposed use case, it is reasonable to as-
sume that the real images of the assembly process
will have the model at least approximately centered.
Therefore, the first step in the preprocessing pipeline
for the training data is to ensure that the model re-
ally learns to distinguish the steps and does not take
into account where the vehicle is in the image. The
model needs to learn a general understanding of the
vehicle’s position. To achieve this, the pipeline ex-
tracts from the original training image the smallest
possible rectangle of pixels that still contains the en-
tire image of the displayed step, called the bounding
box. This cutout is then pasted onto a new white
background with a random position around the cen-
ter, while also varying the size of the new image to
further increase the variability in the data. This pro-
cess creates an entirely new image and is performed
every time an image gets fed into the model during
training. The images are then resized to the fixed in-
put size of 1024 × 1024 or 512 × 512. These input
resolutions were chosen to minimize information loss
and preserve fine details between construction steps.
To combat overfitting, the data augmentation strategy
“AutoAugment” (Cubuk et al., 2019) implemented in
the “Pytorch” package gave the best results. The Ta-
bles 1 and 2 give an overview of all backbones and
hyperparameters used in the model training. Since
especially the models trained on the input resolution
of 1024 × 1024 allowed only small batch sizes due to
video memory constraints, and to reduce the hyperpa-
rameter search by one variable, the batch size was al-
ways set to the maximum that could fit into the avail-
able video memory. The Table 1 shows the maximum
batch sizes for each run. Since training the model
Figure 2: Comparison of real-world image and synthetic
training image of step #129; the upper image is a real-world
image taken with a smartphone on a white background. The
lower image is rendered using the Computer-Aided Design
model only.
VISAPP 2024 - 19th International Conference on Computer Vision Theory and Applications
502
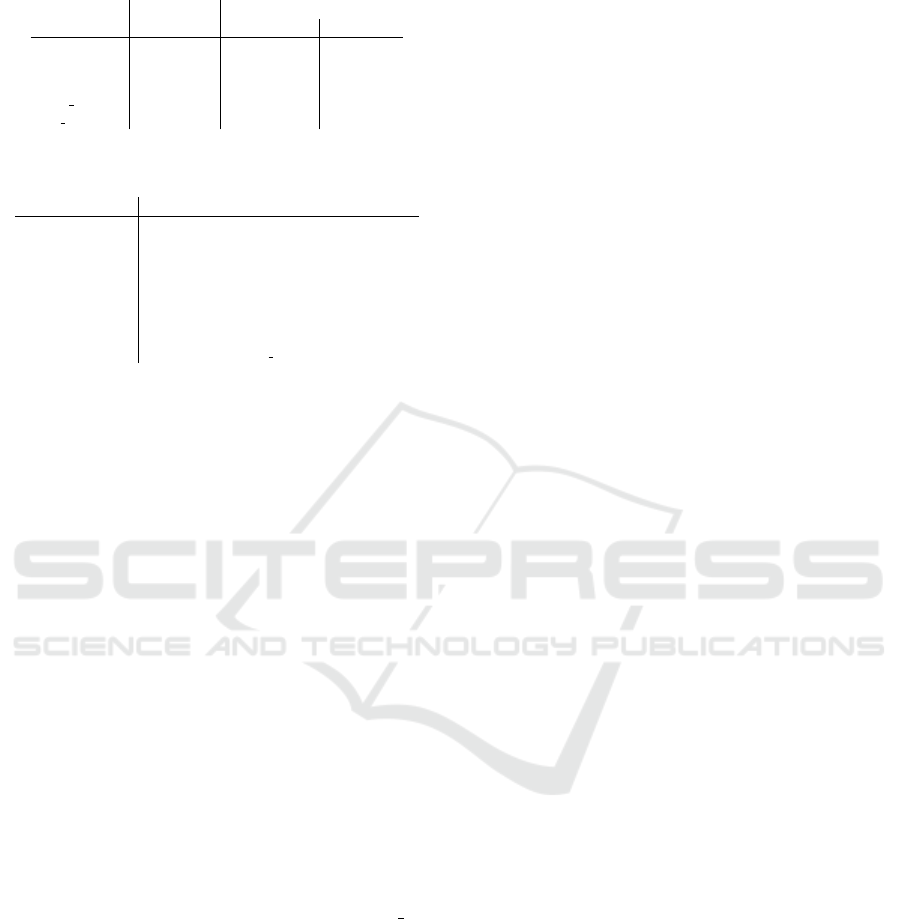
Table 1: Overview of the backbones used including the
model sizes regarding their number of parameters.
Model Num. of Max. Batchsize
Parameters 1024 × 1024 512 × 512
B0 4,176,640 24 96
B3 10,899,116 12 50
B5 28,611,252 6 -
V2 Small 20,380,372 12 56
V2 Medium 53,027,448 - 32
Table 2: Hyperparameters of the optimizer and the learning
rate scheduler.
Hyperparameter Value
Optimizer AdamW
Learning rate 0.001
LR scheduler ReduceLROnPlateau
Factor 0.5
Patience 5
Cooldown 3
Epochs 100 resp.
60 for EfficientNet B5 with 1024 × 1024
from scratch would not have been feasible with the
small dataset available, a transfer learning approach
was implemented using only pre-trained versions of
the above models. Thus, the training of these models
is initialized with the best performing weights learned
from the ImageNet-1K dataset. It also replaces the
last layer of the neural network and adjusts the num-
ber of target classes, which in our case is 132. Dur-
ing training, all layers were fine-tuned and none were
frozen. An initial learning rate of 0.001 was paired
with the common and simple learning rate decay strat-
egy “ReduceLROnPlateau” to avoid getting stuck in
local minima (Goodfellow et al., 2016).
This learning rate scheduler reduces the learning
rate by 50% if the validation loss function does not
improve over a given number of epochs, which was
set to five in this case. As an optimizer, the newer
variant of Adam called AdamW has been chosen, be-
cause of its superior generalization performance com-
pared to the vanilla version (Loshchilov and Hutter,
2019). The training was done on a dedicated train-
ing server (Intel Xeon 64-core CPU, 3.10GHz, 1TB
RAM, Nvidia A40 GPU with 45GB) and all models
were trained for 100 epochs, except EfficientNet B5
(1024 × 1024), which was only trained for 60 epochs
because this particular model started to overfit after
20 epochs.
4 EVALUATION
The quality of an AI model is defined by the practi-
cality of its application. Therefore, each of the models
mentioned in the previous section is evaluated and the
results of the classification performance after model
training are presented. The models are evaluated on
three different datasets:
The validation dataset: It consists of 10% of the
synthetic images from the CAD renderings. The mod-
els are cross-validated with this data set after each
training epoch.
The test dataset: It also consists of 10% of the
synthetic images from the CAD renderings. How-
ever, the models do not see these images during train-
ing. Instead, they are only used to validate the perfor-
mance of the models after training is complete. This
is a second measure of performance, since the models
cannot learn from these images.
The real-world dataset: Once the models have
been satisfactorily validated on the synthetic images,
the final test is performed on the images from the
real world. This dataset consists of 11 target classes
and a total of 522 images taken with a widely avail-
able smartphone on a white background. The target
step classes are step #12, #24, #25, #39, #51, #62,
#79 , #98 , #117, #129, and #131. They were cho-
sen to cover the beginning, middle, and end stages of
assembly while varying the step spacing. Each im-
age is taken from a slightly different angle to capture
the model from all sides. The collection of images is
roughly evenly distributed across this set of assembly
steps. As shown in Figure 2, the real world images
are much darker than the training images. Therefore,
the pre-processing pipeline increases the brightness
by 100% and the contrast by 25% of the real-world
images to close the visual gap to the synthetic images.
Since the dataset is adequately balanced along all
target classes, the following two metrics were chosen
for the model evaluation. The first one is the Top1-
accuracy, which is the success rate of correctly iden-
tifying each construction step. This metric is quite
strict for the application, because some differences
between construction steps are not visible from cer-
tain camera points, making a correct classification ac-
cording to Top1-accuracy a guess. Figure 3 show-
cases this problem. The second metric chosen is the
Top5-accuracy, which is more relaxed. A prediction
where the correct construction step is in the classifi-
cation set of the five highest step probabilities is still
considered a successful classification. In this partic-
ular use case, the Top5-accuracy is more meaningful
as small differences in steps cannot always be distin-
guished from different views.
We evaluate the performance of different versions
and sizes of the EfficientNet model family: A total of
eight training experiments were conducted with four
experiments for each resolution. The results of all ex-
periments are shown in Tables 3 and 4. First, on
our validation set, the best performing model achieves
Deep Learning-Powered Assembly Step Classification for Intricate Machines
503
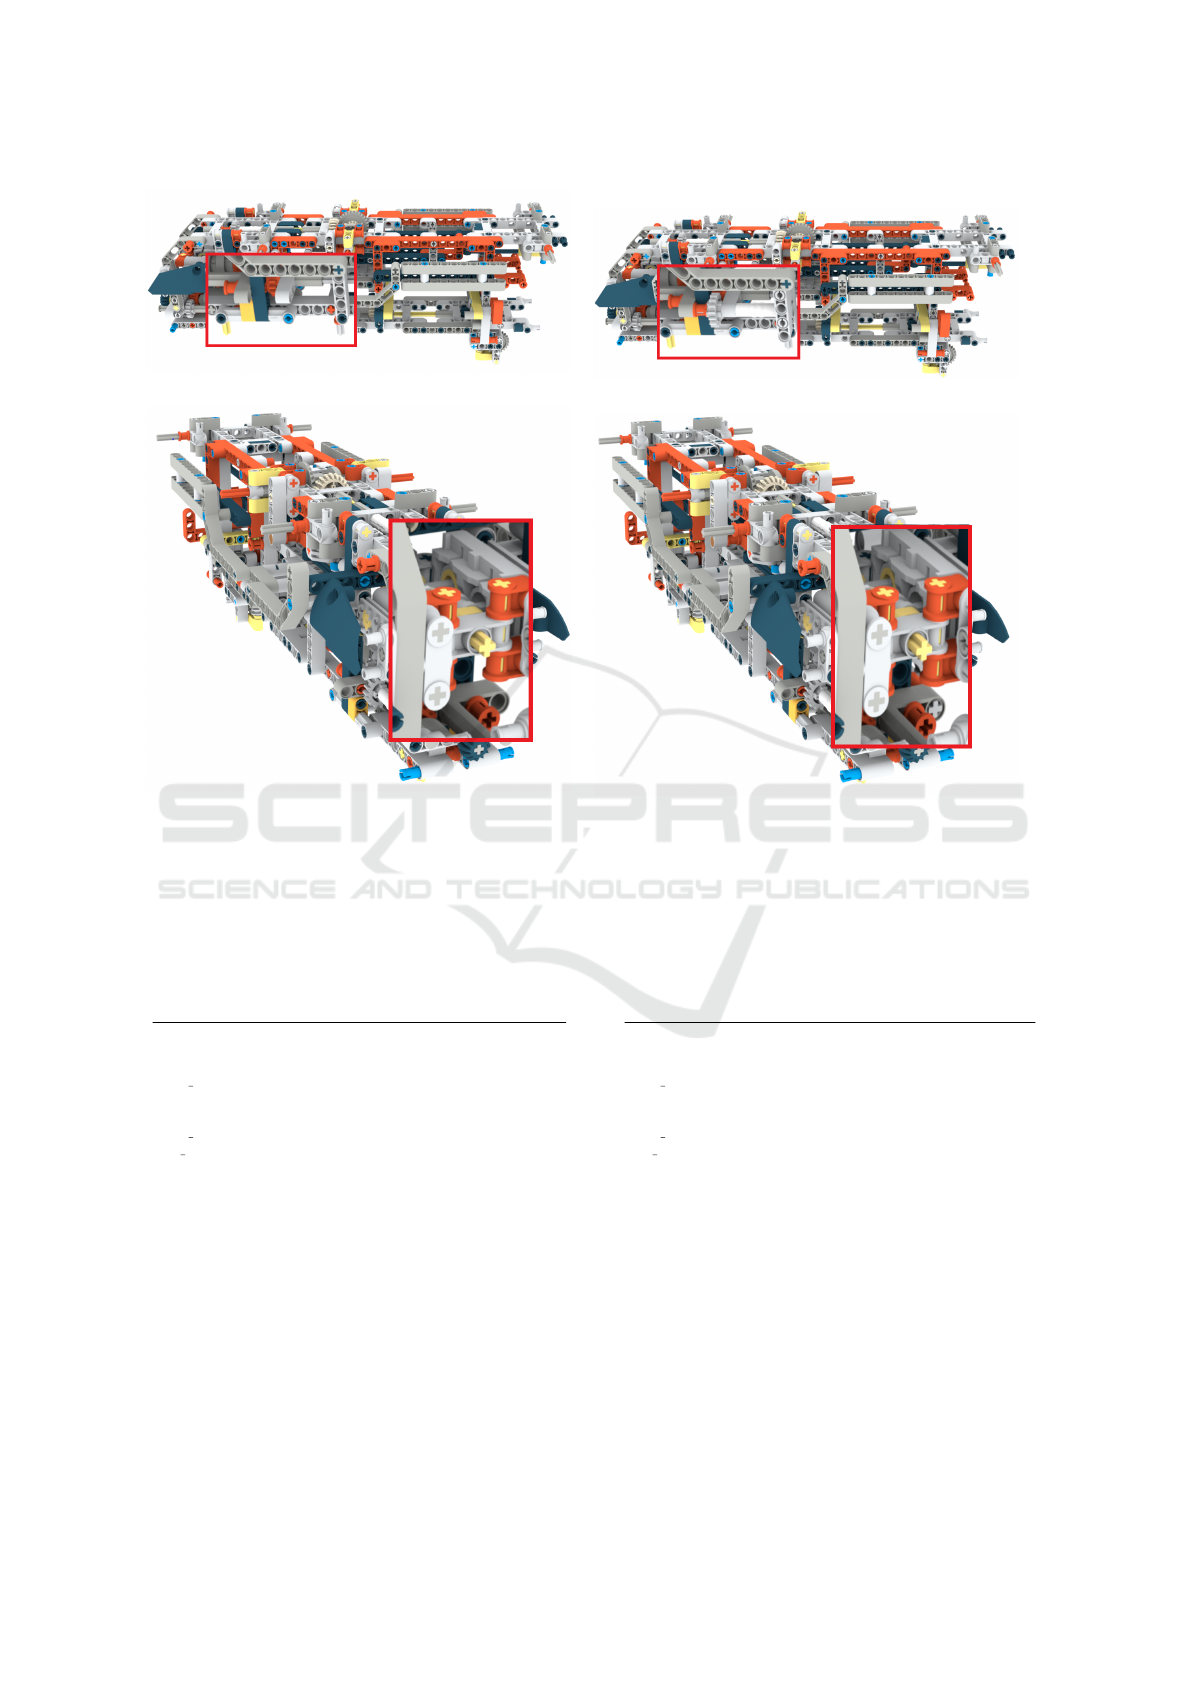
(a) Step #78 from Viewpoint #56
(b) Step #79 from Viewpoint #56
(c) Step #78 from Viewpoint #207
(d) Step #79 from Viewpoint #207
Figure 3: Comparison of step differences and visibilities from different viewpoints; while only a small part is added between
the steps, the difference can be easily seen from viewpoint #56. On the other hand, from viewpoint #207, the changes from
other parts are obscured, making it very difficult for humans and computers to classify.
Table 3: Top1-Accuracies of all experiments including the
results from the RotationNet by (Schoosleitner and Ullrich,
2021).
Top1 - Accuracy
Model Resolution Val. Set Test Set Real Images
B0 1024× 1024 81.53% 82.29% 36.9%
B3 83.49% 82.98% 51.82%
B5 82.07% 81.73% 38.43%
V2 Small 84.12% 83.83% 53.35%
B0 512 × 512 77.01% 77.72% 50.29%
B3 78.44% 78.43% 56.6%
V2 Small 79.59% 79.31% 56.41%
V2 Medium 80.59% 79.8% 57.74%
RotationNet 256 × 256 - 4.38% 0.73%
a Top1-accuracy of 84.12%.with a Top5-accuracy of
97.27%. Second, each of our models performs very
well on the synthetic image test dataset, achieving
similar Top1- and Top5-accuracies of around 80% and
over 95%, respectively. In comparison, the older Ro-
tationNet loses half of its Top1 and three quarters
of its Top5 accuracy with 4.38% and 7.3%, respec-
tively, when classifying unknown positions. Further-
more, all models significantly outperform the human
test subjects from the older study on the synthetic im-
ages (Schoosleitner and Ullrich, 2021).
Table 4: Top5-Accuracies of all experiments including the
results from the RotationNet by (Schoosleitner and Ullrich,
2021).
Top5 - Accuracy
Model Resolution Val. Set Test Set Real Images
B0 1024 × 1024 95.87% 96.41% 65.77%
B3 96.96% 97.16% 82.79%
B5 96.17% 96.63% 68.45%
V2 Small 97.27% 97.37% 79.54%
B0 512 × 512 95.01% 95% 79.73%
B3 95.06% 95.04% 83.17%
V2 Small 95.04% 95.12% 83.94%
V2 Medium 95.51% 95.51% 81.64%
RotationNet 256 × 256 - 7.30% 0.73%
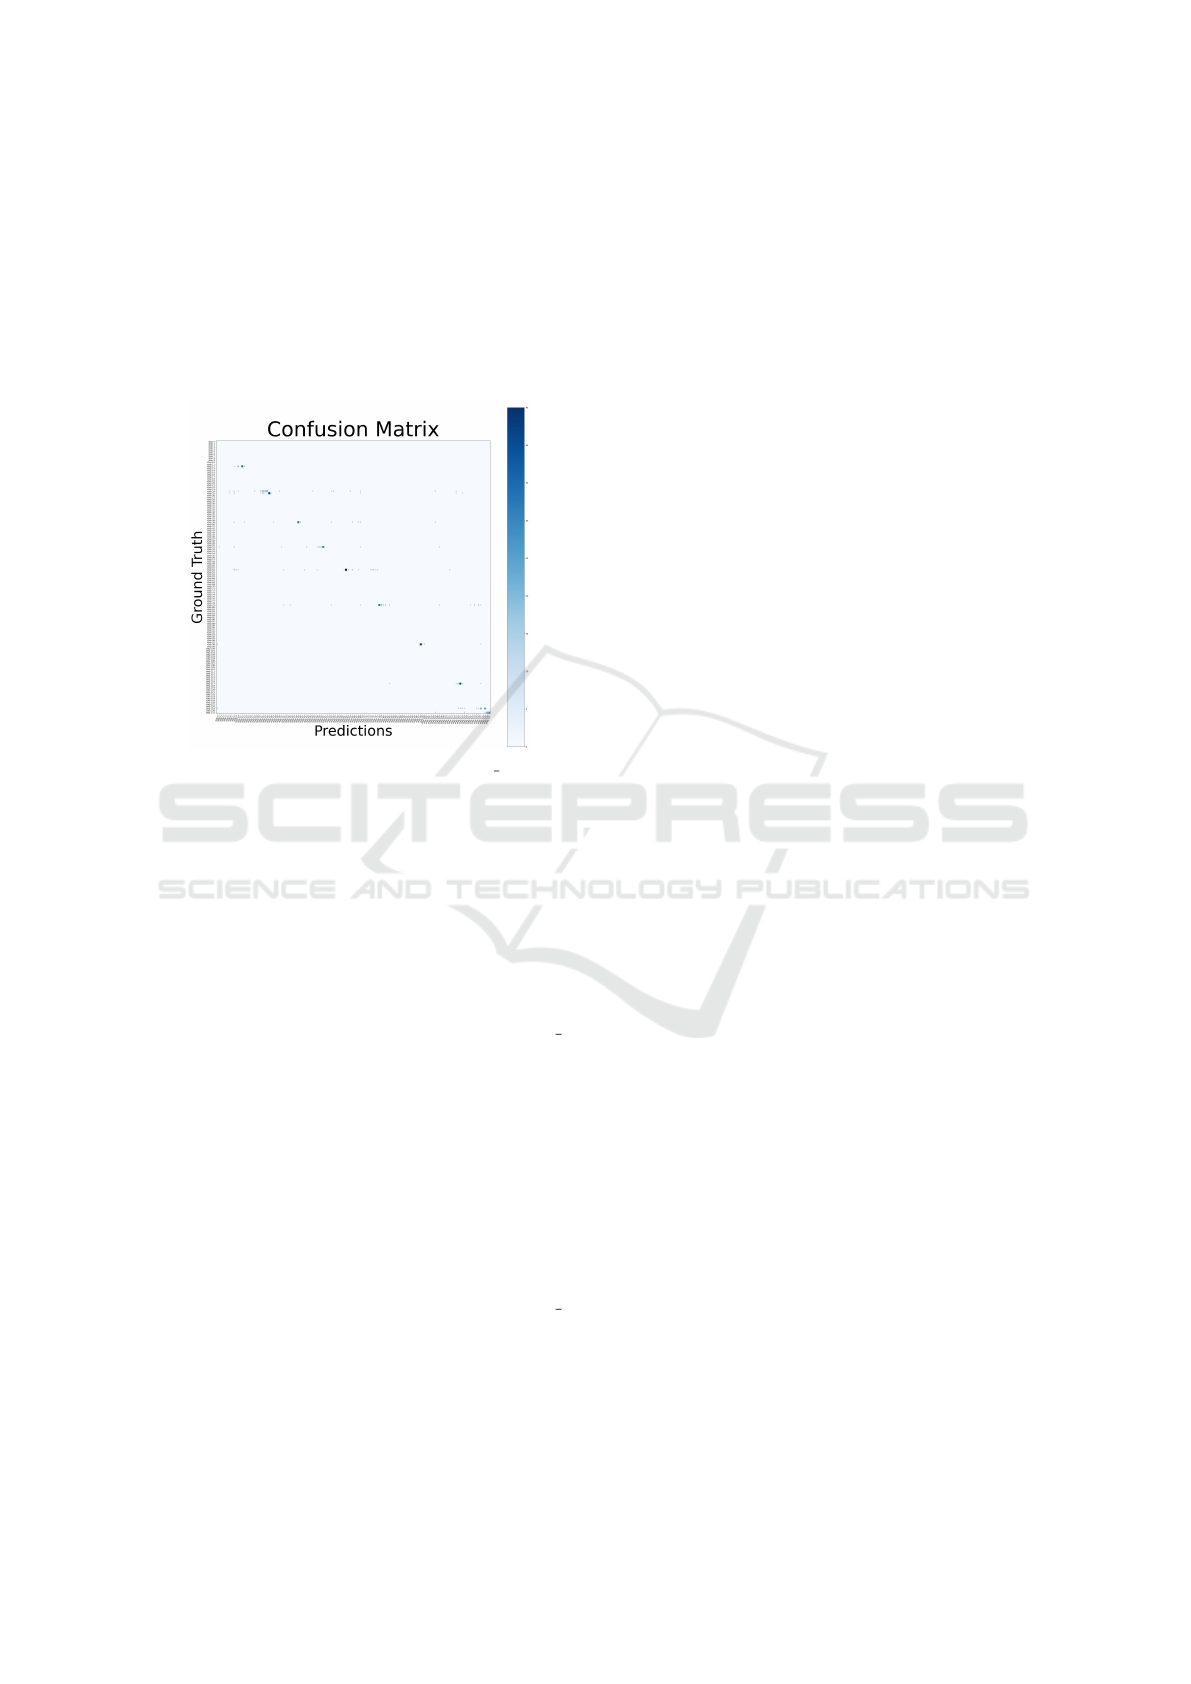
On the real-world test dataset, the highest Top1-
accuracy was achieved by the medium version of
EfficientNetV2 (512 × 512) with 57.74%. Figure 4
visualizes this performance with a nice diagonal of
dark cells with correct predictions in the confusion
matrix. The best Top5 accuracy was achieved by
the small version of EfficientNetV2 (512 × 512) with
83.94%. While the performance of all our models on
the synthetic images is relatively similar, the perfor-
mance differences on the real images become appar-
ent. We can see that all models trained on the higher
VISAPP 2024 - 19th International Conference on Computer Vision Theory and Applications
504
resolution perform worse. In particular, the model
with the fewest number of parameters, EfficientNet
B0, with about 4.2M, and the model with one of the
highest number of parameters, EfficientNet B5, un-
derperformed on the real images. While the models
lost some accuracy when transferred to the real-world
dataset, they still greatly outperformed the older al-
gorithm (Schoosleitner and Ullrich, 2021), which had
success rates below 1%.
Figure 4: Confusion matrix of EfficientNetV2 M (512 ×
512) on the real-world dataset; the confusion matrix shows
a nice diagonal of dark cells with correct predictions. Most
misclassifications occur around the early steps #24 and #25
and the last steps #129 and #131.
Further analysis of the classification performance
of the models revealed that all models had the most
misclassifications on the first and the last few assem-
bly steps when classifying the synthetic test set. In
particular, steps #2, #3, #4 have a high error rate
compared to the rest of the steps. Figure 5 visual-
izes this effect on the example of EfficientNetV2 S
(512 × 512). The graph shows the deviation of the
Top1 prediction mean from the target class ± the
standard deviation for all images in the test dataset.
In addition, it turned out that in some special cases,
the models predicted outliers in their Top1 predic-
tion with a large margin of error, and since the mean
and standard deviation are quite sensitive to outliers,
this distorts the graph. Therefore, we created a sec-
ond graph without these outliers by removing 5% of
the lowest and highest predictions. This results in a
better representation of the true performance: Fig-
ure 6 visualizes the error spread of EfficientNetV2 S
(512 × 512) on the real-world dataset with automati-
cally removed outliers. Compared to the performance
on the synthetic test dataset, the means are still quite
close to the ideal, but the error spreads are much
wider.
5 CONCLUSIONS
The contribution of this paper is a novel approach to
an existing classification problem (Schoosleitner and
Ullrich, 2021), which extends their idea of a deep
learning classifier as part of an AR assistance sys-
tem. Synthetic images of existing CAD renderings
of the LEGO Technic model were used to train sev-
eral state-of-the-art neural network architectures and
significantly improved the classification performance.
Compared to the older RotationNet, the results are
promising and indicate the real-world applicability of
such a deep learning classifier in the near future.
5.1 Discussion
Throughout the course of this study, several limita-
tions became apparent. One problem we faced was
the high input resolution required to preserve enough
detail in both the training and test images, as this leads
to an incredible amount of VRAM and time required
for model training.
Another challenge is the training data. On the one
hand, the use of CAD data ensures a sufficient amount
of training data; on the other hand, the CAD data is
“unrealistically clean”. The images of the rendered
CAD model are similar to the printed LEGO man-
ual, i.e. the rendering software has been set up to
have a rather ambient lighting configuration. As a re-
sult, we have unrealistic training data, and this is the
main reason why the models performed better on the
synthetic data than on the real images. Another sig-
nificant problem is the visibility of certain assembly
steps. Consecutive steps often look remarkably simi-
lar, making it difficult to distinguish their differences.
Depending on the point of view, newly added com-
ponents are sometimes completely hidden by others,
making correct classification difficult or even impos-
sible, as shown in Figure 3.
5.2 Future Work
Although the results of our algorithm are promising,
there is still potential for further improvement. As
mentioned above, one of the main limitations is the
unrealistic training data. Therefore, we are currently
working on generating new, more realistic training
images to better reflect the real use case. The ren-
derings of the CAD data will be generated under
plausible lighting conditions, which should result in
more realistic images with shadows and reflections.
This should help to close the performance gap be-
tween synthetic and real images. However, there is
a wide range of different lighting conditions in the
Deep Learning-Powered Assembly Step Classification for Intricate Machines
505

Figure 5: Classification performance of EfficientNetV2 S (512 ×512) on the test dataset; the graphs show the deviation of the
prediction mean from the target class (measured in the number of construction steps). The vertical lines indicate the standard
deviation of the Top1 predictions. The bottom graph has 5% outliers removed, which caused distortion, especially in some
steps in the middle. Generally, the model performs better in the middle of the assembly as the early and the late steps have a
wider error spread.
Figure 6: Classification performance of EfficientNetV2 S (512 × 512) on the real-world dataset; the plots show the deviation
of the prediction mean from the target class ± the standard deviation of the Top1 predictions for each construction step
(analogous to Figure 5). Again, the bottom graph has outliers removed. Compared to the synthetic test dataset, the means are
still quite close to the ideal, but the error spreads are much wider.
real world, including variations with the time of day
in outdoor use cases. Therefore, the choice of plau-
sible lighting for the training images is not as sim-
ple as it may seem, and the decision must be care-
fully evaluated. A common challenge for all classifi-
cation algorithms is the effect of the background on
the model’s recognition. Since it is not feasible to
train the model on all possible backgrounds, reducing
the background information can improve classifica-
tion performance in the real world. One possible ap-
proach to this problem would be to implement a seg-
mentation pipeline for the real-world images, where
the model is extracted from the background prior to
classification. The survey by MINAEE et al. (Minaee
et al., 2021) gives an overview of possible candidate
algorithms for such a pipeline. On the other hand,
performing image segmentation before image classi-
fication introduces a statistical error that propagates
into the classification process, as inaccurate bound-
aries and mislabeled regions can occur if segmenta-
tion is not performed accurately. Thus, such a pipeline
must be carefully evaluated in advance to be advanta-
geous.
VISAPP 2024 - 19th International Conference on Computer Vision Theory and Applications
506

REFERENCES
Azuma, R. (1993). Tracking requirements for augmented
reality. Communications of the ACM, 36(7):50–51.
Boi
´
nski, T., Zawora, K., and Szyma
´
nski, J. (2022). How
to Sort Them? A Network for LEGO Bricks Classi-
fication. International Conference on Computational
Science, 22:627–640.
Caudell, T. P. and Mizell, D. W. (1992). Augmented Real-
ity: An Application of Heads-U Display Technology
to Manual Manufacturing Processes. volume 2, pages
659–669.
Cubuk, E. D., Zoph, B., Mane, D., Vasudevan, V., and Le,
Q. V. (2019). Autoaugment: Learning Augmentation
Strategies from Data. IEEE Conference on Computer
Vision and Pattern Recognition, 32:113–123.
Deng, J., Dong, W., Socher, R., Li, L.-J., Li, K., and Fei-Fei,
L. (2009). ImageNet: A Large-Scale Hierarchical Im-
age Database. IEEE Conference on Computer Vision
and Pattern Recognition, 22:248–255.
Dosovitskiy, A., Beyer, L., Kolesnikov, A., Weissenborn,
D., Zhai, X., Unterthiner, T., Dehghani, M., Minderer,
M., Heigold, G., Gelly, S., Uszkoreit, J., and Houlsby,
N. (2021). An Image is Worth 16×16 Words: Trans-
formers for Image Recognition at Scale. International
Conference on Learning Representations, 2021, 9:1–
21.
Evans, G., Miller, J., Pena, M. I., MacAllister, A., and
Winer, E. (2017). Evaluating the Microsoft HoloLens
through an augmented reality assembly application.
SPIE Defense + Security, 10197(101970V):282–297.
Goodfellow, I., Bengio, Y., and Courville, A. (2016). Deep
Learning. MIT Press.
Hastie, T., Tibshirani, R., and Friedman, J. (2009). The Ele-
ments of Statistical Learning: Data Mining, Inference,
and Prediction, volume 2. Springer.
He, K., Zhang, X., Ren, S., and Sun, J. (2016). Deep
Residual Learning for Image Recognition. IEEE Con-
ference on Computer Vision and Pattern Recognition,
29:770–778.
Kress, B. C. and Cummings, W. J. (2017). Towards the Ul-
timate Mixed Reality Experience: HoloLens Display
Architecture Choices. SID symposium digest of tech-
nical papers, 48(1):127–131.
Krizhevsky, A. (2009). Learning Multiple Layers of Fea-
tures from Tiny Images.
Krizhevsky, A., Sutskever, I., and Hinton, G. E. (2012). Im-
agenet classification with deep convolutional neural
networks. Communications of the ACM, 60:84–90.
Loch, F., Quint, F., and Brishtel, I. (2016). Comparing
Video and Augmented Reality Assistance in Manual
Assembly. International Conference on Intelligent
Environments, 12:147–150.
Loshchilov, I. and Hutter, F. (2019). Decoupled Weight
Decay Regularization. International Conference on
Learning Representations, 7:1–8.
Minaee, S., Boykov, Y., Porikli, F., Plaza, A., Kehtarnavaz,
N., and Terzopoulos, D. (2021). Image Segmenta-
tion using Deep Learning: a Survey. IEEE Transac-
tions on Pattern Analysis and Machine Intelligence,
44(7):3523–3542.
Niu, S., Liu, Y., Wang, J., and Song, H. (2020). A Decade
Survey of Transfer Learning (2010–2020). IEEE
Transactions on Artificial Intelligence, 1(2):151–166.
Russakovsky, O., Deng, J., Su, H., Krause, J., Satheesh, S.,
Ma, S., Huang, Z., Karpathy, A., Khosla, A., Bern-
stein, M., et al. (2015). Imagenet Large Scale Vi-
sual Recognition Challenge. International Journal of
Computer Vision, 115:211–252.
Schinko, C., Ullrich, T., and Fellner, D. W. (2011). Simple
and efficient normal encoding with error bounds. The-
ory and Practice of Computer Graphics Conference,
29:63–65.
Schoosleitner, M. and Ullrich, T. (2021). Scene Under-
standing and 3D Imagination: A Comparison between
Machine Learning and Human Cognition. 16:231–
238.
Srinivas, A., Lin, T.-Y., Parmar, N., Shlens, J., Abbeel, P.,
and Vaswani, A. (2021). Bottleneck Transformers for
Visual Recognition. IEEE Conference on Computer
Vision and Pattern Recognition, 34:16519–16529.
Szegedy, C., Liu, W., Jia, Y., Sermanet, P., Reed, S.,
Anguelov, D., Erhan, D., Vanhoucke, V., and Rabi-
novich, A. (2015). Going Deeper with Convolutions.
IEEE Conference on Computer Vision and Pattern
Recognition, 28:1–9.
Tan, M. and Le, Q. (2019). EfficientNet: Rethinking Model
Scaling for Convolutional Neural Networks. Inter-
national Conference on Machine Learning, 36:6105–
6114.
Tan, M. and Le, Q. (2021). EfficientNetV2: Smaller Mod-
els and Faster Training. International Conference on
Machine Learning, 38:10096–10106.
Tang, A., Owen, C., Biocca, F., and Mou, W. (2003). Com-
parative Effectiveness of Augmented Reality in Object
Assembly. Proceedings of the SIGCHI Conference on
Human Factors in Computing Systems, 5:73–80.
Vidal, J., Vallicrosa, G., Marti, R., and Barnada, M. (2023).
Brickognize: Applying photo-realistic image synthe-
sis for lego bricks recognition with limited data. Sen-
sors, 23(4):1898ff.
Wiedenmaier, S., Oehme, O., Schmidt, L., and Luczak,
H. (2003). Augmented Reality (AR) for Assembly
Processes Design and Experimental Evaluation. In-
ternational Journal of Human-Computer Interaction,
16(3):497–514.
Deep Learning-Powered Assembly Step Classification for Intricate Machines
507
