
Mutually Exclusive Multi-Modal Approach for Parkinson’s Disease
Classification
Arunava Chaudhuri
∗
, Abhishek Singh Sambyal and Deepti R. Bathula
∗
Department of Computer Science and Engineering, Indian Institute of Technology Ropar, Rupnagar, 140001, Punjab, India
Keywords:
Parkinson’s Disease, Multi-Modal, Classification, Siamese Network, Deep Learning.
Abstract:
Parkinson’s Disease (PD) is a progressive neurodegenerative disorder that affects the central nervous system
and causes both motor and non-motor symptoms. While movement related symptoms are the most noticeable
early signs, others like loss of smell can occur quite early and are easy to miss. This suggests that multi-modal
assessment has significant potential in early diagnosis of PD. Multi-modal analysis allows for synergistic
fusion of complementary information for improved prediction accuracy. However, acquiring all modalities
for all subjects is not only expensive but also impractical in some cases. This work attempts to address the
missing modality problem where the data is mutually exclusive. Specifically, we propose to leverage two
distinct and unpaired datasets to improve the classification accuracy of PD. We propose a two-stage strategy that
combines individual modality classifiers to train a multi-modality classifier using siamese network with Triplet
Loss. Furthermore, we use a Max-Voting strategy applied to Mix-and-Match pairing of the unlabelled test
sample of one modality with both positive and negative samples from the other modality for test-time inference.
We conducted experiments using gait sensor data (PhysioNet) and clinical data (PPMI). Our experimental
results demonstrate the efficacy of the proposed approach compared to the state-of-the-art methods using single
modality analysis.
1 INTRODUCTION
Parkinson’s Disease, an incurable central nervous sys-
tem disorder, affects approximately 8.5 million indi-
viduals worldwide, gradually impairing motor activity.
Early symptoms encompass rigidity, tremors, slowed
movement, gait difficulties, and behavioral changes,
with intensification in later stages. The disorder’s eti-
ology remains elusive, prompting researchers to in-
vestigate commonalities among PD (Emamzadeh and
Surguchov, 2018; Makarious et al., 2022) patients. Ad-
vanced stages present with manifestations such as mus-
cle stiffness, olfactory loss, rapid eye movement, and
sleep disturbances, significantly impacting daily life.
Subtle early symptoms often go unnoticed, leading to
a progressive neurodegenerative condition. Challenges
in diagnosing the disease at its early stage arise from its
diverse manifestations, requiring extended observation
to discern symptoms.
Recent advancements in machine learning and
deep learning techniques show promise in assisting
the diagnosis of Parkinson’s disease. Researchers have
initiated investigations into the symptomatology of
∗
Corresponding Author
the disease. Initially, the focus centered on identi-
fying commonalities among patients. Subsequently,
it was observed that various factors impact the diag-
nostic process. Single-symptom experiments provide
accuracy for specific data types, disregarding potential
co-occurring symptoms. To address this, a proposed
framework for differential PD identification takes into
account multiple symptoms in characterizing individu-
als as either Parkinson’s Disease (PD) or Healthy Con-
trol (HC) subjects. However, achieving the required
high accuracy remains challenging in healthcare. Clin-
ical diagnosis relies on tests, patient responses, and
neuroimaging, contributing to detection errors. Early
detection poses an additional challenge, marked by
brain structural changes preceding subtle symptoms.
Notably, the impact of Parkinson’s Disease on the sub-
stantia nigra and basal ganglia is evident in brain im-
ages, reflecting dopaminergic effects preceding motor
symptoms. Timely identification facilitates interven-
tion with neuroprotective medication. Machine learn-
ing techniques (Archila J., 2022; Pahuja G., 2022),
increasingly popular over the past decade, aid in pat-
tern recognition within clinical data and images. In
this context, gait sensor data, along with motor and
236
Chaudhuri, A., Sambyal, A. and Bathula, D.
Mutually Exclusive Multi-Modal Approach for Parkinson’s Disease Classification.
DOI: 10.5220/0012376100003657
Paper published under CC license (CC BY-NC-ND 4.0)
In Proceedings of the 17th International Joint Conference on Biomedical Engineering Systems and Technologies (BIOSTEC 2024) - Volume 1, pages 236-243
ISBN: 978-989-758-688-0; ISSN: 2184-4305
Proceedings Copyright © 2024 by SCITEPRESS – Science and Technology Publications, Lda.

non-motor symptom data, is employed to classify PD
patients.
Given a comprehensive understanding of the afore-
mentioned challenges, we propose the development
of a multi-modal framework that utilizes various data
sources to improve disease classification. Our goal
is to integrate gait analysis data and clinical data to
enhance the accuracy of categorizing Parkinson’s dis-
ease. Furthermore, we have implemented a robust
cross-validation technique to address over-fitting com-
plexities within the machine learning model. Our con-
tributions can be summarized as follows:
•
We proposed a novel approach to jointly train two
mutually exclusive datasets within a multi-modal
framework. Additionally, we suggested an innova-
tive inference method utilizing embedding with a
triplet loss function.
•
We conducted a comprehensive evaluation of the
training and inference framework using a variety
of metrics and compared it with state-of-the-art
(SOTA) approaches.
•
Our approach demonstrated a significant reduction
in error rates and an improvement in accuracy for
the diagnostic process.
2 LITERATURE SURVEY
Research studies that are based on machine learning
techniques have been done until now a can be catego-
rized into three parts. Those are summarized in the
following:
1. Studies to Discriminate PD and HC Using Ma-
chine Learning Techniques – Combining diverse
data modalities, including images and clinical data,
while accommodating varying measurement scales,
has emerged as a promising avenue. (Prashanth et al.,
2016) advocate for a comprehensive analysis, integrat-
ing cerebrospinal fluid (CSF), non-motor attributes,
and images, enhancing preclinical PD diagnosis. Like-
wise, (Glaab E et al., 2019) establish the value of
merging blood sample data with PET images, enhanc-
ing the distinction between PD and healthy controls.
(H. Hirschauer et al., 2015) propose an innovative
methodology, utilizing neuro-pathological brain data
alongside motor and non-motor symptom data within
an enhanced probabilistic neural network. Impres-
sively, this approach surpasses classical machine learn-
ing algorithms, yielding significantly higher accuracy
than previous experiments. These endeavors collec-
tively underscore the potential of multi-modal data
fusion in advancing PD diagnosis and classification
accuracy.
2. Studies on Different Diagnoses of PD Using
Machine-Learning Techniques – Variability within
Parkinson’s disease (PD) necessitates distinct treat-
ment approaches, prompting recent investigations.
Leveraging Dopaminergic images, structural MRI,
functional MRI, and diffusion tensor images, machine
learning techniques like SVM and logistic regression
effectively differentiated PD categories. However, the
amalgamation of multi-modal features emerges as a
promising avenue for classification. This approach is
exemplified in recent studies, such as (Cherubini A
and et al., 2014), who integrated DTI and voxel-based
morphometry using support vector machines to distin-
guish PSP and PD patients. This experiment highlights
the potential of automated pattern recognition for PSP
and PD detection. Moreover, (Du G. and et al., 2017)
demonstrated the utility of apparent transverse relax-
ation rate and DTI images as critical markers for PD
differential identification. These findings collectively
underscore the viability of multi-modal data fusion in
enhancing PD variation differentiation.
3. Experiments on the Initial Phase Identification
of PD Using ML Techniques – Numerous inves-
tigations have converged on the integration of im-
age and clinical data to enhance initial PD diagnosis.
(Long D. and et al., 2012) notably harnessed structural
and resting-state functional magnetic resonance imag-
ing (rsfMRI) data, extracting diverse characteristics
encompassing ALFF, RFCs, ReHo, as well as cere-
brospinal fluid (CSF), gray matter (GM), and white
matter (WM). Employing a two-sample t-test in con-
junction with a Support Vector Machine (SVM), they
achieved an impressive 87% accuracy in early PD pa-
tient classification, surpassing the efficacy of single-
source image data. Another study by (Oliveira et al.,
2018) delved into SPECT imaging data, extracting
seven features from each brain hemisphere and leverag-
ing classical machine learning techniques. Strikingly,
by combining all features, they attained a remarkable
classification accuracy of 97%, outperforming previ-
ous studies that employed individual features. These
collective investigations underscore the potential of
multi-modal data integration in substantially enhanc-
ing early PD diagnosis and classification accuracy.
The preceding discussions reveal notable chal-
lenges. Clinical diagnosis data’s error susceptibility
warrants caution for PD patient classification. Conse-
quently, unsupervised techniques are proposed to un-
veil data patterns, while handling image data encoun-
ters feature extraction limitations. Machine learning’s
Mutually Exclusive Multi-Modal Approach for Parkinson’s Disease Classification
237

opaque nature conflicts with evidence-based medicine
principles, emphasizing the need to identify disease-
specific features. Over-fitting poses a significant con-
cern, with models excelling in training but struggling
in testing. Recent studies underscore the impact of ex-
cessive data heterogeneity on generalizability, even
with a single source. Addressing this entails aug-
menting data quantity and rigorous validation to en-
hance model generalization a comprehensive, aware
approach is pivotal for robust PD classification and
understanding.
3 DATASETS
The two mutually exclusive or unpaired datasets cho-
sen for this work are described below:
3.1 Gait in Parkinson’s Disease
This dataset by PhysioNet (Goldberger and et al., 2000)
includes multi-channel gait sensor data collected from
93 patients with PD (mean age: 66.3 years; 63% men),
and 73 healthy controls (mean age: 66.3 years; 55%
men). The dataset captures vertical ground force mea-
surements as subjects walk normally for approximately
2 minutes on flat terrain. Eight sensors beneath each
foot record force over time at a sampling frequency
of 100 Hz. Additionally, demographic information,
measure of disease severity and other related measures
are also included.
3.2 Parkinson’s Progression Markers
Initiative (PPMI)
This dataset has been captured by in-person clinical
assessments, covering people with a confirmed diag-
nosis of PD, people who exhibit PD risk factors but
have not yet been diagnosed with PD, and healthy con-
trols. This repository contains data from more than
1500 participants of which, 423 participants exhibit
PD and 196 are healthy individuals. The clinical data
collection spanned 12 visits including clinical motor
assessment at three-month intervals during first year,
transitioning to six-month intervals thereafter. Behav-
ioral and cognitive diagnoses are conducted annually
for all participants. 24-month visits for SWEDD par-
ticipants, and baseline recordings for healthy controls.
Blood sample collection followed a scheduled three-
month interval during the first year, then transitions
to six-month intervals. Fourth, Cerebrospinal fluid
(CSF) data are collected at 6-month and 12-month in-
tervals. And lastly, Urine testing was administered at
12-month intervals for all participants. As some of
this information is available only for a subset of the
participant population, we used data from initial visit
along with visits 2, 4, 6, 8, 10 and 12 for our analysis.
This generated a pool of 476 subjects with data in all
these visits.
4 METHODOLOGY
Given the constraints of mutually exclusive datasets,
our primary focus lies on expanding our sample size to
facilitate effective training of our proposed model. The
following section provides a detailed view of the tech-
niques employed for generating supplementary data
samples from our available dataset. This is followed
by an in-depth elucidation of our proposed framework.
4.1
Data Generation and Pre-Processing
This section is structured to enhance clarity by delin-
eating two pivotal steps which is also described in
Figure 1. We commence by streamlining gait sensor
data, simplifying its format for seamless integration
with PPMI data.
Data Separation Step – Initially, we apply seven
fundamental statistical techniques to each sensor data
column, including Minimum, Maximum, Mean, Me-
dian, Standard Deviation, Skewness, and Kurtosis.
Subsequently, we consolidate the complete time series
data for each subject into a unified row, resulting in
126 features (each attribute is transformed into seven
additional columns). In the case of the PPMI dataset,
we encompass data from seven visits, including the
baseline, capturing motor and non-motor symptoms,
thereby yielding a cumulative total of 1595 features.
As detailed in the dataset description, gait data com-
prises records from 93 PD patients and 73 HC patients,
while the PPMI dataset encompasses 294 PD patient
records and 154 HC patient records. Before amalga-
mation, data from both sources are stratified based on
class distribution.
Cross-Merging Step – The generation of the
merged dataset is accomplished through a cross-
merging operation involving corresponding class data
from both datasets. More precisely, it combines
the features of a single sample from the gait dataset
with the features of a corresponding sample from the
PPMI dataset, both belonging to the same class. For
model training, 50% of the merged data is used and
BIOIMAGING 2024 - 11th International Conference on Bioimaging
238
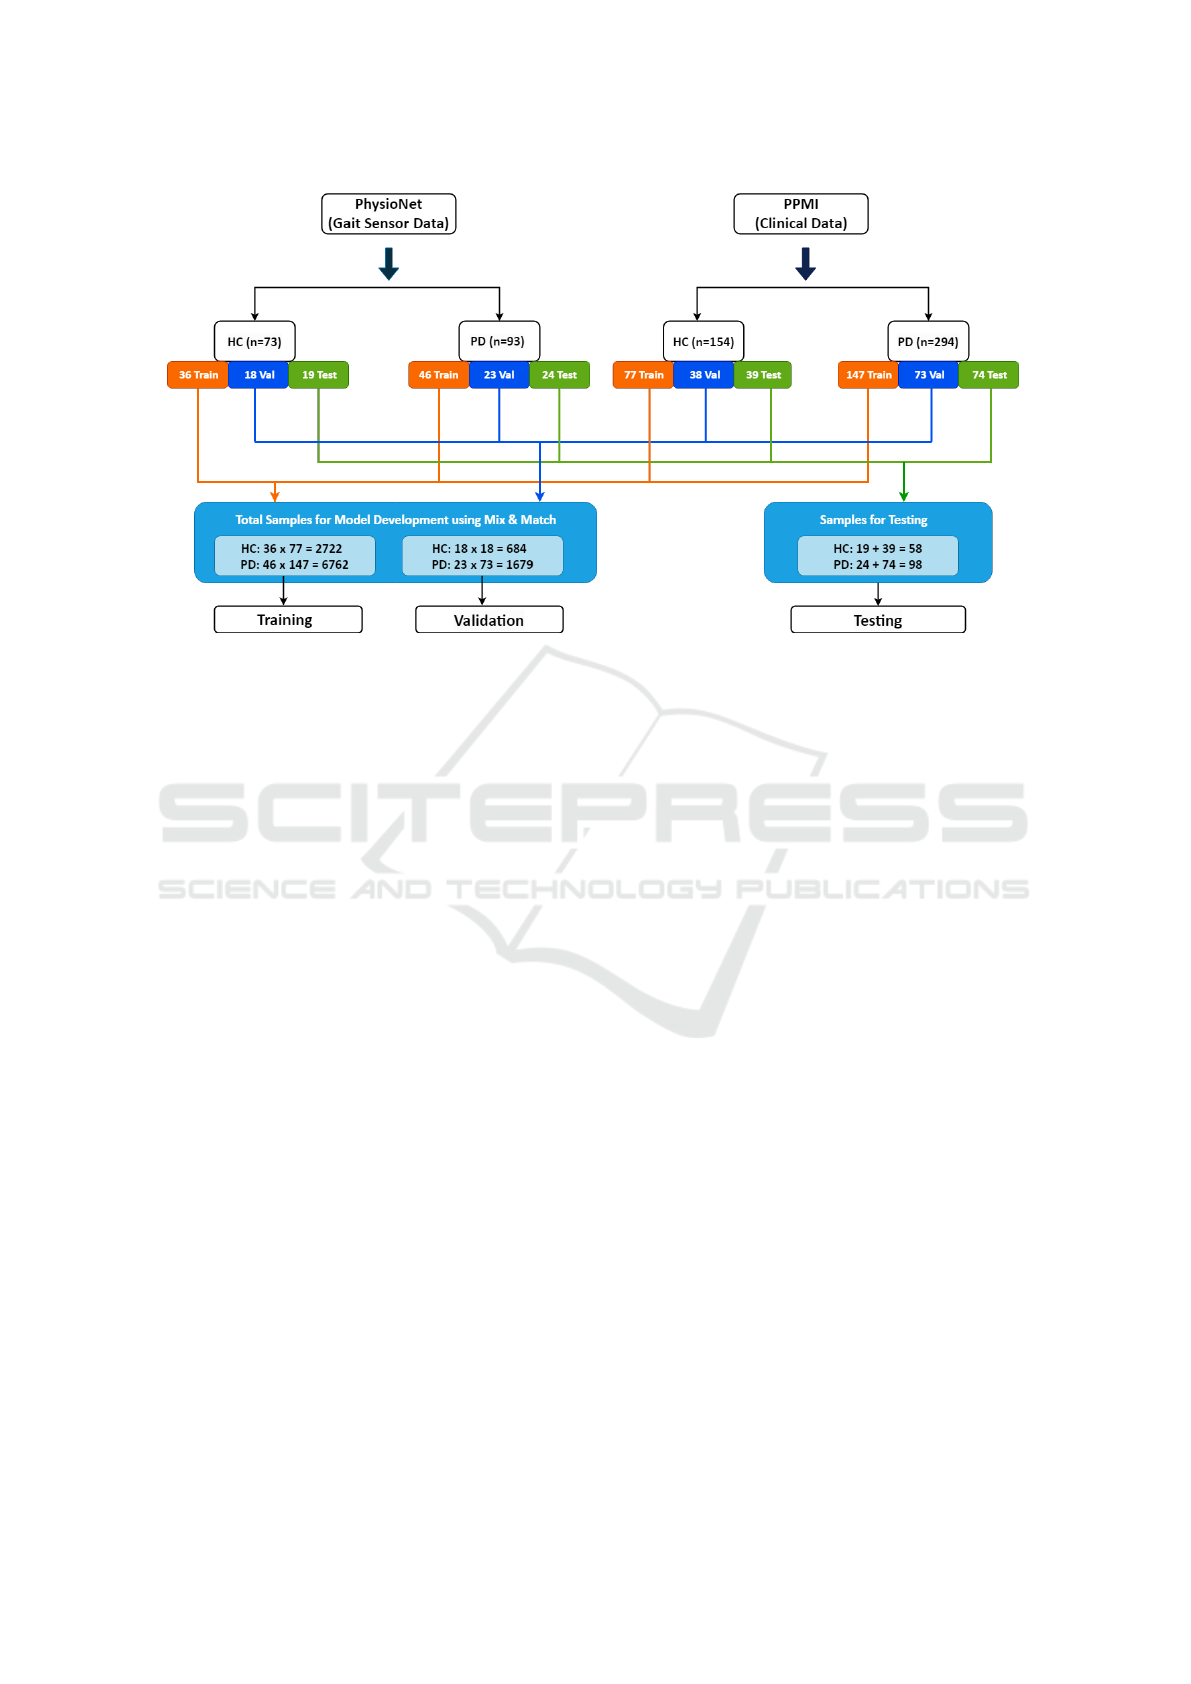
Figure 1: Data Generation Diagram. Each cohort is separated into two classes (mainly Parkinson’s Disease (PD) and Healthy
Control (HC)) and each class data of each cohort has been divided into 50%, 25% and 25% for the use of training, validation
and test. The orange line depicts the training data flow, whereas the blue and green data flows are for validation and test. The
first blue-colored block is responsible for generating data for model development whereas the second one is for generalization.
Same colored block data coming for training or validation are crossed between same class (Exp: Orange colored cohort 1 HC
data is crossed with orange colored cohort 2 HC date and same for PD data also.) This process has been repeated for blue
colored types of data.
the remaining 50% is equally assigned to validation
and testing. As a result of these post-splitting and
cross-merging operations, the dataset comprises 9484
records for training, 2363 for validation, and 2517 for
testing, encompassing a total of 1721 features.
4.2 Proposed Mutually-Exclusive,
Multi-Modal Framework
Multi-modal analysis helps improve the accuracy of
machine learning algorithms by leveraging the com-
plementarity of heterogeneous data. However, acquir-
ing all modalities for all samples might not only be
expensive but also practically infeasible in some con-
ditions. Consequently, we propose an unpaired multi-
modal learning strategy that learns to extract benefits
from mutually exclusive modalities. Our proposed
two-stage process along with training and inference
mechanisms are described below.
Individual Modality Networks. In stage one, we
used simple multi-layer perceptrons (MLPs) or fully
connected networks (four layers) for Parkinson’s dis-
ease prediction using individual modalities of gait
and clinical data. Each of the individual networks
were trained and optimized for best PD classification
accuracy with one modality using categorical cross-
entropy. Once trained, the weights of these networks
were frozen and the output or features extracted from
the penultimate layer is considered as the latent space
representation of corresponding modalities.
Multi-Modal Network. In stage two, the feature
vectors encompassing the distinct attributes of gait and
clinical data modalities are concatenated and used as
input to train a multi-modal network. While we use
similar architecture with four fully connected layers,
we utilize it in a siamese network with Triplet loss
function. As siamese networks are designed to com-
pare pairs of feature embeddings rather than make a
prediction, they are suitable for small datasets. Fur-
thermore, the Triplet loss function helps the model to
recognize the similarity or differences between classes.
Triplet Loss. The objective of the triplet loss func-
tion is to learn from the distributed representation of
data points in a high-dimensional vector space. It
ensures that similar data points are projected closer
together, while dissimilar ones are pushed farther apart.
The loss function is defined as:
L = max(d(a, p) − d(a, n) + margin, 0)
where ‘
a
’ represents the anchor sample, ‘
p
’ and ‘
n
’
denote the positive and negative samples respectively.
Mutually Exclusive Multi-Modal Approach for Parkinson’s Disease Classification
239
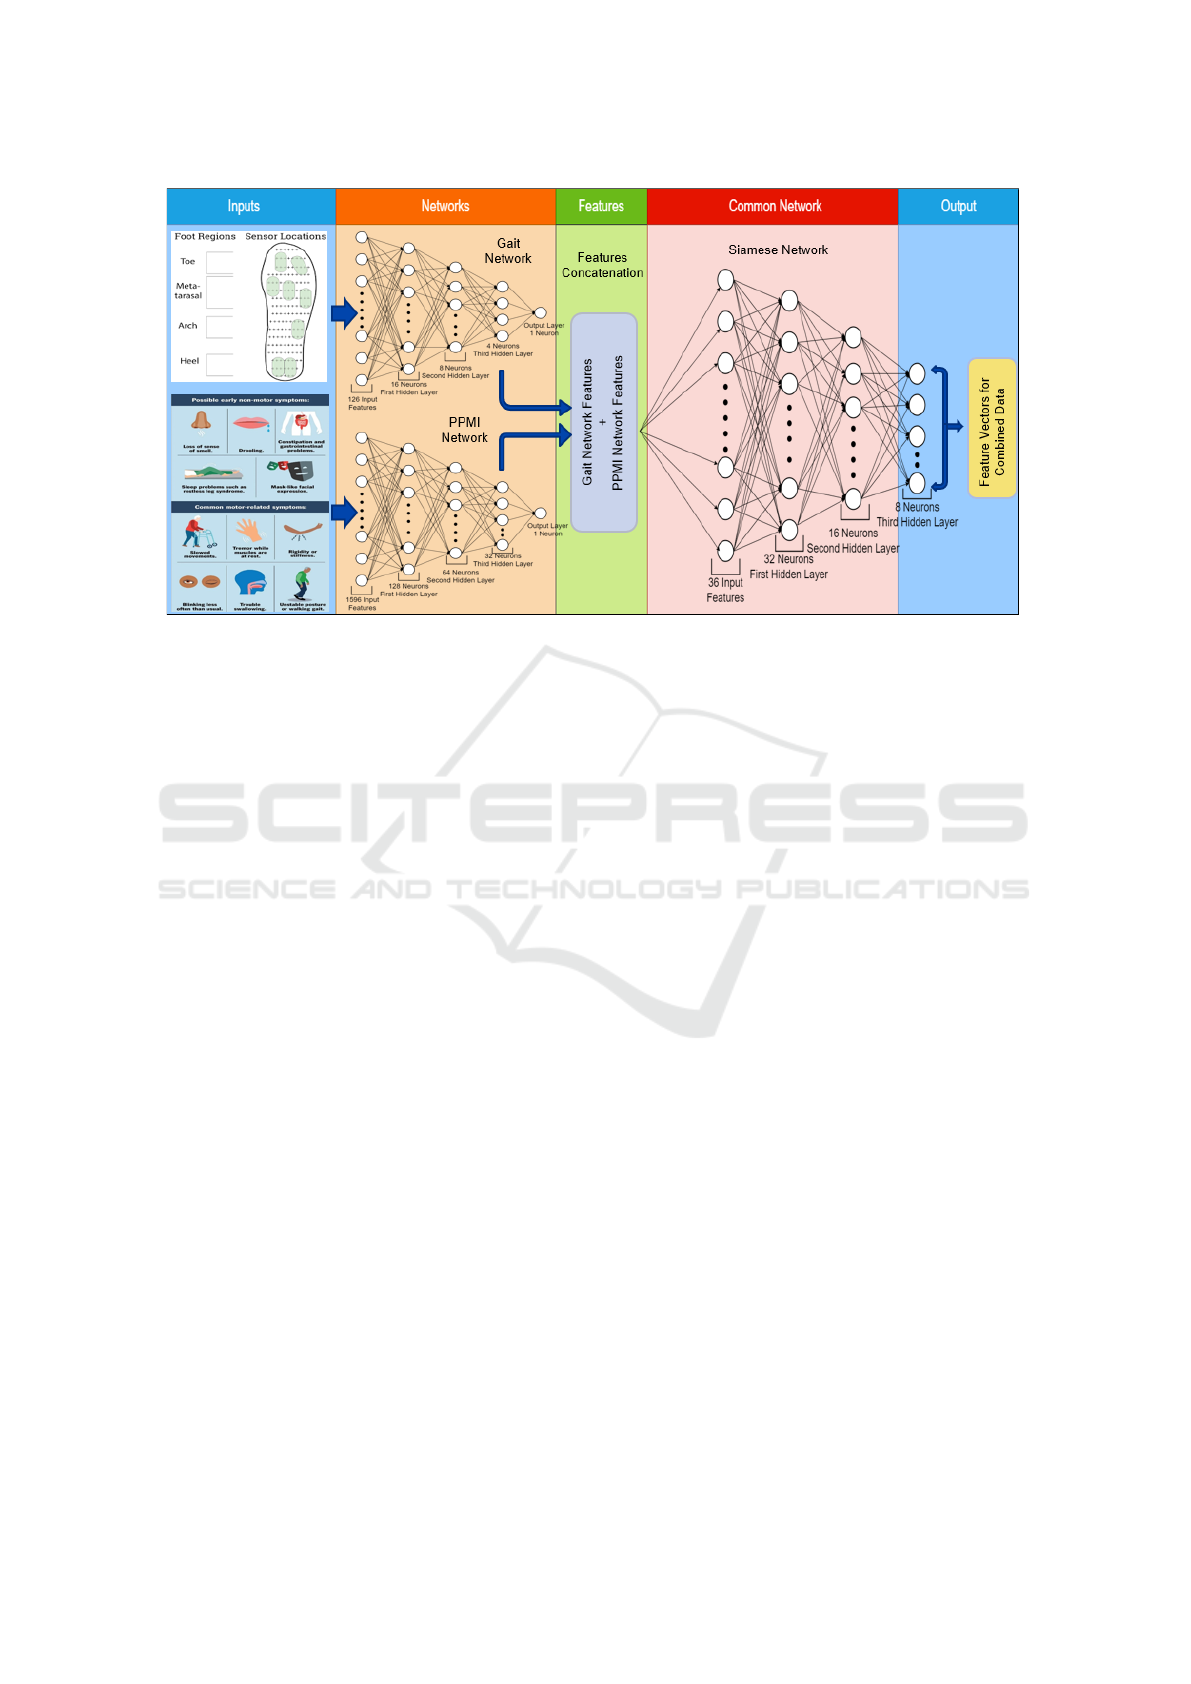
Figure 2: Siamese Network Architecture. Complete pipeline to generate embedding using combination of gait and PPMI data.
The input block is used for send the data to baseline models. Network section contains two previously used baseline networks
(Gait and PPMI Network) which will take gait and PPMI data individually and will generate feature matrices (Blue arrow in
between network and features section the diagram) corresponding to each data. In features section, these two feature matrices
are combined into single matrix. The common network section (Siamese Network) takes the combined feature matrix as input
and generates embedding output in the output section.
Notably, the similarity between "
a
" and "
p
" should
exceed that between "
a
" and "
n
." An additional hyper-
parameter termed "margin" is integrated into the loss
function. This parameter dictates the degree of dissim-
ilarity required, aiding in the efficient discrimination
of distinct samples.
Consequently, we compute gradients, which in turn
facilitate the adjustment of biases and weights within
the siamese network. Throughout the training phase,
we gather an anchor sample along with random posi-
tive and negative samples to compute loss and update
the network’s gradients.
Training Multi-Modality Network. As the two
datasets are mutually exclusive, there is no paired data
to train the multi-modal network. We address this
difficulty by pairing each sample of a particular class
in one dataset with every sample of the same class
in the other dataset. For instance,
s
1
samples of PD
in gait dataset and
s
2
samples of PD in PPMI dataset
generates a total of
s
1
× s
2
PD samples for training
the multi-modal network. This approach not only cap-
tures the variance in the modalities but also provides
implicit data augmentation. Such pairing is repeated
for samples of all classes and given the same label.
At each training step, triplets are composed by
first randomly selecting a sample to represent the an-
chor. Next, another sample from the same class is
randomly chosen as the positive sample and a sam-
ple from different class is randomly chosen to be the
negative sample. All the samples are first processed
using individual modality networks to extract modality
specific features. Features extracted for each sample
are concatenated to create input feature vectors to the
siamese network. The network operates by indepen-
dently processing the anchor, positive, and negative
losses, generating distinct embedding vectors for each
sample. Employing the triplet loss function, the model
computes the Euclidean distance between the anchor
and positive embedding, as well as between the an-
chor and negative embedding. These computations
facilitate the update of gradients within the siamese
network, thereby refining the network’s performance.
Proposed Inference Technique. Conventional in-
ference approaches are unsuitable due to the absence
of a modality. Therefore, we propose a novel method
for predicting the label of a test instance, employing a
combination of the max-voting approach and mix-and-
match pairing. During inference, we utilize triplets of
anchor, positive, negative.
Anchor: We first generate a test sample in the required
format for inference by combining a gait test sample
with five positive and five negative instances from the
PPMI training dataset. This process yields ten anchor
instances and removes the missing modality issue.
Positive and Negative: Each anchor instance is then
paired with one PD and one HC instance from the out-
BIOIMAGING 2024 - 11th International Conference on Bioimaging
240
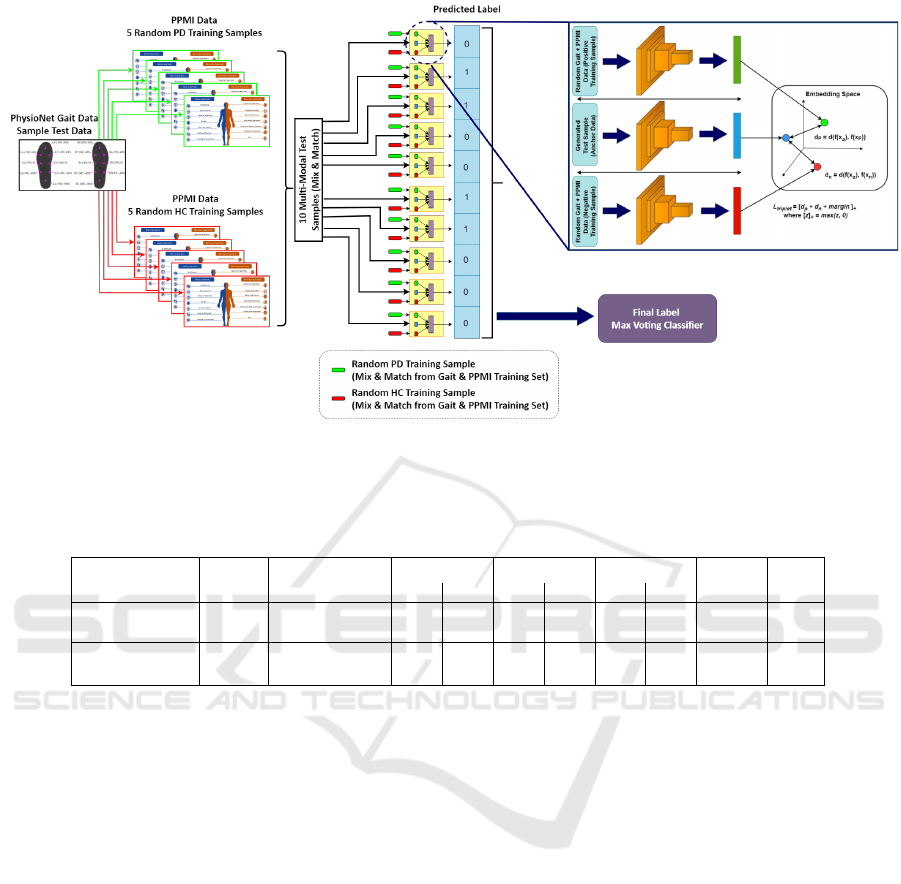
Figure 3: Model Inference Flow Diagram. The approach in the figure explains the classification of gait test sample. Gait test
sample is combined with 5 random positive (PD) and 5 random negative (HC) samples of PPMI data from training set. The
curated samples are then used as an input to proposed multi-model. The output will be aggregated using max voting technique
and compared with the actual class label to measure accuracy.
Table 1: Performance comparison of Single modal vs. Multi-modal approach (Higher is better).
Model
Dataset
Accuracy (%) HC PD HC PD HC PD Kappa AUC
Single-Modality
Gait 83.33 1.00 0.77 0.61 1.00 0.76 0.87 0.64 0.81
PPMI 92.03 0.81 1.00 1.00 0.88 0.90 0.94 0.83 0.94
Multi-Modality
Gait 99.20 1.00 0.98 0.97 1.00 0.97 0.98 0.98 0.97
PPMI 99.12 1.00 0.99 0.97 1.00 0.99 0.99 0.98 0.97
Precision Recall F1-Score
put of the cross-merging step, serving as positive and
negative samples, respectively. The generated triplet
is then inputted into the triplet loss, predicting one of
the two classes (PD/HC). Applying a max-voting strat-
egy allows us to determine the final prediction. Figure
3 illustrates the operation of the proposed inference
method.
5 RESULT
The multi-modality approach generally outperforms
single-modality for classification, but it hasn’t been
much explored for Parkinson’s disease tasks. In
single-modality, we individually trained the gait
network and PPMI network (Figure 2) using separate
datasets. Our proposed multi-modality framework
(Figure 2) combines features from both models,
gait and PPMI, along with the inference technique
described in Section 4.2. In our experiments, we
evaluated both single-modality and multi-modality on
the test set using various performance metrics such
as accuracy, precision, recall, F1-score, Kappa, and
AUC. Table 1 shows that the multi-modality approach
achieves
≈
13% higher average accuracy compared
to its single-modality counterpart, also significant
improvement in other metrics like precision and recall
affirms the correctness and reduction in false negatives
which is essential in healthcare domain, making it
preferable for classification tasks. Similar trends of
multi-modal superiority over single-modality are
observed in other performance metrics as well.
Comparison with SOTA Methods – To further an-
alyze the effectiveness of our proposed method, we
compared it with various methods in the literature us-
ing both the gait and PPMI datasets. Our goal is to
assess the method’s ability to classify data without
specific modalities. Table 2 and Table 3 describe the
comparisons for the PPMI and gait datasets, respec-
tively. In Table 2 for the PPMI dataset, our method
significantly outperforms established accuracy bench-
marks, as well as other performance measures such
as AUC, Kappa Score, sensitivity, and specificity. For
gait dataset in Table 3, recent studies have achieved
accuracy levels exceeding 99%, leaving limited room
Mutually Exclusive Multi-Modal Approach for Parkinson’s Disease Classification
241

Table 2: Performance comparison of the proposed approach with SOTA on PPMI dataset. (Higher is better).
Studies Model Accuracy (%) Sensitivity (%) Specificity (%) AUC Kappa
(Prashanth
et al., 2016)
Support Vector Machine (SVM)
[non-motor, CSF and imaging
markers]
96.40 97.03 95.01 0.98 NA
(Leger C,
2020)
Generalised Additive Model
(GAM) [Baseline Evaluation
with non-motor clinical and
biomarker features]
89.80 92.30 85 0.94 0.77
(MS Hema
and et al.,
2023)
Random Forest [Motor,
Non-Motor, Mental Health,
Semantic Features]
94.50 93.40 89.20 0.97 NA
Ours
Multi-Modal Siamese Network
(motor and non-motor)
99.12 ± 0.62 99 ± 0.007 97.43 ± 0.02 0.97 ± 0.01 0.98 ± 0.014
Table 3: Performance comparison of the proposed approach with SOTA on gait dataset. (Higher is better).
Studies Model Accuracy (%) Sensitivity (%) Specificity (%) F1 Score
(Zeng W and et al.,
2016)
Radial Basis Function (RBF)
Neural Networks
98.8 98.92 98.63 NR
(Acici K and et al.,
2017)
Random Forests 98 99.1 95.7 0.98
(Asuroglu T and
et al., 2018)
Locally Weighted Random
Forest (LWRF)
99 97.8 99.5 NR
(Zhao et al., 2018)
Long Short-Term Memory
(LSTM) and Convolutional
Neural Network (CNN)
98.61 NR NR NR
(Veeraragavan S and
SA., 2020)
Artificial Neural Network
(ANN)
97.7 97.05 97.41 0.97
(Xia Yand Yao Z and
N., 2020)
Long Short-Term Memory
(LSTM) and Convolutional
Neural Network (CNN)
99.07 99.1 99.01 NR
(Priya SJ and N.,
2020)
Logistic Regression 98.82 NR NR NR
(Ghaderyan and
Fathi, 2021)
Sparse NNLS coding
Method
97.22 98.22 95.86 NR
(Liu et al., 2021)
Long Short-Term Memory
(LSTM) and Convolutional
Neural Network (CNN)
99.22 98.04 100 0.99
(Tong J and S., 2021)
Support Vector Machine
(SVM)
99.23 NR NR NR
Ours
Multi-Modal Siamese
Network
99.20 ± 1.13 98.20 ± 0.01 99 ± 0.02 0.99 ± 0.01
for further improvement. Nonetheless, our method
demonstrates similar accuracy performance. When
comparing other metrics such as sensitivity, specificity,
and f1-score, we gain a deeper and more comprehen-
sive understanding of the model’s actual performance.
Our method also shows improvement across the ma-
jority of metrics when compared to other approaches
in the literature.
6 CONCLUSION
We proposed a novel technique that uses mutually
exclusive multi-modality training and inference ap-
proaches for classifying Parkinson’s disease (PD) in
scenarios with missing modalities. Our method in-
volves fusing features from a multi-modal network into
a combined feature vector, pairing reference modality
samples with positive and negative samples from other
modalities during inference, and using a voting scheme
for final classification. Comparing our multi-modal
approach to a single-modality approach, we observed
significant performance improvements. Our method
also outperformed existing approaches on both PPMI
and gait datasets. This research has broader implica-
tions for addressing other disease detection scenarios
with missing modalities, enhancing prediction preci-
sion, and reducing the need for exhaustive datasets.
BIOIMAGING 2024 - 11th International Conference on Bioimaging
242

REFERENCES
Acici K, O. g. H. and et al. (2017). A random forest method
to detect parkinson’s disease via gait analysis. In Engi-
neering Applications of Neural Networks.
Archila J., M. A. . M. F. (2022). A multimodal parkinson
quantification by fusing eye and gait motion patterns,
using covariance descriptors , from non-invasive com-
puter vision. In Computer Methods and Programs in
Biomedicine.
Asuroglu T, O. H. and et al. (2018). Parkinson’s disease
monitoring from gait analysis via foot-worn sensors.
In Biocybern Biomed Eng.
Cherubini A, M. M. and et al. (2014). Magnetic resonance
support vector machine discriminates between parkin-
son’s disease and progressive supranuclear palsy. In
International Parkinson and Movement Disorder Soci-
ety.
Du G., Lewis M., K. S. and et al. (2017). Combined diffu-
sion tensor imaging and apparent transverse relaxation
rate differentiate parkinson disease and atypical parkin-
sonism. In In American Journal of Neuroradiology.
Emamzadeh, F. N. and Surguchov, A. (2018). Parkinson’s
disease: Biomarkers, treatment, and risk factors. In
Frontiers in Neuroscience.
Ghaderyan, P. and Fathi, G. (2021). Inter-limb time-varying
singular value: A new gait feature for parkinson’s dis-
ease detection and stage classification. Measurement,
177:109249.
Glaab E, Trezzi JP, D. N., C., E., and et al. (2019). Inte-
grative analysis of blood metabolomics and pet brain
neuroimaging data for parkinson’s disease. In Neuro-
biology of Disease.
Goldberger, A., S. H. E. and et al. (2000). Physiobank,
physiotoolkit, and physionet: Components of a new
research resource for complex physiologic signals. In
In Proc. CVPR.
H. Hirschauer, T. J., Adeli, B., and A., J. (2015). Computer-
aided diagnosis of parkinson’s disease using enhanced
probabilistic neural network. In In Journal of Medical
Systems.
Leger C, Herbert M, D. J. (2020). Non-motor clinical and
biomarker predictors enable high cross-validated accu-
racy detection of early pd but lesser cross-validated ac-
curacy detection of scans without evidence of dopamin-
ergic deficit. In Frontiers in Neurology.
Liu, X., Li, W., Liu, Z., Du, F., and Zou, Q. (2021). A
dual-branch model for diagnosis of parkinson’s disease
based on the independent and joint features of the left
and right gait. Applied Intelligence, 51(10):7221–7232.
Long D., W. J. and et al. (2012). Automatic classification of
early parkinson’s disease with multi-modal mr imaging.
In In PLOS ONE.
Makarious, M. B., Leonard, H. L., Vitale, D., and et al.
(2022). Multi-modality machine learning predicting
parkinson’s disease. npj Parkinson’s Disease, 8(1):35.
MS Hema, M Nageswara Guptha, V. P. and et al. (2023).
Prediction analysis for parkinson disease using mul-
tiple feature selection and classification methods. In
Multimedia Tools and Applications.
Oliveira, F. P. M., Faria, and et al. (2018). Extraction, se-
lection and comparison of features for an effective
automated computer-aided diagnosis of parkinson’s
disease based on [123i]fp-cit spect images. European
Journal of Nuclear Medicine and Molecular Imaging,
45(6):1052–1062.
Pahuja G., P. B. (2022). Deep learning architectures for
parkinson’s disease detection by using multi-modal
features. In Computers in Biology and Medicine.
Prashanth, R., Dutta Roy, S., Mandal, P. K., and Ghosh,
S. (2016). High-accuracy detection of early parkin-
son’s disease through multimodal features and machine
learning. International Journal of Medical Informatics,
90:13–21.
Priya SJ, R. A. and N., U. (2020). Improving the prediction
accuracy of parkinson’s disease based on pattern tech-
niques. In 5th International Conference on Devices,
Circuits and Systems.
Tong J, Zhang J, D. E. and S., D. (2021). Severity classi-
fication of parkinson’s disease based on permutation-
variable importance and persistent entropy. In Multi-
media Tools and Applications.
Veeraragavan S, Gopalai AA, G. D. and SA., A. (2020).
Parkinson’s disease diagnosis and severity assessment
using ground reaction forces and neural networks. In
Front Physiol.
Xia Yand Yao Z, Y. Q. and N., C. (2020). A dual-modal
attention-enhanced deep learning network for quantifi-
cation of parkinson’s disease characteristics. In IEEE
Trans Neural Syst Rehabil Eng.
Zeng W, Liu F, Z. Y. and et al. (2016). Parkinson’s dis-
ease classification using gait analysis via deterministic
learning. In Neurosci Lett.
Zhao, A., Qi, L., Li, J., Dong, J., and Yu, H. (2018). A hybrid
spatio-temporal model for detection and severity rating
of parkinson’s disease from gait data. Neurocomputing,
315:1–8.
Mutually Exclusive Multi-Modal Approach for Parkinson’s Disease Classification
243
