
Learning on Forecasting HIV Epidemic Based on Individuals’ Contact
Networks
Chaoyue Sun
1 a
, Yiyang Liu
2 b
, Christina Parisi
2 c
, Rebecca Fisk-Hoffman
2 d
, Marco Salemi
3,7 e
,
Ruogu Fang
1,4,5,7 f
, Brandi Danforth
6
, Mattia Prosperi
2,7 g
and Simone Marini
2,7,∗ h
1
Department of Electrical and Computer Engineering, Herbert Wertheim College of Engineering, University of Florida,
Gainesville, FL, U.S.A.
2
Department of Epidemiology, College of Public Health and Health Professions and College of Medicine,
University of Florida, Gainesville, FL, U.S.A.
3
Department of Pathology, Immunology and Laboratory Medicine, College of Medicine, University of Florida, Gainesville,
FL, U.S.A.
4
J. Crayton Pruitt Family Department of Biomedical Engineering, Herbert Wertheim College of Engineering,
University of Florida, Gainesville, FL, U.S.A.
5
Center for Cognitive Aging and Memory, McKnight Brain Institute, University of Florida, Gainesville, FL, U.S.A.
6
Florida Department of Health, 4025 Esplanade Way, Tallahassee, FL, U.S.A.
7
Emerging Pathogens Institute, University of Florida, Gainesville, FL, U.S.A.
fi fl fl fl
Brandi.Danforth@flhealth.gov, {m.prosperi, simone.marini}@ufl.edu
Keywords:
Epidemiology, Contact Networks, Machine Learning, Graph Learning.
Abstract:
Improving the diagnosis of HIV is a fundamental objective of the Ending the HIV Epidemic initiative, as it
represents the initial step toward treatment and achieving undetectable status, thereby reducing transmission.
To attain these objectives effectively, it is crucial to identify the groups most susceptible to HIV, allowing
interventions to be tailored to their specific needs. In this study, we developed a predictive model designed
to assess individual HIV risk within a high-risk contact network – predicting treatment or at-risk – leverag-
ing surveillance data collected through routine HIV case interviews in Florida. Unique to our analysis, we
explored the incorporation of behavioral network information with Graph Neural Networks to enhance the
predictive capacity for identifying individuals within the treatment or intervention categories, when compared
to models that mainly consider conventional HIV risk factors. Our deployed Graph Isomorphism Network
achieved 77.3% and 73.2% balanced accuracy in inductive and transductive learning scenarios respectively,
outperforming the traditional prediction algorithms that do not leverage the network structure. We then used
our model to further investigate the importance of demographic and behavioral factors in the HIV risk pre-
diction process. Our findings provide valuable insights for healthcare practitioners and policymakers in their
efforts to combat HIV infection.
1 INTRODUCTION
Improving diagnosis of HIV is a key pillar of the End-
ing the HIV Epidemic (EHE) initiative, as knowing
a
https://orcid.org/0000-0003-0913-5668
b
https://orcid.org/0000-0002-5519-3853
c
https://orcid.org/0000-0002-2546-507X
d
https://orcid.org/0000-0002-2421-2601
e
https://orcid.org/0000-0003-0136-2102
f
https://orcid.org/0000-0003-3980-3532
g
https://orcid.org/0000-0002-9021-5595
h
https://orcid.org/0000-0002-5704-3533
∗
Corresponding author
the HIV status of someone is the first step in get-
ting them treated and for their HIV infection to be-
come undetectable (i.e., a viral load of less than 200
copies of HIV per milliliter of blood), which in turn
decreases transmission (Fauci et al., 2019). How-
ever, the resources do not exist to universally scale
up testing in healthcare facilities and beyond; fur-
thermore, current testing guidelines are often not fol-
lowed. Having a greater understanding of who is re-
cently acquiring HIV, where they are, and how they
are acquiring HIV, is key to the implementation of
effective and contextually- and culturally-appropriate
testing and interventions. Another EHE pillar is to
Sun, C., Liu, Y., Parisi, C., Fisk-Hoffman, R., Salemi, M., Fang, R., Danforth, B., Prosperi, M. and Marini, S.
Learning on Forecasting HIV Epidemic Based on Individuals’ Contact Networks.
DOI: 10.5220/0012375400003657
In Proceedings of the 17th International Joint Conference on Biomedical Engineering Systems and Technologies (BIOSTEC 2024) - Volume 2, pages 103-111
ISBN: 978-989-758-688-0; ISSN: 2184-4305
Copyright © 2024 by Paper published under CC license (CC BY-NC-ND 4.0)
103

provide rapid response resources to real-time out-
breaks, including deployment of prevention and treat-
ment tools to those in need. In order to identify and
promptly respond to potential outbreaks, cutting-edge
precision public health approaches are needed. These
approaches enable us to not only identify emerging
transition networks and high-risk communities but
also strategies to coordinate a rapid and targeted re-
sponse. Stakeholders, (e.g., public health and reg-
ulatory agencies, the scientific community, health
care professionals) can enact culturally- appropriate,
evidence-based best practices, including encouraging
pre-exposure prophylaxis (PrEP) uptake, creating sy-
ringe exchange programs, or developing new inter-
ventions. To achieve these goals, it is important to
understand the groups most impacted by HIV so in-
terventions can be tailored to meet their needs.
Florida is a diverse state that is also one of the
states most affected by HIV in the United States. It
consistently has among the highest rates of HIV inci-
dence in the nation (Centers for Disease Control and
Prevention, 2023). In 2019, seven counties in Florida
were selected as geographic priority areas in the EHE
initiative: Miami-Dade, Broward, Palm Beach, Or-
ange, Duval, Pinellas, and Hillsborough (Fauci et al.,
2019; Florida Department of Health, 2020). While
many of these high incidence and high prevalence
counties are urban, rural areas in Florida also are
heavily impacted by HIV (Florida Department of
Health, 2023; Trepka et al., 2013). Florida expe-
riences varying levels of socioeconomic status and
is impacted by tourism, seasonal residents, and mi-
gration. A variety of structural and social barriers
can prevent people with HIV (PWH) from receiv-
ing HIV care or receiving testing in urban compared
with rural areas. Additionally, stigma and discrimi-
nation surrounding HIV as well as racial/ethnic, gen-
der, and sexual identities can vary by location, within
groups, and across cultures, and be substantial barri-
ers to knowledge about HIV, engagement in HIV pre-
vention behaviors, and receipt of HIV healthcare (Tan
et al., 2023). Similar to the rest of the nation, non-
Hispanic Black and Hispanic men who have sex with
men (MSM) and non-Hispanic Black women are dis-
proportionately impacted by HIV in Florida (Florida
Department of Health, 2017; Lieb et al., 2010; Wright
et al., 2022; Liu et al., 2023). Given these circum-
stances, not only is our research well-suited to be
done using Florida data, but our work has the poten-
tial to help inform and streamline public health efforts
given the diversity of PWH living in the state.
Deep learning methods, particularly Graph Neu-
ral Networks (GNNs), have garnered significant re-
search attention in epidemiology in recent years.
GNNs are specifically designed for tasks that incor-
porate graph topology as an additional input, allow-
ing them to learn representations by exchanging in-
formation among neighboring nodes (Zhang et al.,
2018; Zhou et al., 2020; Wu et al., 2020). The appli-
cation of GNNs in epidemiological prediction tasks
has gained momentum due to the inherent connec-
tions between geolocation and temporal dynamics.
Notably, GNNs have demonstrated their effectiveness
in capturing patterns for a range of epidemiological
predictions, including the prediction of influenza-like
illness (Deng et al., 2020) and forecasting COVID-
19 cases (Kapoor et al., 2020; Ramchandani et al.,
2020; Wang et al., 2022). Approaches developed by
our team (Sun et al., 2022; Sun et al., 2023) are se-
quentially designed to predict the transmission dy-
namics of risk groups in disease transmission net-
works inferred by phylogenetic trees, while other au-
thors (Tomy et al., 2022) developed methods to recon-
struct the underlying social network structure with the
health status of involved patients.
The purpose of this study is to present a predictive
model designed to assess individual HIV risk within
a high-risk contact network (i.e., predicting individ-
uals in treatment or at risk), leveraging surveillance
data collected through routine HIV case interviews
in Florida. We will explore how the incorporation
of behavioral network information enhances the pre-
dictive capacity of the model when compared to a
model that mainly considers conventional HIV risk
factors, such as the diagnosis of sexually transmitted
infections (STIs) and the sharing of injection drug use
equipment. We will then investigate the importance of
demographic and behavior factors in the well-trained
models, providing insights for healthcare practition-
ers and policymakers in their efforts to control HIV
infection.
2 MATERIALS
2.1 Dataset Collection and Description
The Florida Department of Health (FDOH) man-
ages the Surveillance Tools and Reporting System
(STARS). Disease intervention specialists (DIS) at-
tempt to contact individuals who have recently been
diagnosed with a reportable sexually transmitted in-
fection, including those newly diagnosed with HIV,
for an interview. Among those who are able to be
reached, FDOH staff will identify recent risk behav-
iors, such as sexual and/or needle-sharing contacts
who are at higher risk for HIV transmission, during
the interview and then input this data into STARS.
HEALTHINF 2024 - 17th International Conference on Health Informatics
104

STARS data does not include data on prevalent cases
nor does it follow incident cases over time. FDOH
staff also collected information about the intervie-
wee’s demographics and potential exposures to HIV,
including past behaviors that increase the risk of con-
tracting HIV. They then attempted to notify the iden-
tified contacts to encourage them to be tested for HIV.
If the contact was subsequently diagnosed with HIV,
that individual would then be interviewed to elicit ad-
ditional contacts and collect further information on
their demographics and risk factors.
The STARS dataset used in this study contains in-
formation on PWH who received an HIV diagnosis
in Florida between 2000 and 2023, as well as their
reported contacts. We were provided with a version
of the dataset comprising 95,034 records related to
67,727 individuals. Through interviews, FDOH doc-
umented 77,984 pairs of contact relationships, and we
excluded 16, 355 individuals who lacked any contact
within the dataset (i.e., singletons). Consequently, the
dataset is organized into 14,978 distinct networks,
with network sizes varying between 2 and 50 indi-
viduals, except for one largest network containing
10,509 individuals.
2.2 Dataset Preprocessing
In our data preprocessing phase, we retained duplicate
records that were closest in timestamp to the creation
of the corresponding network link. For instance, if
multiple records existed for the same individual from
different years, we retained the record closest to the
time when all links connected to the node were estab-
lished, prioritizing temporal accuracy.
We identified 12 demographic and behavioral fea-
tures: gender, age, race, ethnicity, marital status, pres-
ence of needle-sharing partners, results of syphilis
tests, sexual orientation, history of sexually transmit-
ted diseases (STDs), engagement in MSM relations,
residence in the seven counties designated as EHE
Initiative, and number of sexual partners, as illus-
trated in Table 1. Data labeled as self-reported in-
formation, if available, took precedence over data en-
tered by clinical staff. For example, 205 individuals
were recorded as males, while a self-reporting gender
variable indicated transgender (male to female). We
considered them as transgender in our prediction. The
interview records indicate that a small portion of in-
dividuals refused to answer certain questions, such as
those related to ethnicity and a history of STIs. There-
fore, we treat this situation as a distinct category sep-
arate from missing data issues. To address missing
data, we employed the MissForest (Stekhoven and
B
¨
uhlmann, 2012) algorithm for data imputation, en-
suring the integrity and completeness of our dataset.
For the continuous variables, namely age and num-
ber of sexual partners, we applied z-score normaliza-
tion, standardizing each feature to have zero means
and unit variances. Conversely, for the remaining cat-
egorical features, we employed one-hot encoding for
their representation. It is noteworthy that we decided
to encode the presence of needle-sharing partners (a
binary categorical feature) rather than using the actual
number of reported needle-sharing partners (a numer-
ical one) in contrast to the number of sexual partners.
This decision stemmed from the fact that the majority
of needle-sharing partners counts, as evident in Ta-
ble 1, equate to zero. Utilizing z-score normaliza-
tion in this context would fail to effectively capture
distinctions among the numbers due to their predom-
inantly skewed distribution. Finally, each individual
was represented by 33 features after the preprocess-
ing phase.
There is an imbalanced distribution issue on net-
work size posed by the exceptionally large network
consisting of 10,509 individuals, resulting in a low
learning efficiency of models. To address this is-
sue, we employed the Leiden graph partitioning algo-
rithm (Traag et al., 2019), which was applied with de-
fault hyperparameters, primarily leveraging network
connectivity. The outcome of this partitioning process
yielded a total of 86 sub-networks, each comprising a
more manageable size, ranging from 43 to 290 indi-
viduals.
In terms of forecasting targets, we categorized the
population into two groups: treatment (comprising in-
dividuals diagnosed as HIV-positive) and prevention
(encompassing individuals not diagnosed as positive
but involved in interviews). Within our dataset, the
majority group consists of 51,372 (∼ 97.9%) individ-
uals classified as treatment (i.e., PWH), while the re-
maining 1,076 (∼ 2.1%) individuals are considered at
risk (i.e., HIV status negative or unknown).
3 METHODOLOGY
3.1 Learning Tasks
In our study, our primary focus was on the prediction
of HIV risk among individuals within a high-risk con-
tact network. We leveraged our set of 33 preprocessed
features in conjunction with network topology data.
We conducted our investigation through two distinct
learning tasks. The first task is named as inductive
learning, where our models were trained using a por-
tion of the networks and subsequently tested on en-
tirely new networks that were not part of the training
Learning on Forecasting HIV Epidemic Based on Individuals’ Contact Networks
105

Table 1: Demographic features of HIV epidemic data in Florida.
Treatment Prevention Σ
n 50,296 1,076 51,372
Gender (in %)
Male/Female/Other/Null
1
74.7/24.8/0.44/0.05 89.8/9.76/0.09/0.37 75.0/24.5/0.44/0.05
Age (in years)
mean±std
34.63 ± 12.05 29.98 ± 9.51 34.53 ± 12.02
Race (in %)
A/B/I/P/W/O/Null
2
0.63/51.6/0.17/0.11/
40.6/3.79/3.14
0.65/47.7/0.09/0.00/
36.8/4.83/9.94
0.63/51.5/0.17/0.11/
40.5/3.81/3.28
Ethnicity (in %)
H/NH/R/Null
3
19.5/75.1/0.17/5.20 17.1/70.1/0.09/12.7 19.5/75.0/0.17/5.35
Marital status (in %)
A/M/S/W/Null
4
0.52/6.51/30.1/0.24/62.7 0.00/1.49/28.0/0.09/70.4 0.51/6.41/30.0/0.24/62.8
Having needle partners (in %)
Yes/No
0.93/99.1 0.00/100.0 0.91/99.1
Syphilis test (in %)
Positive/Negative/Other/Null
5
13.2/8.69/2.66/74.4 5.86/2.79/19.2/72.1 13.1/8.57/3.99/74.4
Sexual orientation (in %)
Bisexual/Gay/Straight/Null
3.01/28.5/23.3/45.3 2.23/22.8/5.58/69.4 3.00/28.3/22.9/45.8
History of STDs (in %)
Yes/No/Refused to answer/Null
15.2/25.1/0.47/59.2 0.00/0.00/0.00/100.0 14.9/24.6/0.46/60.0
MSM (in %)
Yes/No
39.2/60.8 20.3/79.7 38.8/61.2
EHE (in %)
Yes/No
64.8/35.2 67.8/32.2 64.8/35.2
Number of sexual partners
mean±std/Null (in %)
4.14 ± 35.85/53.6 0 ± 0/100.0 4.14 ± 35.85/54.6
1
Other includes transgender populations.
2
A: Asian, B: Black or African American, I: American Indian or Alaska Native, P: Native Hawaiian or Other Pacific Islander, W: White, O:
Some other races.
3
H: Hispanic or Latino, NH: Not Hispanic or Latino, R: Refused to answer.
4
A: Attached, M: Married, S: Single, W: Widowed.
5
Other includes people who are deceased, out of jurisdiction, not recorded tests and administrative closeout.
set. In the second task, known as transductive learn-
ing, we constrained the training and validation dataset
to networks that existed between the years 2010 and
2018 while excluding nodes falling outside this tem-
poral range. Subsequently, the model was rigorously
evaluated on nodes introduced after the year 2018. To
facilitate the model learning about transmission pat-
terns from recent years, we excluded the data before
the year 2010 and only kept the corresponding net-
work topology.
We incorporated three traditional machine learn-
ing approaches as baseline models for our study.
These models were trained and evaluated using the
same training, validation, and testing datasets as the
graph-based approach. The only difference lies in the
input data, with baseline models exclusively utilizing
the 33 preprocessed features for prediction, but not
the network topology information.
3.2 Traditional Machine Learning
Approaches
In our investigation, we assessed the performance of
three traditional machine learning methods, i.e., lo-
gistic regression (LR) (Hosmer Jr et al., 2013), deci-
sion tree (DT) (Von Winterfeldt and Edwards, 1986)
and random forest (RF) (Breiman, 2001). LR aims
to fit a generalized linear model while minimizing the
sum of squared loss between node labels and linear
approximations, with inclusion of L2 regularization
for overfitting prevention. DT is an interpretable al-
gorithm often used for tabular data classification, cre-
ating a hierarchical set of rules through node-based
decisions. RF, on the other hand, is a robust en-
semble technique that constructs multiple decision
trees on bootstrapped subsets of training data and ag-
gregates their outputs for improving predictive accu-
racy. These methods were selected for their versatil-
ity and effectiveness in various machine learning ap-
plications, offering a range of complexity levels for
comparison in our study.
3.3 Graph Learning Approaches
The advantage of GNNs is utilizing the graph (a.k.a.
network) topology information to learn the node rep-
resentations. Following a general framework (Xu
et al., 2019), we provide a GNNs’ learning mecha-
HEALTHINF 2024 - 17th International Conference on Health Informatics
106

nism for node i with the Eq. 1 and 2 for the HIV risk
forecasting learning task.
m
l
i
= ρ
N(i)→i
(v
l−1
j
), j ∈ N(i) (1)
v
l
i
= φ(m
l
i
,v
l−1
i
) (2)
Here v
l
i
stands for the representations of node i in
layer l. For the first layer, node representations are
initialized as the 33-dimension preprocessed features.
N(i) denotes the neighbor nodes of node i in con-
tact network and function ρ(·) describes that node
i’s neighbors generate a message vector m
i
based on
their representations and send it to node i. φ(·) is the
representation updating function, taking the message
vector m
i
and previous node representations v
l−1
i
as
inputs. This process is called the message-passing
mechanism and it guides the network neighbors to
learn similar representations for the final prediction.
After iterative updating across layers, the final repre-
sentations are used for the prediction task through a
fully-connected layer:
s
i
= σ(W
FC
v
L
i
+ b
FC
) (3)
where s
i
∈ R
C
represents the predicted score of C
classes and L is the number of GNN layers. W
FC
and
b
FC
are learned parameters.
Inspired by spectral graph theory, Graph Convo-
lutional Networks (GCN) (Kipf and Welling, 2017)
was proposed by generalizing the Convolutional Neu-
ral Networks to graphs. Formally, a layer-wise prop-
agation rule is defined as:
m
l
i
=
∑
j∈{N(i),i}
v
l−1
j
W
l
/C (4)
v
l
i
= σ(m
l
i
+ b
l
i
) (5)
Here W
l
and b
l
i
are learned parameters in the l-th
layer. σ(·) is an activation function and we used
LeakyReLU in our experiments. C is a normalization
constant corresponding with the neighbor size.
Xu et al. proposed the GIN variant (Xu et al.,
2019), which supposedly achieves the maximum dis-
criminative power among graph neural networks. It
uses a multilayer perceptron (MLP) model in the
message-passing process:
m
l
i
=
∑
j∈N (i)
v
l−1
j
(6)
v
l
i
= MLP
l
((1 + ε
l
) · v
l−1
i
+ m
l
i
) (7)
where ε is a learnable parameter. Different from gen-
erating whole graph embedding as proposed in (Xu
et al., 2019), here we directly apply fully connected
layers on nodes’ features in each layer and generate
the final prediction score by summation over random
dropout:
s
i
=
L
∑
l=1
Dropout(W
l
v
l
i
+ b
l
) (8)
In this work, we use both the GCN and GIN models.
3.4 Model Evaluation Metrics
We evaluate all models through four key performance
metrics: accuracy, precision, F1-score, and the area
under the receiver operator characteristic curve (AU-
ROC). To address the highly imbalanced label dis-
tribution within our dataset, we adopted a macro-
averaging strategy, which involves the initial calcu-
lation of each metric for each class individually, fol-
lowed by their equal averaging to yield the final met-
rics. This approach can effectively avoid overestimat-
ing the models that only perform well on the common
classes while performing pooling on the rare classes.
3.5 Model Interpretation
To investigate how important each feature performs in
the prediction process, we calculated the permutation
importance (Altmann et al., 2010) of each feature in
the model evaluation phase. Permutation importance
entails the random shuffling of each feature within the
testing dataset, followed by an evaluation of the ex-
tent to which the model’s performance is affected. A
larger decrement in performance signifies a higher de-
gree of importance for the respective feature.
4 EVALUATION
4.1 Experiment Settings
Because the dataset is heavily imbalanced, with
97.9% treatment individuals and 2.1% prevention in-
dividuals, we utilized a weighted cross-entropy loss
function for optimization, and the weights for each
class are calculated based on their inverses of class’s
prevalence, so that the minor class will be assigned
with higher weights. This will enforce the model to
learn to predict samples from minor class accurately
as opposed to simply classifying all samples into the
major class. An Adam optimizer was employed, ini-
tialized with a learning rate of 10
−3
. Furthermore,
we implemented a learning rate reduction strategy,
wherein the learning rate was reduced by 90% if the
validation loss did not improve for several consecu-
tive epochs until it reached a minimum value of 10
−6
.
Learning on Forecasting HIV Epidemic Based on Individuals’ Contact Networks
107

Table 2: Model performances on inductive learning task.
Acc Pr F1 AUROC
LR 0.708 0.512 0.420 0.782
RF 0.721 0.514 0.454 0.805
DT 0.723 0.513 0.425 0.783
GCN 0.727 0.514 0.437 0.789
GIN 0.773 0.521 0.487 0.837
The number of waiting epochs, i.e., patience, is dif-
ferent from different models. In the inductive learn-
ing task, we included all 86 sub-networks separated
from the largest network to the training set. The idea
is to avoid the data linkage because the sub-networks
from the same largest network might have potential
relationships and this will break the independence of
the testing dataset.
4.2 Inductive Learning Task
To explore the influence of network topology on our
prediction task, we conducted an evaluation of GNNs
within the framework of inductive learning. In the
case of LR, the best model employed an L2 regular-
ization parameter of 10
−4
. The top-performing RF
model comprised 50 ensemble estimators, each with
a maximum depth of 25, a minimum of 14 samples
required for leaf nodes, and a minimum of 6 samples
to split an internal node. As for the DT model, its op-
timal configuration featured a maximum depth of 7,
a minimum of 10 samples for leaf nodes, and a min-
imum of 10 samples for split nodes. Regarding the
GNN variants, the most effective GCN model con-
sisted of 10 GCN layers, with a hidden vector size of
32 dimensions. This model underwent training with
a mini-batch size of 128. The GIN model, on the
other hand, utilized 10 GIN layers and a hidden vec-
tor size of 64 dimensions. It employed a 5-layer MLP
for message-passing and a dropout rate of 50%. The
mini-batch size for GIN was set to 256. For both mod-
els, the waiting patience is set to 50.
As illustrated in Table 2, both GNN models
demonstrated commendable performance when com-
pared to traditional machine learning models. Specif-
ically, the GIN model achieved a balanced accu-
racy of 77.3% and a macro-averaged AUROC of
0.837. Notably, GIN outperformed the Decision Tree
(DT), the top-performing model among traditional
machine learning approaches, by a substantial margin
of 6.91% in balanced accuracy and 6.90% in macro-
averaged AUROC. Both precision and F1-score met-
rics, due to the dataset’s inherent class imbalance, ex-
hibit some sensitivity to misclassification of the ma-
jority class, resulting in relatively lower scores. Nev-
ertheless, GIN achieved improvements of 1.56% and
14.6% in Precision and F1-score, respectively, over
the baseline DT model. In the case of the GCN model,
while its performance was slightly less than GIN, it
still exhibited an accuracy of 72.7% and an AUROC
of 0.789, surpassing the Decision Tree (DT) by 0.55%
in accuracy and 0.77% in AUROC. These findings un-
derscore the significant contribution of network topol-
ogy information to our prediction task. Furthermore,
they establish GIN as an effective model in compar-
ison to established baseline models, highlighting its
potential to enhance predictive accuracy.
4.3 Transductive Learning Task
In our quest to simulate a more challenging real-world
scenario, we narrowed our focus to networks estab-
lished between 2010 and 2018 for training and valida-
tion, with a subsequent evaluation of predictive per-
formance on records generated post-2019. The op-
timal configuration for LR involved an L2 regular-
ization parameter of 10
−3
. In the case of RF, peak
performance was achieved with an ensemble of 120
estimators, each requiring a minimum of 21 samples
for leaf nodes and a minimum of 19 samples for split
nodes. For the DT model, the most effective settings
comprised a maximum depth of 7, a minimum of 15
samples for leaf nodes, and a minimum of 11 samples
for split nodes. Regarding the GNN variants, Both
GCN and GIN models featured 5 GNN layers with a
hidden vector size of 64 dimensions. The mini-batch
size was configured at 128. The waiting patience of
GCN is set to 15 and the value is 25 for GIN.
The outcomes, as outlined in Table 3, unveil a pro-
nounced decline in model performance compared to
the results presented in Table 2. This shift under-
scores the evolving dynamics of disease transmission
over time, implying that the data distribution is likely
to shift rather than remain stable. This dynamic nature
of the data distribution poses a significant challenge
to the prediction task. Notably, the GIN model ex-
perienced a 5.3% drop in balanced accuracy, shifting
from 77.3% to 73.2%, while the GCN model faced a
3.58% decrement. In this context, RF exhibited su-
perior resilience to temporal shifts, displaying a rel-
ative decrement of only 2.50%, thus establishing its
supremacy among traditional machine learning mod-
els for this particular task and dataset. Despite the
challenges posed by shifting transmission patterns,
the GIN model remained at the forefront, delivering
a balanced accuracy of 73.2% and a macro-averaged
AUROC of 0.776. GIN surpassed RF by a margin
of 4.13% in balanced accuracy; and 1.17% in macro-
averaged AUROC. Further underscoring GIN’s dom-
inance, it also posted notable improvements of 0.95%
HEALTHINF 2024 - 17th International Conference on Health Informatics
108
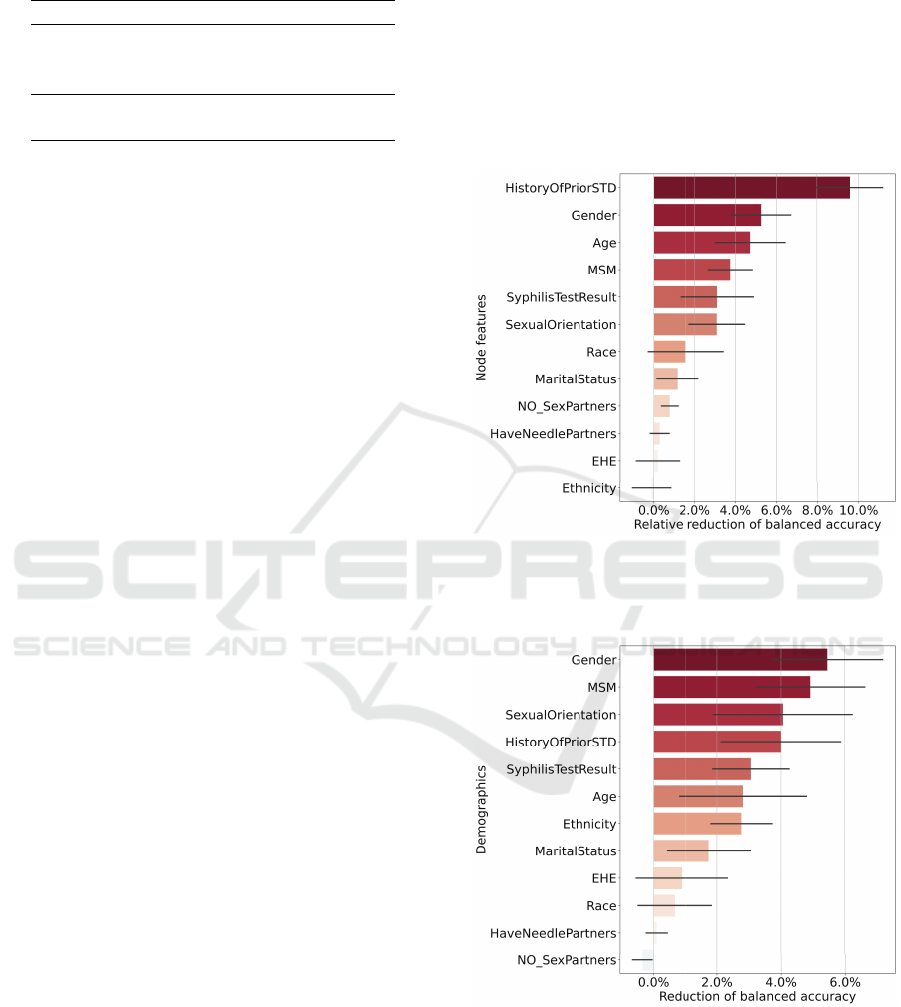
Table 3: Model performances on the transductive learning
task.
Acc Pr F1 AUROC
DT 0.666 0.518 0.444 0.718
LR 0.670 0.518 0.440 0.745
RF 0.703 0.523 0.464 0.767
GCN 0.697 0.519 0.450 0.752
GIN 0.732 0.528 0.481 0.776
in precision and 3.66% in F1-score over the baseline
RF model. In contrast, the GCN model grappled with
limitations inherent to training on data with temporal
restrictions, ultimately yielding performance inferior
to RF in this context. These findings not only high-
light the temporal evolution of transmission patterns
but also reaffirm the efficacy of the GIN model as a
predictive model, positioning it as a potent instrument
for bolstering predictive accuracy even in the face of
shifting epidemiological dynamics.
4.4 Interpretation of Learned GIN
Model
To address questions regarding the significance of fea-
tures in predictive modeling and their variations be-
tween the inductive and transductive learning tasks,
we conducted an analysis of permutation importance.
This analysis was performed using the GIN models
from the inductive and transductive learning scenar-
ios respectively. To ensure robustness and reliability
in our assessment, we conducted the permutation pro-
cess 20 times for each feature, and the results are pre-
sented in Figures 1 and 2.
In Figure 1, the permutation importance analysis
reveals that having a history of STDs emerges as the
most influential factor in forecasting the risk of HIV
infection among individuals. This is followed closely
by gender, age, and MSM. Referring to the demo-
graphic and behavioral feature distribution in Table 1,
the treatment population has higher proportions of in-
dividuals who are of older age and who identify as
MSM. In the transductive learning task, the top four
important features, namely gender, MSM, having a
history of STDs, and ethnicity, underscore their sub-
stantial impact on the prediction task. Intriguingly, as
we limit the training dataset to records before 2019,
age assumes a comparatively diminished importance.
Instead, the model’s focus shifts towards sexual ori-
entation and ethnicity.
Notably, in both figures, individuals residing in
EHE-designated counties exhibit notably lower im-
portance. This observation may be attributed to a cou-
ple of factors. Firstly, the similarity in feature distri-
butions between the treatment and prevention popula-
tions, as emerging from Table 1, could reflect a bias
in the data collection process, particularly as inter-
views were conducted through contact tracing. Sec-
ondly, the embedding of county information within
network topology may contribute to the marginal im-
pact of shuffling the EHE feature on performance re-
duction. The same explanation comes from the low
importance of having needle partners and the number
of sexual partners.
Figure 1: Permutation feature importance of GIN model in
the inductive learning task. Features were ranked by the
permutation importance scores. The x-axis shows a relative
reduction value of balanced accuracy.
Figure 2: Permutation feature importance of GIN model in
transductive learning task. Features were ranked by the per-
mutation importance scores. The x-axis shows a relative
reduction value of balanced accuracy.
Learning on Forecasting HIV Epidemic Based on Individuals’ Contact Networks
109

5 CONCLUSIONS
In this work, we investigated the utility of GNNs in
the HIV risk forecasting task. Our results on inductive
and transductive learning tasks indicate that GNNs,
especially the GIN model, outperform traditional ma-
chine learning approaches. Our exploration of demo-
graphic and behavioral factors underscored the signif-
icance of certain variables–having a history of STDs,
gender, age, and MSM–in our predictive model.
In summary, our study highlights the potential of
embedding the contact network in enhancing the ac-
curacy of HIV risk prediction. We stress the impor-
tance of accounting for temporal dynamics and de-
mographic factors in predictive modeling for pub-
lic health applications. The findings presented here
might offer valuable insights for healthcare practition-
ers and policymakers as they continue their efforts to
combat HIV infection. Our model can inform the tar-
geted allocation of resources, providing understand-
ing beyond only knowing the demographics and lo-
cations of those newly diagnosed with HIV, for more
impactful intervention. This could allow stakeholders
to address critical EHE pillars more effectively.
Based on our experiments in the transductive
learning task, it becomes evident that capturing tem-
poral relationships poses a more intricate challenge
for predictions. In this context, the performance
of the GIN model did not reach the same level
of effectiveness observed in the inductive learning
task. This limitation highlights an avenue for po-
tential enhancement, suggesting the implementation
of dynamic GNNs (Skarding et al., 2021) to bet-
ter capture the evolving temporal dynamics across
the years. Another limitation is that the models are
trained and validated solely on the STARS dataset
from Florida. Their effectiveness on the datasets with
more heterogeneous sources from other regions and
demographics remains unexplored. Additionally, for
model architecture, a comparative analysis with exist-
ing GNNs utilized in forecasting tasks, e.g., (Kapoor
et al., 2020; Ramchandani et al., 2020; Wang et al.,
2022) is warranted for future studies.
6 CODE AVAILABILITY
The code we used to develop our models is at
https://github.com/lab-smile/HIV Risk Pred with an
MIT License and is written in Python.
ACKNOWLEDGEMENTS
The authors abide to the Declaration of Helsinki. The
study protocol was approved by the University of
Florida’s Institutional Review Board (IRB) and by
FDOH’s IRB (protocol #IRB201901041 and #2020-
069, respectively) as exempt. We received data ex-
tracts from FDOH’s STARS in a fully de-identified
format according to the Health Insurance Portabil-
ity and Accountability Act (HIPAA). For replication
purposes, a STARS data request to the FDOH can
be made according to state, federal regulations and
compliance with required ethical and privacy policies
(Research@flhealth.gov), including IRB approval by
FDOH and execution of data user agreement. Re-
quests are independently reviewed by FDOH. We
would like to express our gratitude to Colby Cohen
and Jared Jashinsky from FDOH for their invaluable
assistance in preparing the STARS data for our analy-
sis, for their responsiveness to our inquiries regarding
the dataset, and for their instrumental role in facil-
itating the FDOH internal review and approval pro-
cess for our manuscript. This work was supported
in part by NIH grant R01AI145552, 1F31AA030518-
01, R01AI172875 and 1F31AA030733-01. The find-
ings and conclusions in this work are those of the au-
thors and do not necessarily represent the views of the
FDOH.
REFERENCES
Altmann, A., Tolos¸i, L., Sander, O., and Lengauer, T.
(2010). Permutation importance: a corrected feature
importance measure. Bioinformatics, 26(10):1340–
1347.
Breiman, L. (2001). Random forests. Machine learning,
45(1):5–32.
Centers for Disease Control and Prevention (2023). Diag-
noses of HIV infection in the United States and de-
pendent areas, 2021. https://www.cdc.gov/hiv/statisti
cs/overview/ataglance\\.html.
Deng, S., Wang, S., Rangwala, H., Wang, L., and Ning,
Y. (2020). Cola-GNN: Cross-location attention based
graph neural networks for long-term ILI prediction.
In Proceedings of the 29th ACM International Con-
ference on Information & Knowledge Management,
pages 245–254. Association for Computing Machin-
ery. October 19-23, 2020.
Fauci, A. S., Redfield, R. R., Sigounas, G., Weahkee, M. D.,
and Giroir, B. P. (2019). Ending the HIV epidemic: a
plan for the United States. JAMA, 321(9):844–845.
Florida Department of Health (2017). Epidemiological Pro-
file, Florida: Continuum of HIV Care by County,
2017. Retrieved March 30, 2018, from https://ww
w.floridahealth.gov/diseases-and-conditions/aids/sur
HEALTHINF 2024 - 17th International Conference on Health Informatics
110

veillance/epi-profiles/Epi\ Profile\ Tables\ Florida
\ 2018\ Locked.xlsx.
Florida Department of Health (2020). Florida’s Uni-
fied Ending the HIV Epidemic Plan [Division
of Disease Control and Health Protection Bu-
reau of Communicable Diseases HIV/AIDS Sec-
tion]. https://www.floridahealth.gov/diseases-and-
conditions/aids/administration/ documents/fl-unified-
ehe-plan.pdf.
Florida Department of Health (2023). HIV, AIDS and
PWH Cases by Year and by County in Florida.
https://www.flhealthcharts.gov/ChartsDashboards/rd
Page.aspx?rdReport=HIVAIDS.DataViewer&cid=986
6.
Hosmer Jr, D. W., Lemeshow, S., and Sturdivant, R. X.
(2013). Applied logistic regression, volume 398. John
Wiley & Sons.
Kapoor, A., Ben, X., Liu, L., Perozzi, B., Barnes, M., Blais,
M., and O’Banion, S. (2020). Examining COVID-
19 forecasting using spatio-temporal graph neural net-
works. arXiv preprint arXiv:2007.03113.
Kipf, T. N. and Welling, M. (2017). Semi-Supervised Clas-
sification with Graph Convolutional Networks. In In-
ternational Conference on Learning Representations
(ICLR), Palais des Congr
`
es Neptune, Toulon, France.
April 24 - 26, 2017.
Lieb, S., White, S., Grigg, B. L., Thompson, D. R., Lib-
erti, T. M., and Fallon, S. J. (2010). Estimated
HIV incidence, prevalence, and mortality rates among
racial/ethnic populations of men who have sex with
men, Florida. JAIDS Journal of Acquired Immune De-
ficiency Syndromes, 54(4):398–405.
Liu, Y., Parisi, C., Fisk-Hoffman, R., Salemi, M., Viteri,
D., Prosperi, M., and Marini, S. (2023). Behavioral
and demographic profiles of HIV contact networks in
Florida. In International Conference on Intelligent Bi-
ology and Medicine (ICIBM 2023), Tampa, Florida,
United States. July 16-19, 2023. Abstract number
6527.
Ramchandani, A., Fan, C., and Mostafavi, A. (2020). Deep-
covidnet: An interpretable deep learning model for
predictive surveillance of COVID-19 using heteroge-
neous features and their interactions. IEEE Access,
8:159915–159930.
Skarding, J., Gabrys, B., and Musial, K. (2021). Founda-
tions and modeling of dynamic networks using dy-
namic graph neural networks: A survey. IEEE Access,
9:79143–79168.
Stekhoven, D. J. and B
¨
uhlmann, P. (2012).
MissForest—non-parametric missing value im-
putation for mixed-type data. Bioinformatics,
28(1):112–118.
Sun, C., Fang, R., Salemi, M., Prosperi, M., and Rife Ma-
galis, B. (2023). DeepDynaForecast: Phylogenetic-
informed graph deep learning for epidemic transmis-
sion dynamic prediction. bioRxiv, pages 2023–07.
Sun, C., Li, Y., Marini, S., Riva, A., Wu, D. O., Salemi,
M., and Magalis, B. R. (2022). Phylogenetic-informed
graph deep learning to classify dynamic transmission
clusters in infectious disease epidemics. bioRxiv,
pages 2022–04.
Tan, R. K. J., Tang, W., and Tucker, J. D. (2023). Pub-
lic health services and intersectional stigma: a social
sciences perspective with implications for HIV ser-
vice design and delivery. Current Opinion in HIV and
AIDS, 18(1):18–26.
Tomy, A., Razzanelli, M., Di Lauro, F., Rus, D., and
Della Santina, C. (2022). Estimating the state of epi-
demics spreading with graph neural networks. Non-
linear Dynamics, 109(1):249–263.
Traag, V. A., Waltman, L., and Van Eck, N. J. (2019). From
Louvain to Leiden: guaranteeing well-connected
communities. Scientific Reports, 9(1):5233.
Trepka, M. J., Niyonsenga, T., Maddox, L., Lieb, S., Lutfi,
K., and Pavlova-McCalla, E. (2013). Community
poverty and trends in racial/ethnic survival dispari-
ties among people diagnosed with AIDS in Florida,
1993–2004. American Journal of Public Health,
103(4):717–726.
Von Winterfeldt, D. and Edwards, W. (1986). Decision
analysis and behavioral research.
Wang, L., Adiga, A., Chen, J., Sadilek, A., Venkatramanan,
S., and Marathe, M. (2022). Causalgnn: Causal-based
graph neural networks for spatio-temporal epidemic
forecasting. In Proceedings of the AAAI Conference
on Artificial Intelligence, volume 36, pages 12191–
12199. February 22 – March 1, 2022.
Wright, I. A., Reid, R., Shahid, N., Ponce, A., Nelson,
C. M., Sanders, J., Gardner, N., Liu, J., Simmons, E.,
Phillips, A., Pan, Y., Alcaide, M. L., Rodriguez, A.,
Ironson, G., Feaster, D. J., Safren, S. A., and Dale,
S. K. (2022). Neighborhood Characteristics, Intersec-
tional Discrimination, Mental Health, and HIV Out-
comes Among Black Women Living With HIV, South-
eastern United States, 2019–2020. American Journal
of Public Health, 112(S4):S433–S443.
Wu, Z., Pan, S., Chen, F., Long, G., Zhang, C., and Philip,
S. Y. (2020). A comprehensive survey on graph neural
networks. IEEE Transactions on Neural Networks and
Learning Systems, 32(1):4–24.
Xu, K., Hu, W., Leskovec, J., and Jegelka, S. (2019).
How powerful are graph neural networks? In-
ternational Conference on Learning Representations
(ICLR). May 6 - 9, 2017.
Zhang, L., Wang, S., and Liu, B. (2018). Deep learning
for sentiment analysis: A survey. Wiley Interdisci-
plinary Reviews: Data Mining and Knowledge Dis-
covery, 8(4):e1253.
Zhou, J., Cui, G., Hu, S., Zhang, Z., Yang, C., Liu, Z.,
Wang, L., Li, C., and Sun, M. (2020). Graph neu-
ral networks: A review of methods and applications.
AI Open, 1:57–81.
Learning on Forecasting HIV Epidemic Based on Individuals’ Contact Networks
111
